Ludditus
Members
-
Joined
-
Last visited
Everything posted by Ludditus
-
Thanks. That seems like a very straightforward solution - I will try it out.
-
I am trying to use a custom cron schedule but it doesn't seem to be (fully) working. The cron entry is 0 3 1-7,15-21 * 4 which should run at 0300 on a Thursday in days 1-7 and days 15-21 (essentially twice a month). However, this month the backup ran on 6 March but not on 20 March. I have checked /etc/cron.d/root and the entry seems to match what I am trying to achieve: # Appdata.Backup cron settings 0 3 1-7,15-21 * 4 php /usr/local/emhttp/plugins/appdata.backup/scripts/backup.php > /dev/null 2>&1 Any ideas - does UNRAID not interpret the 1-7,5-21 correctly?
-
I am running UNRAID 6.12.13 with the unraidapi-re:6.12 tagged container. The MQTT connection to Home Assistant is working but the docker console continually shows a log error when trying to find a file 'mqttDisabledDevices.json' in /config. That file doesn't exist in /config and I'm not sure what process would cause it to be written. Error: ENOENT: no such file or directory, open 'config/mqttDisabledDevices.json' at Object.openSync (node:fs:590:3) at Object.readFileSync (node:fs:458:35) at updateMQTT (/app/mqtt/index.ts:388:21) at Timeout._onTimeout (/app/mqtt/index.ts:433:5) at listOnTimeout (node:internal/timers:559:17) at processTimers (node:internal/timers:502:7) { errno: -2, syscall: 'open', code: 'ENOENT', path: 'config/mqttDisabledDevices.json' I've found the source of the code in mqtt/index.ts, line 385-392. I tried commenting out the error logging but then the container wouldn't run. Does anybody have the mqttDisabledDevices.json file in their /config directory? I've checked back through a number of old backups and that file has never been in my config. The container seems to be running fine but I'd prefer not to be using up resources with the continual error and logging.
-
Count me in! I'd be happy to help. This was the project that got me to really understand how Grafana works, I'd love to spend more time tailoring 1.7 for my install. On a separate note, I think when you run out of single alphabet letters for array drives (sda/sdb/sdc) and have to go to sdae, it might be time to admit that there is a problem. 😆
-
Just want to add another shout out for Recovery Explorer. I had inadvertently wiped out most of my media share, RE allowed me to recover about 90% of the deleted files to an external drive. The rest I was able to pull down from an old AWS Glacier backup. It definitely was painstaking trying to figure out which recovered files ended up in which directories - a lot of $RecoveredFile subdirectories - but at least it was possible. And now, I have learned a valuable lesson and set most of my media share directories to read-only. 😒
-
Just want to add another shout out for Recovery Explorer. I had inadvertently wiped out most of my media share, RE allowed me to recover about 90% of the deleted files to an external drive. The rest I was able to pull down from an old AWS Glacier backup. It definitely was painstaking trying to figure out which recovered files went where, but at least it was possible. And now, I have learned a valuable lesson and set most of my media share directories to read-only. 😒
-
My only other suggestion would be try to track down a manual for the UPS and see what it says about options for network monitoring. And/or do some google searching for the UPS model number to see what you can find about that specific device.
-
There are a couple ways to get the UPS data - USB connection or over the network. Sounds like your UPS only has the network option. You may need to connect the UPS directly to the network (router or switch) instead of to your server, then the server would point to the IP address of the UPS. You can read about the different kind of connections at http://www.apcupsd.org/manual/#supported-upses-and-cables -- sounds like you will be using SNMP. The UNRAID UPS menu has options for ethernet/SNMP as well as the USB connection. Once you have the UPS data connected to UNRAID, telegraf should report it regardless of whether you are using a network or USB connection.
-
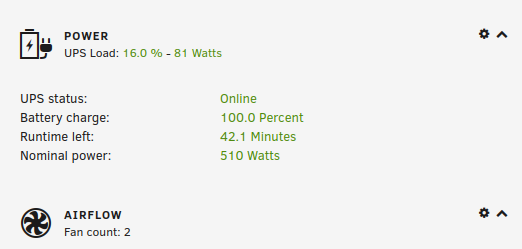
Are you getting the UPS stats on the dashboard of your UNRAID server, like this? If not, then you probably have some additional configuration to make sure that data is being received in UNRAID, if your UPS is capable of reporting and already connected to your UNRAID server via USB. That's done on the Settings page under Systems Settings | UPS Settings. My recommendation would be to comment out that line until you have telegraf up and running - then you can experiment with changes to telegraf.conf and adding back in additional plugins by un-commenting those lines. Don't be afraid of editing the telegraf.conf file, it's pretty simple. Most of it is just un-commenting sections that you want to add and changing default values/addresses to match your system. Just make sure you make a backup copy of a known working config file before you start editing, in case you need to roll back. And, after each change you will either need to restart the telegraf service from the terminal, or restart the docker, to incorporate the change. Depending on your level of interest in Grafana/Influx, I found it very helpful to use InfluxDB Studio running on a Windows PC to see all of the measurements that were being stored in the database. That let me see what was being recorded by telegraf in the database, which helped troubleshoot areas where I wanted to customize the UUD and other dashboards in Grafana.
-
No idea, but I did get a response when I posted an issue to their Git a ways back. They didn't take up my request (to add a friendly name field in the config, in case of multiple Tautulli servers), but they did exchange a few comments about it.
-
I just took a look at my Varken install and the retention policy was already on autogen with 7d shards, and I can get queries back as far as I want. I don't ever remember setting that policy explicitly, but I think I had manually created varken within the influx docker bash, since I wanted to have it alongside existing databases in the same container. Maybe doing it that way instead of having Varken create it's own database avoided the 30d retention policy.
-
I'm not interested in upgrading to Influx 2.0 at this point. I've got a dozen-plus dashboards and I don't want to have to refactor them all to 2.0, so sticking with 1.7 is fine as far as I am concerned!
-
I think that the dashboard is designed for 1.x, but I haven't tested 2.0 at all. If I recall, when the Influx upgrade got pushed out, a bunch of people had issues and rolled back to a 1.x version to keep things working. Unless you really want to use Flux for your queries, Influx 1.x is probably more compatible with a lot of Grafana community dashboards, and better documented. I've stayed on 1.8 and have yet to see a compelling reason to upgrade as the older versions still get security updates. To get the specific Docker version in UNRAID, edit the docker options and put influxdb: 1.8 (or 1.10, whatever you want) in the Repository field.
-
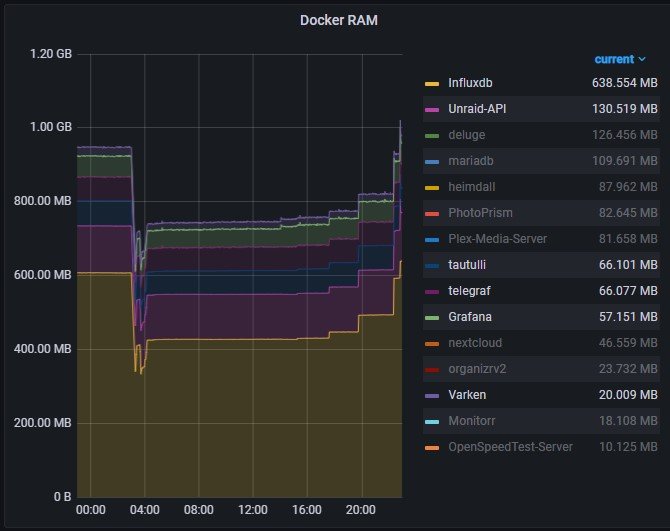
Mine uses between 700-1000MB of RAM for the 6 dockers that compose the UUD. However, over 600MB of that is the Influx docker and I have a lot of devices other than UNRAID writing to my influx docker, so you may likely be around 300MB total. CPU load is between 1.5 to 3% load on a Core i7-4790. It's very periodic, certainly not much of a sustained requirement. Chrome tab to load it is about 195Mb, compared with 105Mb for this page.
-
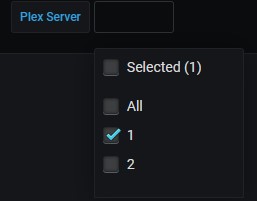
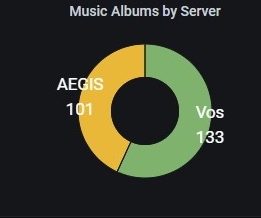
I have gotten Varken/UUD working with multiple Tautulli servers, which are selectable as a variable in the dashboard. If anybody is interested in trying to do that, let me know and I can write up the steps. There is one current limitation, as far as I can tell - Varken can be configured to access multiple Tautulli servers but can only notate them as 1,2,...n. To make that meaningful in the dashboard I had to use either rename transformations or name/value overrides to switch from '1' to the friendly name of the server. The server name does not seem to be stored anywhere in the Influx table for Varken.
-
Thanks. I think the query is working correctly, as it does pares out most of the containers. On a whim I switched my Deluge docker from host to bridge. Then I couldn't access the WebUI so I changed it back to host. But, lo and behold, it was now reporting the TX/RX stats on the dashboard. Looking forward to 1.5!
-
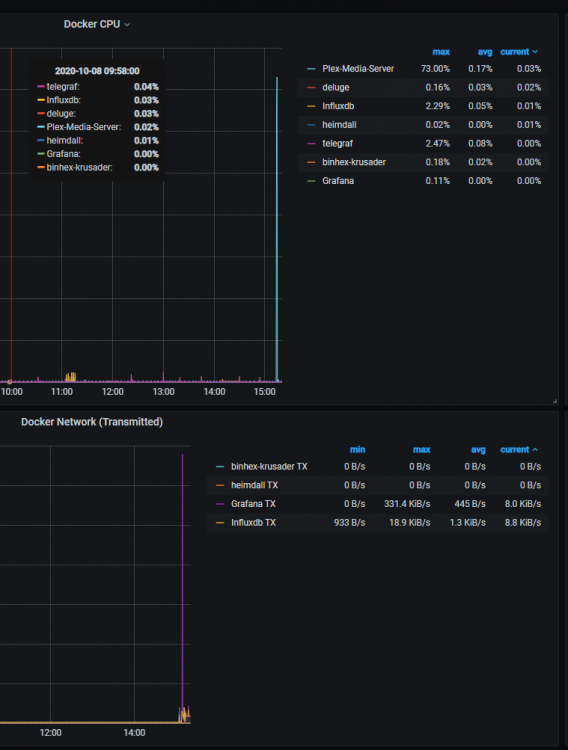
Thanks for the great dashboard! I have one weird situation - incomplete list of Docker containers. For the Docker CPU and RAM graphs, I can see all 7 of my Docker containers. For Docker Network TX/RX, I can only see 5 of the 7 (notably, Plex and telegraf aren't reporting). Is there a network setting in the containers themselves that is needed in order to report TX/RX via telegraf? Does it matter if they are in host or bridge network mode? Thanks again!