


Corvus
Members
-
Joined
-
Last visited
-
Thanks, that should be more than enough for 95% of the time. At the very least, Plex can fall back to the iGPU. I apologize and that's not my intention. If anything, I'm asking on advice in removing the patch. Now that I know the information above, I can do this confidently. I understand this, although since replacing a PSU is a major job (especially in the cramped case my system is in), I want to rule out software fixes first beforehand.
-
Just a follow-up on this to see what I need to do with this user script -- or if it's even necessary anymore to get unlimited transcodes.
-
Ok I just found what it is. Apparently it was recommended by SpaceInvader to remove the nvidia-imposed limit on the number of simultaneous transcoding streams. Is this something that is no longer required for me to get unlimited simultaneous transcodes? Happy to remove this if so. There isn't, which is why I rely on using the GPU for dockers. It's a Corsair CXM 750 W 80+. More than enough for my config + drives, according to pcpartpicker.
-
I have no idea. How do I remove it? Since I use the iGPU for my VMs, I still don't think this is a good idea. I also have a few AI object recognition dockers which utilize nvidia CUDA cores. Unless there's an alternative I'm missing? So I just type that command into terminal, and that's it? Does this remove the patch script you're seeing above? Since I need the dedicated GPU for other dockers (not used simultaneously), I would still like to solve this problem. How would I go about checking for an intermittent fault such as this? I think I should rule out the easy fixes first, starting with this custom script you mentioned. Could you please tell me how to remove it?
-
Why what? Sorry I'm a newbie at this. I'm assuming you mean that I modified the nvidia plugin somehow? That's impossible as I wouldn't even know how to do that. Unless I did so unwittingly by following someone else's advice. How would I undo this? 2. I have a large number of users. Sometimes up to 8-10 streams needing transcoding at once. BIOS is up to date. 'Above 4G decoding' is enabled in BIOS (unless I need to enable it elsewhere?). What is 'resizable BAR support'? Use what as my startup script? What does typing 'nvidia-persistenced' in terminal do? Sorry, again I'm very unfamiliar with Linux so I'll need much more detailed instructions please. 4. I run a couple of VMs 24/7 (No GPUs passed through) and I don't want to eat into the performance of my CPU, so I'm using the GPU for transcoding as I had it lying around. Additionally, I also use it for running my own 24/7 IPTV channels in another docker container. What should I be doing to fix this?
-
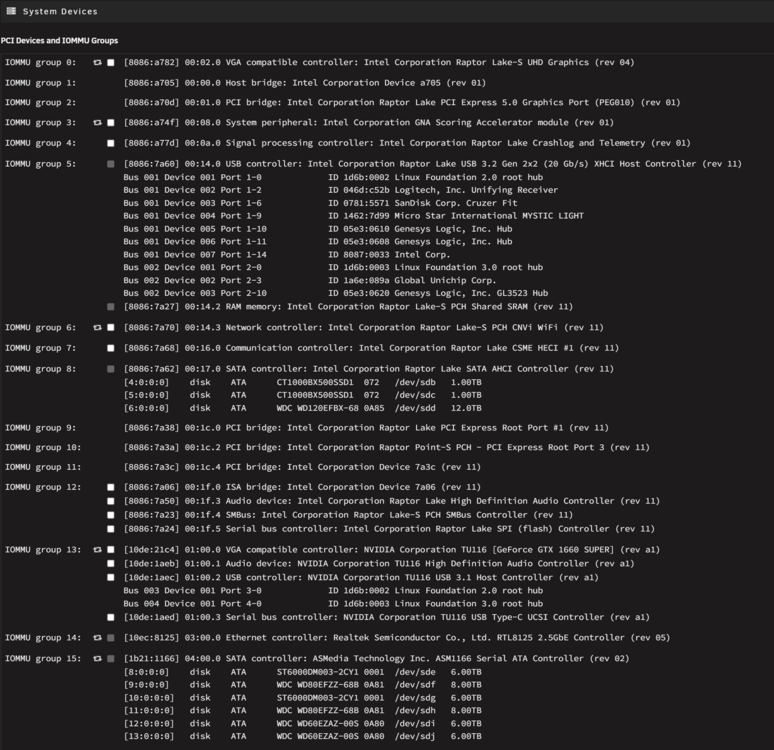
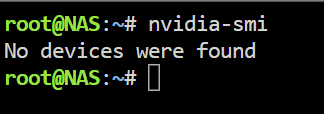
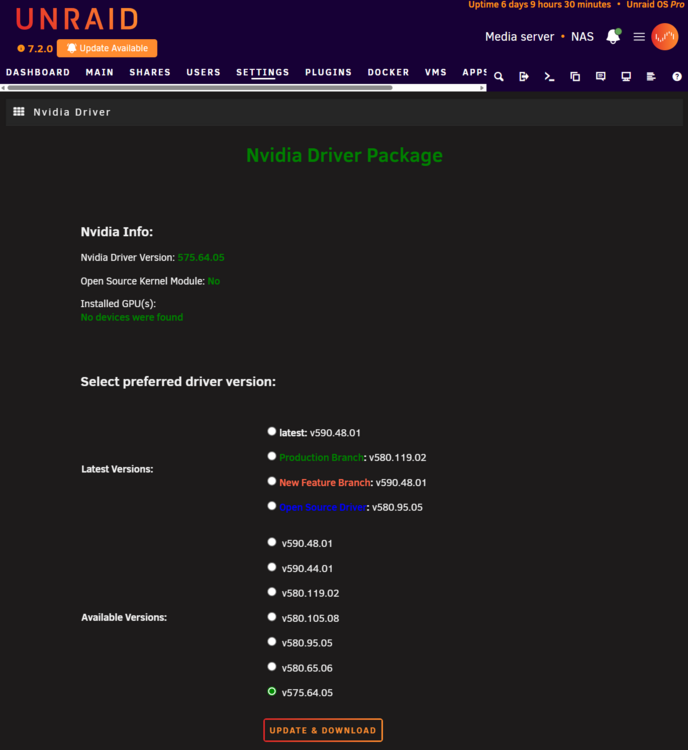
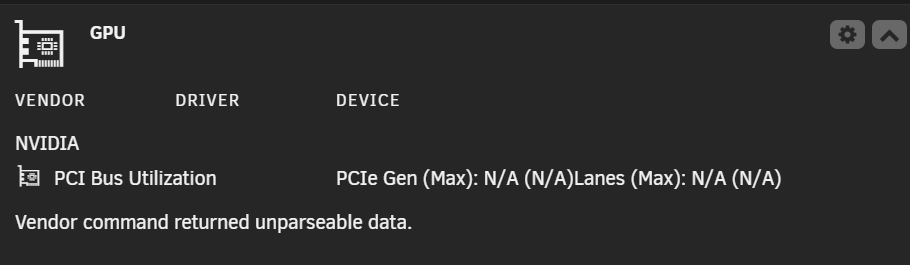
Hey guys, This problem has been going for MONTHS and it's driving me insane because just when I think I've fixed it, it happens again. So I mainly use this card for Plex transcoding, and when the Nvidia driver is detecting the card normally, it works flawlessly. When trandcoding, the GPU statistics plugin correctly displays the Plex icon and nvidia-smi returns the appropriate data. Needless to say, I have correctly set up the Plex docker for the nvidia transcoding. I DON'T have it passed through to a VM. However every few weeks, the nvidia driver/plugin decides it no longer wants to detect the card, and will not detect it again until I reboot the entire server. I've attached diags and screenshots. See below. The card is visible in system devices under IOMMU group 13: [10de:21c4] 01:00.0 VGA compatible controller: NVIDIA Corporation TU116 [GeForce GTX 1660 SUPER] (rev a1). However I can find no trace of it anywhere else. Even running 'nvidia-smi' returns 'No devices were found'. I've double and triple checked that the card is seated correctly. I've deleted the Nvidia plugin/driver, stopped docker, then reinstalled several times. I've rolled back the driver as far back as the plugin will allow (v575.64.05), but still no success. This also used to happen with my older 1050Ti on a different motherboard before I upgraded the system. I'm sick to death of logging into the web UI and discovering that the GPU Statistics plugin has not detected the card (god knows for how long), and I need this fixed PERMANENTLY. Any ideas??? nas-diagnostics-20251224-0010.zip
-
This also happened with my old 1080ti on another motherboard before I upgraded my Unraid build, so I doubt it's a hardware fault. What should I do next?
-
Hey guys, This problem has been going for MONTHS and it's driving me insane because just when I think I've fixed it, it happens again. So I mainly use this card for Plex transcoding, and when the Nvidia driver is detecting the card normally, it works flawlessly. When trandcoding, the GPU statistics plugin correctly displays the Plex icon and nvidia-smi returns the appropriate data. Needless to say, I have correctly set up the Plex docker for the nvidia transcoding. I DON'T have it passed through to a VM. However every few weeks, the nvidia driver/plugin decides it no longer wants to detect the card, and will not detect it again until I reboot the entire server. I've attached diags and screenshots. See below. The card is visible in system devices under IOMMU group 13: [10de:21c4] 01:00.0 VGA compatible controller: NVIDIA Corporation TU116 [GeForce GTX 1660 SUPER] (rev a1). However I can find no trace of it anywhere else. Even running 'nvidia-smi' returns 'No devices were found'. I've double and triple checked that the card is seated correctly. I've deleted the Nvidia plugin/driver, stopped docker, then reinstalled several times. I've rolled back the driver as far back as the plugin will allow (v575.64.05), but still no success. I'm sick to death of logging into the web UI and discovering that the GPU Statistics plugin has not detected the card (god knows for how long), and I need this fixed PERMANENTLY. Any ideas??? nas-diagnostics-20251224-0010.zip
-
SOLVED! I fixed my own problem. It wasn't anything mentioned on any other help forum. Instead, it's a new quirk of Plex. In 'remote access' settings, I had my correct upload speed entered (just like I did on the old server). I didn't think anything of it, especially since the old server no longer exists. All I did on a hunch was delete the value and press 'save'. Despite Plex telling me 'no upload speed set', HDR now streams flawlessly! Thanks for the new 'feature', Plex!
-
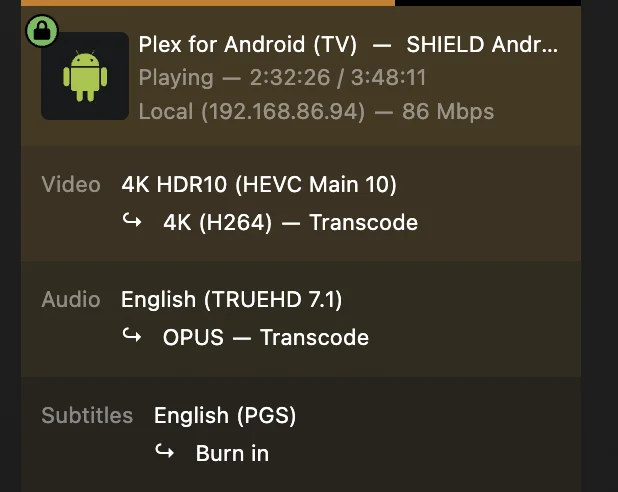
Guys, I just had to rebuild my Plex docker because my appdata become corrupt. Got Plex up and running, however remote users with Nvidia Shield Pros cannot direct play HDR titles. They used to flawlessly. Here's how their stream shows on my end. Even when disabling subtitles, there's no difference. There should be no transcoding, but I can't figure out why Plex is insisting on it. I've noticed that when unchecking 'enable HDR tonemapping' it allows him to play the title back in HDR - but previously I had this checked so that clients who couldn't play HDR could still benefit from HDR tonemapping. Those who could direct play HDR could still do so flawlessly. Any ideas?
-
Guys, can someone help me? I really don't want my Plex users to wait another 24 hours until this problem is fixed. First one to successfully help me restore Plex functionality within 2 hours gets a round of beers delivered by me to their Paypal account. I'm dead serious.
-
UPDATE: I went back into docker settings, deleted the docker img, then reenabled docker. As expected this time, no dockers appear. Went into app store, ticked all the previous dockers I want to install, and let it run. But again, same problem. I cannot get the WebUI to show for any of them. I've made zero network changes to my LAN/router, and for some reason, the weird LAN IP shows for most of the dockers container IP. However, if I try to access the docker UI from within Unraid by clicking on the icon and selecting 'WebUI', my browser all of a sudden wants to go to the correct IP address - still no UI shows though. What am I doing wrong?
-
Ok so I recreated my docker in docker settings. I pointed the appdata to mnt/cache/appdata, and the docker.img to /mnt/cache/system/docker/docker.img After it ran, I expected to see a blank 'docker' tab, but NO. ALL MY DOCKERS ARE THERE ALREADY! I'm pleasantly surprised, although I don't know how this could've happened. However, when I try to access the web UI for any of them, I notice that it doesn't resolve. I never had any custom networks set for any of them. What could be preventing this from working? EDIT: One thing that's weird is that some of these dockers have unusual IP address on them that I would have never assigned to them. My server has the local IP 192.168.x.x, and all of my dockers previously used that address prefix. However some of them have 172.17.x.x. All the ports seem correct though. Any ideas?
-
I have over 20+ dockers. Does having my previous docker.img file make this process any easier/faster?
-
Ok, I've copied across my appdata backup to cache/appdata. So all I have to do is reinstall the apps themselves from the app store? Does having access to my previous docker.img do me any favors here or make the process any faster?


