Alfy1080
Members
-
Joined
-
Last visited
Everything posted by Alfy1080
-
Hello. Starting a few days ago I started getting alerts saying that Rootfs is getting full. I've looked through the forum for recommendations that may apply to me but I'm not sure where to start. I've attached the diagnostics file to this post, could someone help me out with some advice on what could be causing this error and how to get rid of it? Thank you in advance! sv01u-diagnostics-20221123-2111.zip
-
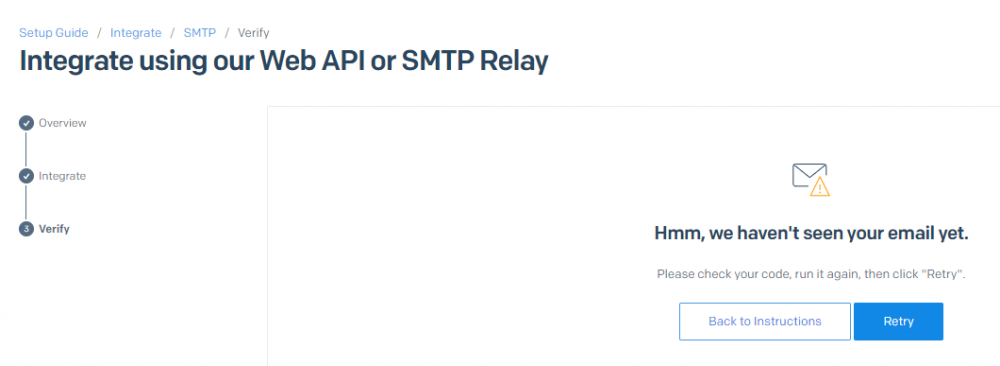
Hello. I'm trying to use sendgrid as a relay for outbound emails and I can't get this to work in any way. I'm doing this because even though my ISP did unblock port 25 for me upon my request, i immediately was blocked by google with the following message: smtp postfix/smtp[4920]: DFF6230000000742177: to=<[email protected]>, relay=gmail-smtp-in.l.google.com[142.250.27.27]:25, delay=1.1, delays=0.01/0/0.79/0.26, dsn=5.7.1, status=bounced (host gmail-smtp-in.l.google.com[142.250.27.27] said: 550-5.7.1 [188.24.XX.XX 12] Our system has detected that this message is 550-5.7.1 likely unsolicited mail. To reduce the amount of spam sent to Gmail, 550-5.7.1 this message has been blocked. Please visit 550-5.7.1 https://support.google.com/mail/?p=UnsolicitedMessageError 550 5.7.1 for more information. h13-20020a1709063c0d00b006ff19100b37si8253899ejg.616 - gsmtp (in reply to end of DATA command)) I've configured my DNS according to sendgrid's setup guide and created an API key for the sendgrid SMTP relay. Once that was done I changed my container's configuration as follows: In advanced view in extra parameters: --hostname smtp.sendgrid.net --restart always --cap-add=NET_ADMIN --cap-add=SYS_PTRACE Based on the documentation from here https://docker-mailserver.github.io/docker-mailserver/edge/config/advanced/mail-forwarding/relay-hosts/#sender-dependent-relay-host= I ran the following command: setup.sh relay add-auth mydomain.net apiuser apikey Which created a postfix-sasl-password.cf file with the correct info from the above command. Then i ran this next command: setup.sh relay add-domain mydomain.net smtp.sendgrid.net 465 Which created a postfix-relaymap.cf file with the correct info from the above command. I then restarted the container and sent a test email to a gmail address (sendgrid wants to verify that the configuration is correct by sending an email from the server with the new configuration). I once again got the same error that I was getting before saying that my email is most likely unsolicited and sendgrid says that they did not pick up my test email yet: Since the email never goes anywhere near sendgrid I am assuming i misconfigured something so can you please help me identify what i've done wrong in this whole process? Let me know if you need any further details about my configuration.
-
I tried it on br0 and it doesn't work. I tried everything until i gave up and left the network to host and then it worked fine.
-
Thanks for the quick reply. For some reason i didn't think to look under the interface menu for that setting so i was trying to edit that in the config. I changed the setting and it's working. Thanks for the help!
-
Hello. What value should i enter in "useOrdering":"createdAt" so i can reorder the apps manually? Right now when i try to reorder the apps i get this: Error Custom order is disabled I tried "custom" and "manual" but when i change the value to this the apps and bookmarks show a loading animation forever. Looking forward to your answer
-
Hello. Sorry if i am posting in the wrong place, but is LDAPforPlex still being supported? I tried to wrap my head around it into making it work but so far i got nothing. I installed the container and provided the token, ID, server name during the setup and in order to test it I wanted to connect to it using Apache Directory Studio. I selected anonymous authentication as per the guide and while ADS connects succesfully to the LDAP server, i can not see anything in there. No schema, no tree, nothing. I also tested by configuring it as an LDAP provider for Emby but if i try to log in with the user's email or userID i get the invalid credentials error. Am I missing something or doing something wrong? Thank you in advance!
-
Thanks for that. I applied the update. Will monitor the behavior of the container and let you know if the issue reoccurs. Regarding the https issue, personally since i use nginx proxy manager as the main reverse proxy, i can keep the connection between the containers, ContainerNursery and nginx as http and only encrypt traffic between the client and nginx. This only becomes an issue when the containers only support https. Luckily i have very few containers which don't support http but it would be really appreciated if you consider https support for a future release. Thanks for all your help!
-
Thanks so much for the quick bugfix. I've been running the new version for a few hours now and no crash. Previously it was sometimes crashing even once every 30 minutes so i guess it is fixed now. Will let you know if i encounter any similar issues. Ido have another question but i'm not sure what details to provide since the logs show no error regarding this: I've set up ContainerNursery as a proxy for binhex-code-server. In terms of turning off and back on the container everything works as expected through ContainerNursery. However when the container is off and i try to access it i see the "Waking up binhex-code-server" screen, the container turns on with no error but the page never refreshes. If i refresh it manually i still see the same message and there is no way of bypassing it and accessing the actual application (binhex-code-server). The only difference between this and the other containers that i am running is the fact that this one uses https between the proxy and the container while the others are on http. Is this a limitation of ContainerNursery? Thank you! EDIT: Sorry to be a bummer but the previously reported issue just reoccurred today. Here's the output of the log: undefined:1 {"read":"2021-12-01T07:22:27.505501532Z","preread":"2021-12-01T07:22:26.473666205Z","pids_stats":{"current":27},"blkio_stats":{"io_service_bytes_recursive":[{"major":8,"minor":112,"op":"Read","value":127119360},{"major":8,"minor":112,"op":"Write","value":24576},{"major":8,"minor":112,"op":"Sync","value":127143936},{"major":8,"minor":112,"op":"Async","value":0},{"major":8,"minor":112,"op":"Discard","value":0},{"major":8,"minor":112,"op":"Total","value":127143936},{"major":8,"minor":160,"op":"Read","value":127336448},{"major":8,"minor":160,"op":"Write","value":114688},{"major":8,"minor":160,"op":"Sync","value":127451136},{"major":8,"minor":160,"op":"Async","value":0},{"major":8,"minor":160,"op":"Discard","value":0},{"major":8,"minor":160,"op":"Total","value":127451136},{"major":7,"minor":2,"op":"Read","value":254455808},{"major":7,"minor":2,"op":"Write","value":139264},{"major":7,"minor":2,"op":"Sync","value":254595072},{"major":7,"minor":2,"op":"Async","value":0},{"major":7,"minor":2,"op":"Discard","value":0},{"major":7,"minor":2,"op":"Total","value":254595072}],"io_serviced_recursive":[{"major":8,"minor":112,"op":"Read","value":31035},{"major":8,"minor":112,"op":"Write","value":4},{"major":8,"minor":112,"op":"Sync","value":31039},{"major":8,"minor":112,"op":"Async","value":0},{"major":8,"minor":112,"op":"Discard","value":0},{"major":8,"minor":112,"op":"Total","value":31039},{"major":8,"minor":160,"op":"Read","value":31088},{"major":8,"minor":160,"op":"Write","value":4},{"major":8,"minor":160,"op":"Sync","value":31092},{"major":8,"minor":160,"op":"Async","value":0},{"major":8,"minor":160,"op":"Discard","value":0},{"major":8,"minor":160,"op":"Total","value":31092},{"major":7,"minor":2,"op":"Read","value":5139},{"major":7,"minor":2,"op":"Write","value":12},{"major":7,"minor":2,"op":"Sync","value":5151},{"major":7,"minor":2,"op":"Async","value":0},{"major":7,"minor":2,"op":"Discard","value":0},{"major":7,"minor":2,"op":"Total","value":5151}],"io_queue_recursive":[],"io_service_time_recursive":[],"io_wait_time_recursive":[],"io_merged_recursive":[],"io_time_recursive":[],"sectors_recursive":[]},"num_procs":0,"storage_stats":{},"cpu_stats":{"cpu_usage":{"total_usage":3158656747708,"percpu_usage":[320216365757,241831431537,260410379634,271224941458,273237346625,284666589481,229500011658,246267939121,254619708670,257061754896,258131560619,261488718252,0,0,0,0],"usage_in_kernelmode":227000000000,"usage_in_usermode":2831690000000},"system_cpu_usage":4545438260000000,"online_cpus":12,"throttling_data":{"periods":0,"throttled_periods":0,"throttled_time":0}},"precpu_stats":{"cpu_usage":{"total_usage":3158631397724,"percpu_usage":[320216365757,241831408353,260410219422,271224941458,273224184053,284666589481,229488007642,246267939121,254619708670,257061754896,258131560619,261488718252,0,0,0,0],"usage_in_kernelmode":227000000000,"usage_in_usermode":2831670000000},"system_cpu_usage":4545425980000000,"online_cpus":12,"throttling_data":{"periods":0,"throttled_periods":0,"throttled_time":0}},"memory_stats":{"usage":116506624,"max_usage":154386432,"stats":{"active_anon":0,"active_file":8622080,"cache":11489280,"dirty":0,"hierarchical_memory_limit":9223372036854771712,"hierarchical_memsw_limit":9223372036854771712,"inactive_anon":96825344,"inactive_file":2641920,"mapped_file":9056256,"pgfault":10224126,"pgmajfault":0,"pgpgin":10187991,"pgpgout":10170424,"rss":97030144,"rss_huge":0,"total_active_anon":0,"total_active_file":8622080,"total_cache":11489280,"total_dirty":0,"total_inactive_anon":96825344,"total_inactive_file":2641920,"total_mapped_file":9056256,"total_pgfault":10224126,"total_pgmajfault":0,"total_pgpgin":10187991,"total_pgpgout":10170424,"total_rss":97030144,"total_rss_huge":0,"total_unevictable":0,"total_writeback":0,"unevictable":0,"writeback":0},"limit":12552155136},"name":"/binhex-code-server","id":"305be059e0bdd278048a749dceaef576e90d4aa6903e90e36a8c065820a3f721","networks":{"eth0":{"rx_bytes":593909382,"rx_packets":5242541,"rx_errors":0,"rx_dropped":0,"tx_bytes":1023558065,"tx_packets":4654336,"tx_errors":0,"tx_dropped" SyntaxError: Unexpected end of JSON input at JSON.parse (<anonymous>) at IncomingMessage.<anonymous> (/usr/src/app/build/DockerManager.js:112:62) at IncomingMessage.emit (node:events:390:28) at addChunk (node:internal/streams/readable:324:12) at readableAddChunk (node:internal/streams/readable:297:9) at IncomingMessage.Readable.push (node:internal/streams/readable:234:10) at HTTPParser.parserOnBody (node:_http_common:141:24) at HTTPParser.execute (<anonymous>) at Socket.socketOnData (node:_http_client:487:22) at Socket.emit (node:events:390:28) Node.js v17.1.0
-
Wow, that was an amazingly fast reply 😋 Thanks for the info. Looking forward to the fix
-
Hello. I configured ContainerNursery and it works like a charm. However it sometimes crashes by itself and i have no idea why. This is what i see in the log every time when it crashes: undefined:1 {"read":"2021-11-28T15:03:04.317785879Z","preread":"2021-11-28T15:03:03.283758224Z","pids_stats":{"current":27},"blkio_stats":{"io_service_bytes_recursive":[{"major":8,"minor":112,"op":"Read","value":492716032},{"major":8,"minor":112,"op":"Write","value":32768},{"major":8,"minor":112,"op":"Sync","value":492748800},{"major":8,"minor":112,"op":"Async","value":0},{"major":8,"minor":112,"op":"Discard","value":0},{"major":8,"minor":112,"op":"Total","value":492748800},{"major":8,"minor":160,"op":"Read","value":495140864},{"major":8,"minor":160,"op":"Write","value":106496},{"major":8,"minor":160,"op":"Sync","value":495247360},{"major":8,"minor":160,"op":"Async","value":0},{"major":8,"minor":160,"op":"Discard","value":0},{"major":8,"minor":160,"op":"Total","value":495247360},{"major":7,"minor":2,"op":"Read","value":987856896},{"major":7,"minor":2,"op":"Write","value":139264},{"major":7,"minor":2,"op":"Sync","value":987996160},{"major":7,"minor":2,"op":"Async","value":0},{"major":7,"minor":2,"op":"Discard","value":0},{"major":7,"minor":2,"op":"Total","value":987996160}],"io_serviced_recursive":[{"major":8,"minor":112,"op":"Read","value":120292},{"major":8,"minor":112,"op":"Write","value":4},{"major":8,"minor":112,"op":"Sync","value":120296},{"major":8,"minor":112,"op":"Async","value":0},{"major":8,"minor":112,"op":"Discard","value":0},{"major":8,"minor":112,"op":"Total","value":120296},{"major":8,"minor":160,"op":"Read","value":120884},{"major":8,"minor":160,"op":"Write","value":7},{"major":8,"minor":160,"op":"Sync","value":120891},{"major":8,"minor":160,"op":"Async","value":0},{"major":8,"minor":160,"op":"Discard","value":0},{"major":8,"minor":160,"op":"Total","value":120891},{"major":7,"minor":2,"op":"Read","value":15399},{"major":7,"minor":2,"op":"Write","value":12},{"major":7,"minor":2,"op":"Sync","value":15411},{"major":7,"minor":2,"op":"Async","value":0},{"major":7,"minor":2,"op":"Discard","value":0},{"major":7,"minor":2,"op":"Total","value":15411}],"io_queue_recursive":[],"io_service_time_recursive":[],"io_wait_time_recursive":[],"io_merged_recursive":[],"io_time_recursive":[],"sectors_recursive":[]},"num_procs":0,"storage_stats":{},"cpu_stats":{"cpu_usage":{"total_usage":1580673183827,"percpu_usage":[136591228373,106160781099,127593972219,148154351579,144195817404,132300399864,122134487960,118729123484,135504818319,137865795981,134722498298,136719909247,0,0,0,0],"usage_in_kernelmode":310490000000,"usage_in_usermode":984030000000},"system_cpu_usage":1782568880000000,"online_cpus":12,"throttling_data":{"periods":0,"throttled_periods":0,"throttled_time":0}},"precpu_stats":{"cpu_usage":{"total_usage":1580668857736,"percpu_usage":[136588457807,106160781099,127593972219,148154254726,144195817404,132300258201,122134487960,118729123484,135504725654,137865795981,134722498298,136718684903,0,0,0,0],"usage_in_kernelmode":310490000000,"usage_in_usermode":984030000000},"system_cpu_usage":1782556530000000,"online_cpus":12,"throttling_data":{"periods":0,"throttled_periods":0,"throttled_time":0}},"memory_stats":{"usage":555679744,"max_usage":758505472,"stats":{"active_anon":0,"active_file":26578944,"cache":56770560,"dirty":0,"hierarchical_memory_limit":9223372036854771712,"hierarchical_memsw_limit":9223372036854771712,"inactive_anon":496332800,"inactive_file":22499328,"mapped_file":25681920,"pgfault":6842979,"pgmajfault":1155,"pgpgin":11106612,"pgpgout":11076689,"rss":487251968,"rss_huge":69206016,"total_active_anon":0,"total_active_file":26578944,"total_cache":56770560,"total_dirty":0,"total_inactive_anon":496332800,"total_inactive_file":22499328,"total_mapped_file":25681920,"total_pgfault":6842979,"total_pgmajfault":1155,"total_pgpgin":11106612,"total_pgpgout":11076689,"total_rss":487251968,"total_rss_huge":69206016,"total_unevictable":0,"total_writeback":0,"unevictable":0,"writeback":0},"limit":12552155136},"name":"/emby","id":"e6fd7da6a145a05ac3e6d5af16b85f9ebfa38c362072e9970646c16a5d53053e","networks":{"eth0":{"rx_bytes":667201285,"rx_packets":580695,"rx_errors":0,"rx_dropped":0,"tx_bytes":188815145,"tx_packets":290544,"tx_erro SyntaxError: Unexpected end of JSON input at JSON.parse (<anonymous>) at IncomingMessage.<anonymous> (/usr/src/app/build/DockerManager.js:112:62) at IncomingMessage.emit (node:events:390:28) at addChunk (node:internal/streams/readable:315:12) at readableAddChunk (node:internal/streams/readable:289:9) at IncomingMessage.Readable.push (node:internal/streams/readable:228:10) at HTTPParser.parserOnBody (node:_http_common:141:24) at Socket.socketOnData (node:_http_client:487:22) at Socket.emit (node:events:390:28) at addChunk (node:internal/streams/readable:315:12) Any idea what could cause this issue? Regards!
-
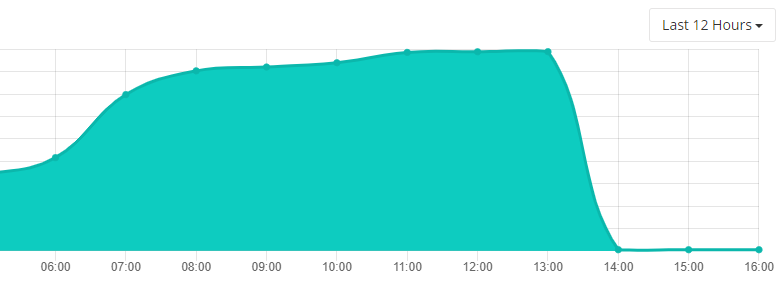
Hello. I have an issue with Cachet and Cachet url monitor in regards to metrics. I've created a metric that should display the latency of a website and the configuration of the monitor looks like this: - name: test url: https://example.net method: GET timeout: 120 # seconds expectation: - type: HTTP_STATUS status_range: 200-205 incident: MAJOR - type: LATENCY threshold: 1 incident: PERFORMANCE allowed_fails: 0 component_id: 16 metric_id: 2 action: - UPDATE_STATUS - CREATE_INCIDENT - PUSH_METRICS public_incidents: true latency_unit: ms frequency: 60 The metric is connected to the monitor and I can see the data is being pushed into it, however there's a weird behavior in the graph on the status page where if I set my timezone to my local time (Bucharest) or enable the automatic localization to the visitor's timezone, it seems that the data in the graph is being updated at a wrong hour (see screenshot1 which was made at ~16 o'clock). As a workaround for the 12 hour graph I can switch to a different timezone so that the current data would show on the far right side of the graph but if I switch to the past hour, the graph will only show me the default latency value which is set to 1 currently. Any idea of what is wrong/what am i doing wrong? Your help is greatly appreciated. Please let me know if you need any further information from my side. Thanks!