tjsyl
Members
-
Joined
-
Last visited
-
So, Connect uninstalled, docker disabled, reboot and the API is running. Enabled docker and all containers started and its still running.
-
I have it uninstalled and it is still in a loop. I am going to reboot with it uninstalled and see how is acts. My servers are in a rack and the flash drive is plugged into the USB port on the board. I may have time this week to plug in a virgin UnRaid USB drive and switch the boot device. I am thinking this may be a hardware compatibility issue. Nothing had changed with the config from 7.2.3 to 7.2.4. I have 2 other Unraid boxes running 7.2.4 before updating this one and they have been fine, older intel HW but this one is a X11DHP-T with 2 GOLD 6136s. The others are X9DRi-F and a X10DRi-T4+.
-
It will be a couple days until I can get to that point. I will update as soon as I can.
-
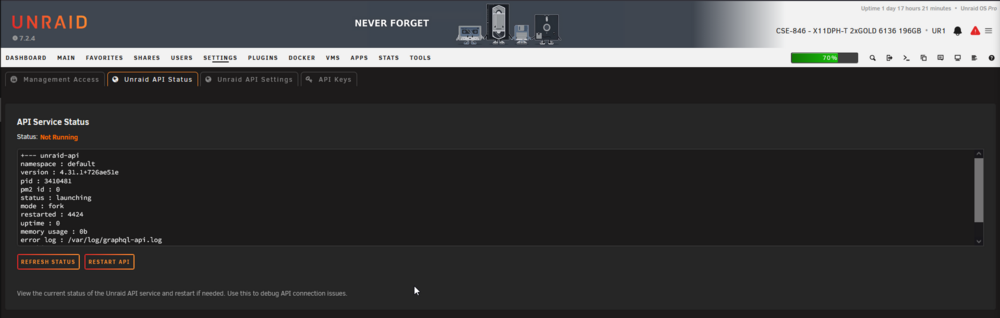
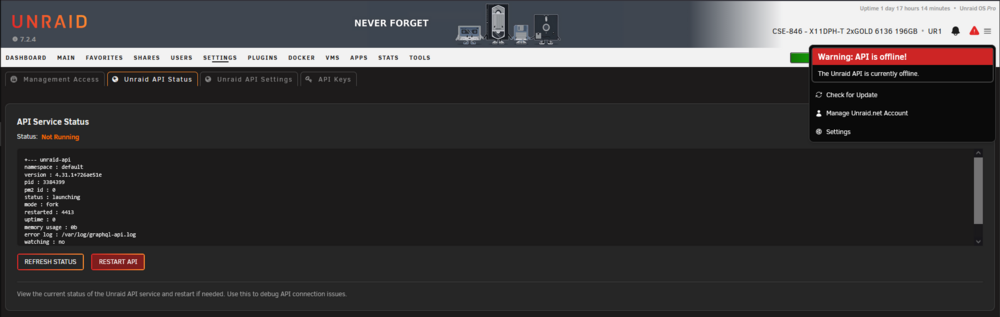
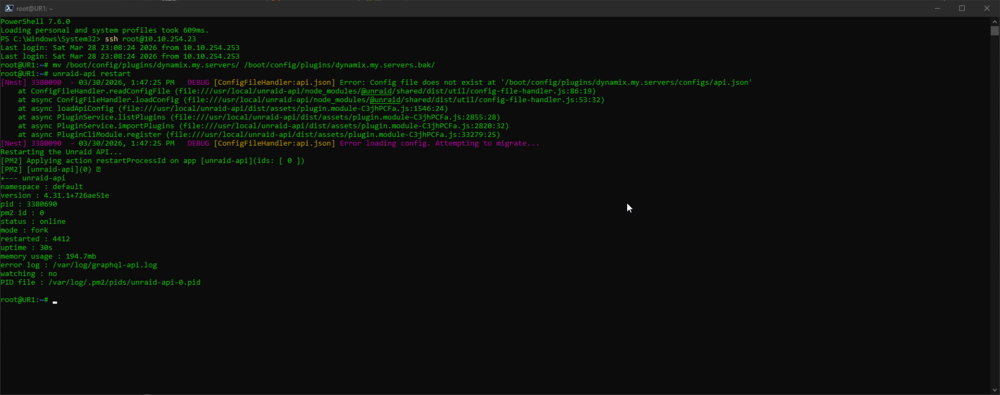
Thank you for helping on this. root@UR1:~# unraid-api status +--- unraid-api namespace : default version : 4.31.1+726ae51e pid : 2741199 pm2 id : 0 status : launching mode : fork restarted : 7498 uptime : 0 memory usage : 0b error log : /var/log/graphql-api.log watching : no PID file : /var/log/.pm2/pids/unraid-api-0.pid ur1-diagnostics-20260331-1655.zip
-
Ok, so Connect uninstalled, moved the dynamix.my.servers plugin to the .bak and restarted the API but its still failing.
-
Oh, uninstalled... Let me try that.
-
Geesh, still failing. Should I generate new logs?
-
I tried restarting after I removed Connect and it still failed. It fails with the array stopped also.
-
After the update I saw that one of my 3 servers (last one to update) is not connected on the myunraid dashboard. After looking into it I can see me see why the API isn't starting. I removed the Connect plugin and reinstalled it but the API is still failing to start. Logs show the NestJS server is failing to start. When I first opened the API Status page the version was unknown but after I reinstalled the Connect app it shows the version info again. On the localhost dashboard the page takes 20-30 seconds to populate all the items under System, VMs and containers, it never shows the processor usage or the network info. Assuming that is because the the API isn't available. I also had and issue after reboot with the Nvidia Driver disappearing and having to download it again, I had the same issue with one of my other servers also. ur1-diagnostics-20260328-2054.zip
-
After upgrading from 7.2.3 to 7.2.4 the API wont start. Logs show Failed to start NestJS server [20:58:38 INFO GraphQLModule]: Mapped {/graphql, POST} route {"apiVersion":"4.31.1+726ae51e","logger":"api","context":"GraphQLModule"} [20:58:41 ERROR app]: Failed to start NestJS server {"apiVersion":"4.31.1+726ae51e"} err: { "type": "Error", "message": "bootstrapNestServer timed out after 29703ms", "stack": Error: bootstrapNestServer timed out after 29703ms at Timeout._onTimeout (file:///usr/local/unraid-api/dist/assets/index-BMII9FSH.js:37:56) at listOnTimeout (node:internal/timers:588:17) at process.processTimers (node:internal/timers:523:7) } [20:58:41 ERROR app]: API-ERROR {"apiVersion":"4.31.1+726ae51e"} err: { "type": "Error", "message": "bootstrapNestServer timed out after 29703ms", "stack": Error: bootstrapNestServer timed out after 29703ms at Timeout._onTimeout (file:///usr/local/unraid-api/dist/assets/index-BMII9FSH.js:37:56) at listOnTimeout (node:internal/timers:588:17) at process.processTimers (node:internal/timers:523:7) } ur1-diagnostics-20260328-2054.zip
-
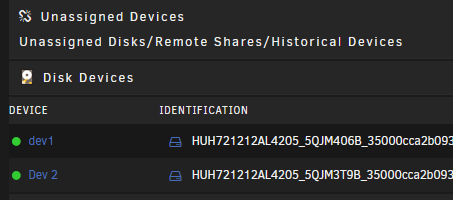
dev1 and Dev 2?? Is this in Unraid or in unassigned devices?
-
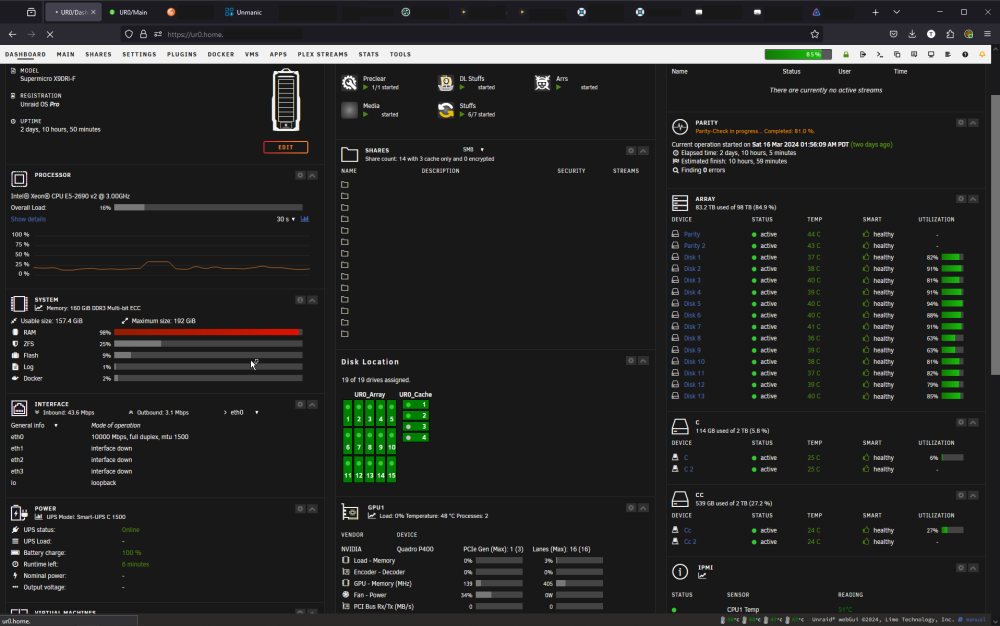
So far I've went down a rabbit hole and found the PLEX DB had some errors. Full rebuild of the Plex DB via (https://www.reddit.com/r/PleX/comments/z7i4va/repair_a_corrupted_database_on_unraid_updated/) this helpful guide, I couldn't get ChuckPaPlex's script to play nice with UR, I think I may have been executing it from the wrong directory. After manual full repair I am 80% through the parity check and no issues. Just kidding. I was checking on it as I was typing this and I see something is running a muck on the RAM (98% of 160GB). I had UNMANIC set to use the ramdisk long ago, (/tmp/xxxxxx) but I am 99% sure when I added the 4- 1TB ssd's (4-6 months ago?) changed it to one of the 2, 2TB cache pools I have set up. I noticed Unmanic running out of space on very large Linux ISO's. I had the syslog writing to my other UR server and it looked useless, after working on some stuff for work I came back to it and noticed the server was responsive and it had the syslog had jumped from 14kb to 80+kb. Apparently Unmanic was running a muck. It would seem I don't have enough patients to wait it out the last few times this happened and took action before UR fixed itself. For now I shut down Unmanic and disabled autostart, will try to see what's going on with that container. Maybe move it to another server. Anything else helpful in this log? I know exactly what the "smb_panic" was about. I also omitted a few things *****. Not sure why the tab open in chrome on my phone feels the need to log back in every 15 minutes but, meh.. I think all is well now but let me know if anything looks strange please. I will disable writing the syslog to the flash drive for now but keep it mirrored to my other UR server. syslog-10.xxx.xxx.xxx.log
-
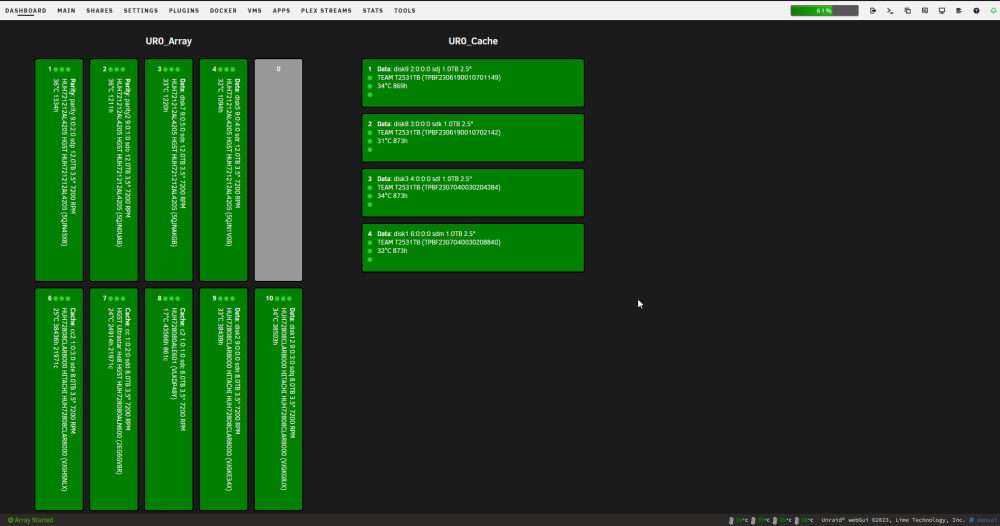
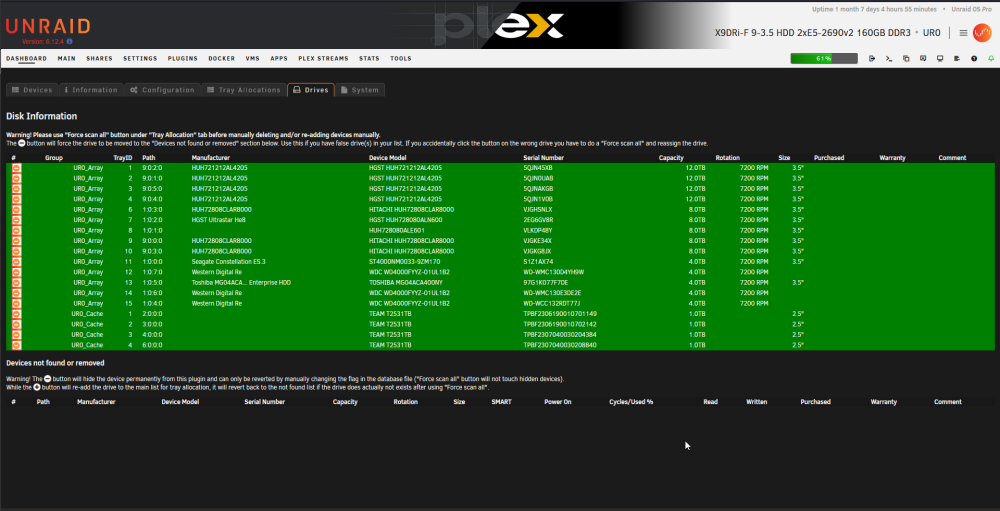
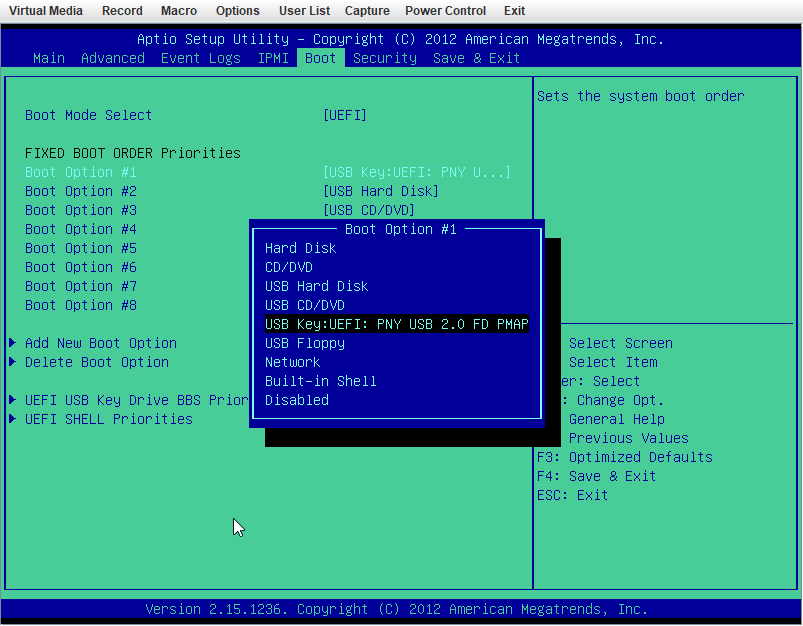
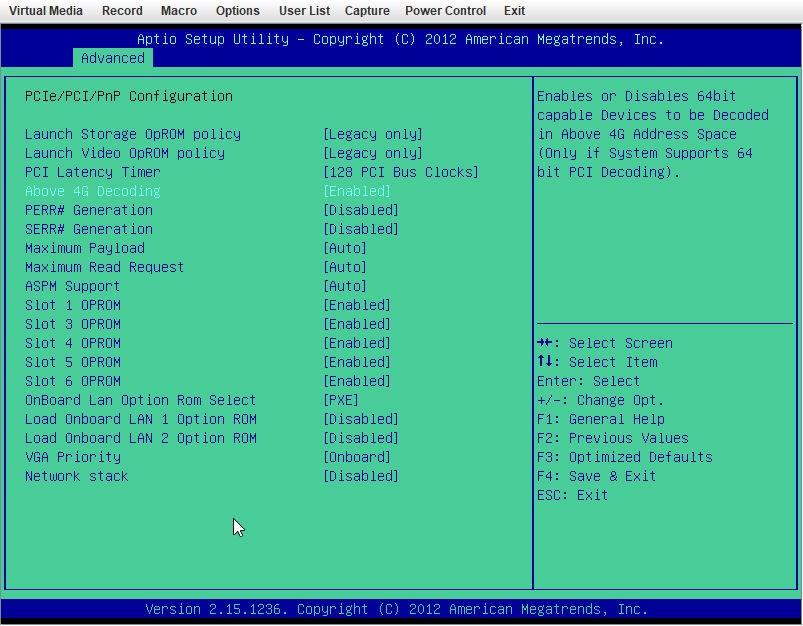
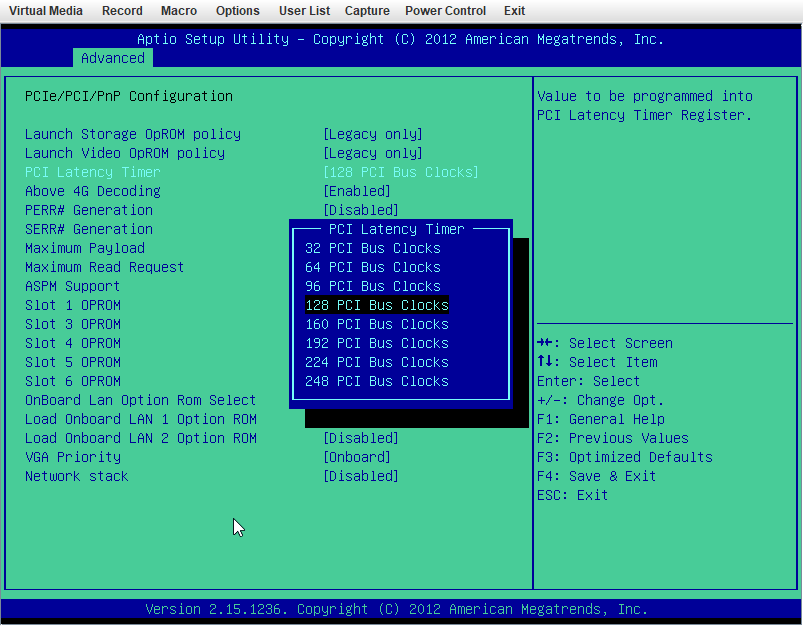
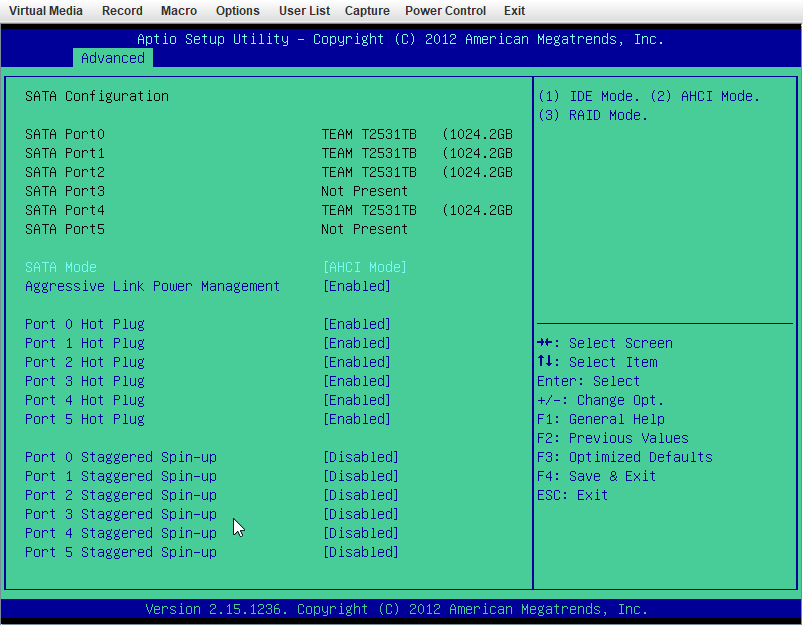
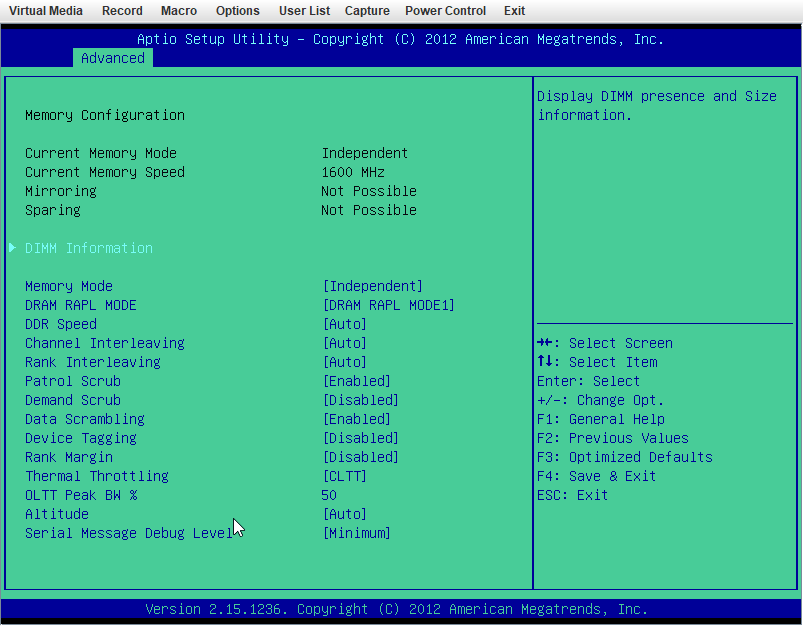
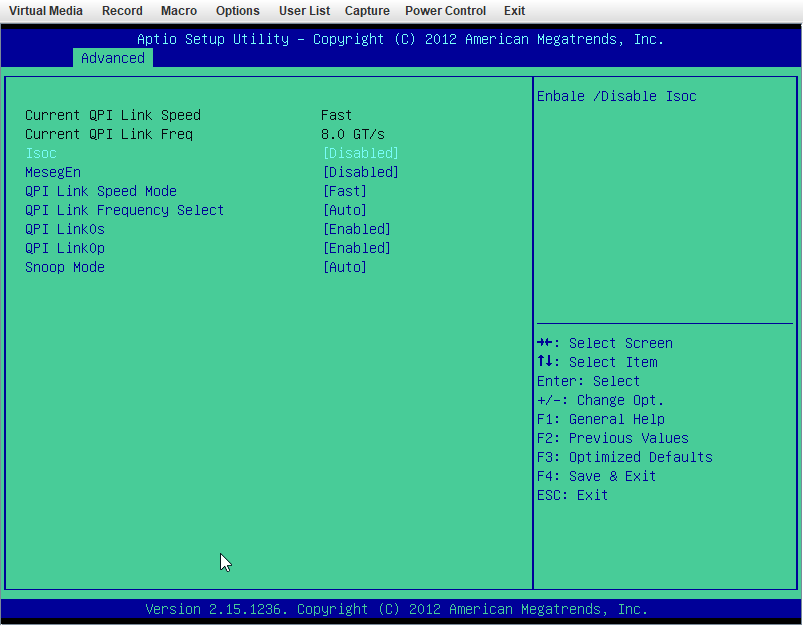
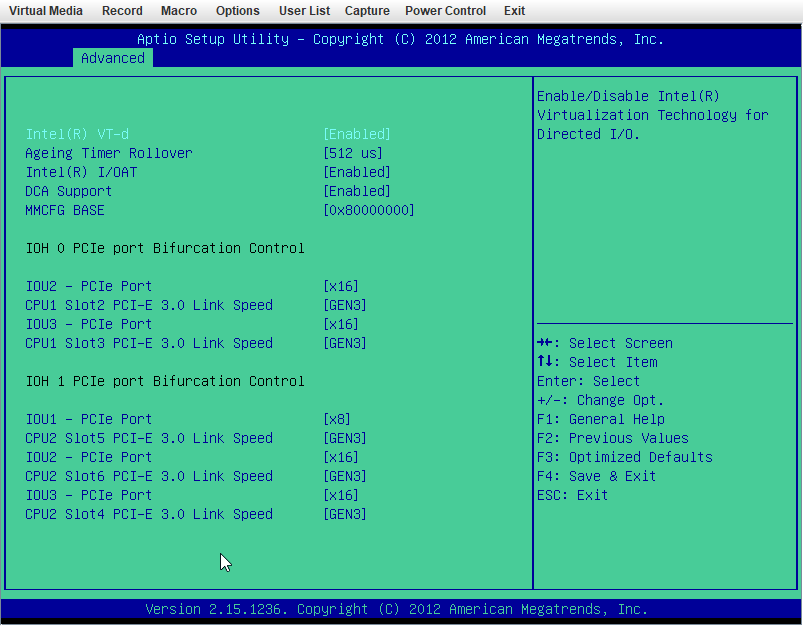
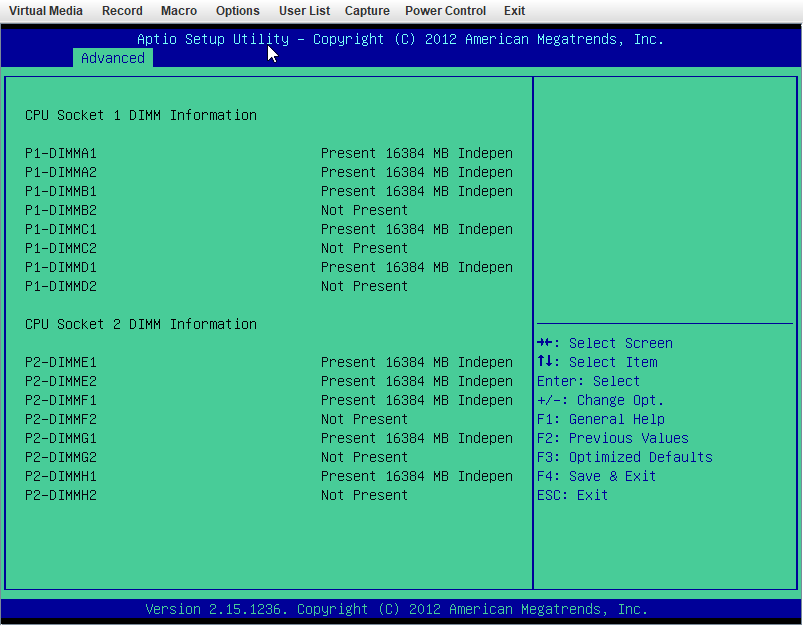
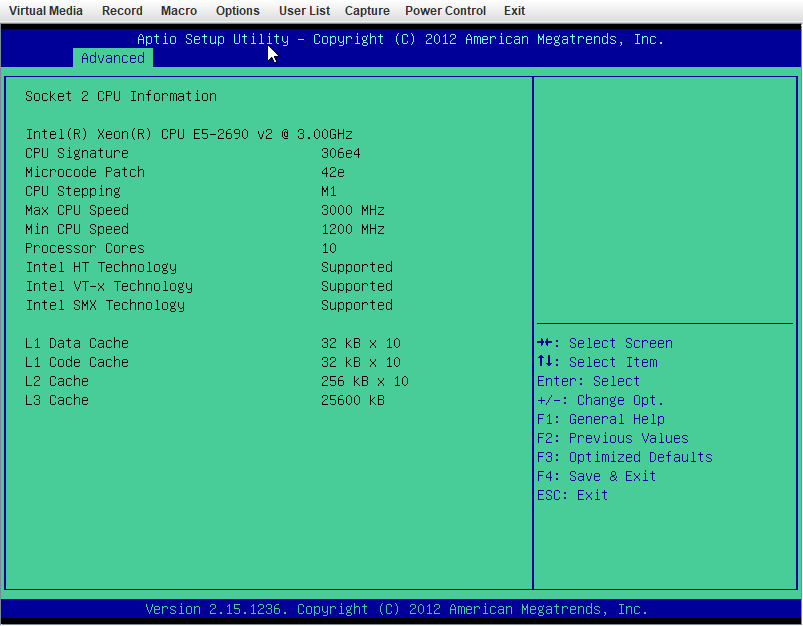
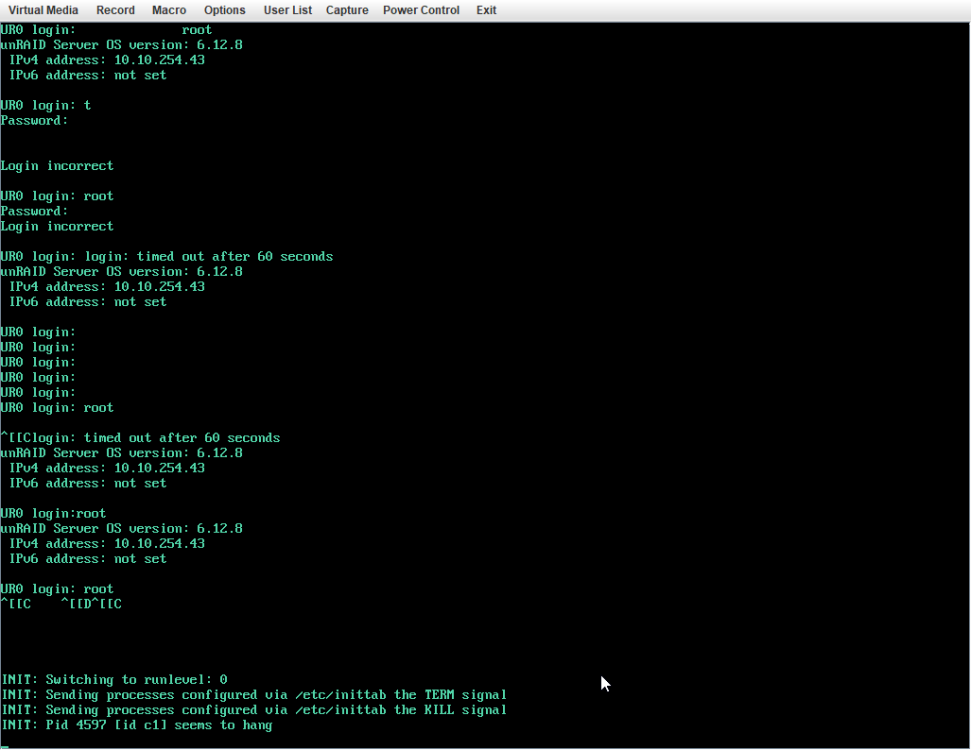
X9DRi-F 2xE5-2690v2 160GB DDR3 15 drives with 0 errors. I was running 6.12.6 and lost my "MAIN" display, other tabs would load but "MAIN" wouldn't show the drives. After 20+ days since the last reboot and seeing a couple posts about 6.12.8 fixing that issue I figured why not, I had already updated my X11DPH-T server and it has been smooth for a few weeks. This issue seems to have started a few days after updating. The Web UI and SMB shares become unresponsive but I can still pull up my console via IPMI or directly, I can type the user name but timeout before it ever shows the password prompt. After trying that for a few times it becomes unresponsive and it may or may not drop a line when hitting return. I was in the middle of a plex stream when it happened this time and the array was in process of a parity check after the last occurance (12TB x2 parity). I can also see via the LED's on my LSI SAS controllers that the drives look to still be busy with what I assume to be the parity check. I have yet to try pinging but If it happens again I will see if I get a reply. The system seems to take input when instructed to shutdown gracefully (FROM IPMI) but it complains about the hung process id 4597 (See Screenshot). Is there anything in the diagnostics that can tell me what process that was/is? I haven't made any changes to my bios settings but I am attaching some screenshots in an effort to verify if something is not playing nice with 6.12.8. ur0-diagnostics-20240316-0118.zip ur0-syslog-20240316-0816.zip
-
I was able to remove the container from the folder, move it below that folder (so it changes the unraid start order) then add it back to the folder.
-
Mixes up the cache disks with the data disks.