

gyto6
-
Posts
148 -
Joined
-
Last visited
Content Type
Profiles
Forums
Downloads
Store
Gallery
Bug Reports
Documentation
Landing
Posts posted by gyto6
-
-
32Go ECC because it’s the maximal for the dl320e gen8 v2
-
Hi everyone,
I'd like to get your point of view about the ASHIFT parameter on SSD.
I'm aware that what is usually told is that SSD "lies" by announcing a 512 Sector Size instead of 4K or 8K. So Ashift 12 or 13 is prefered. In order to not suffer from write amplification.
But on my DC500R SSDs, the datasheet or internal commands doesn't refers to 4K Sector Size so I ran these benchmarks when I created my array with the differents ASHIFT values.
The ASHIFT 9 is whatever the winner in writing speed. The ASHIFT 12 shows some interesting results.
I'd simply like to know I did good with a benchmark to determine the ASHIFT or if another method is prefered?
Thank you.
ASHIFT 9
root@server:/mnt/fastraid# dd if=/dev/zero of=ashift9.bin bs=1M count=100000
100000+0 records in
100000+0 records out
104857600000 bytes (105 GB, 98 GiB) copied, 91.531 s, 1.1 GB/s
root@server:/mnt/fastraid# dd if=ashift9.bin of=/dev/null bs=1M
100000+0 records in
100000+0 records out
104857600000 bytes (105 GB, 98 GiB) copied, 64.7996 s, 1.6 GB/s
root@server:/mnt/fastraid# df -h
Filesystem      Size  Used Avail Use% Mounted on
fastraid        5.1T   98G  5.1T   2% /mnt/fastraid
root@server:/mnt/fastraid# zfs list
NAME       USED  AVAIL     REFER  MOUNTPOINT
fastraid  97.6G  5.00T     97.6G  /mnt/fastraid

ASHIFT 12
root@server:/mnt/fastraid# dd if=/dev/zero of=ashift12.bin bs=1M count=100000
100000+0 records in
100000+0 records out
104857600000 bytes (105 GB, 98 GiB) copied, 88.9758 s, 1.2 GB/s
root@server:/mnt/fastraid# dd if=ashift12.bin of=/dev/null bs=1M
100000+0 records in
100000+0 records out
104857600000 bytes (105 GB, 98 GiB) copied, 89.2021 s, 1.2 GB/s
root@server:/mnt/fastraid# df -h
Filesystem      Size  Used Avail Use% Mounted on
fastraid        5.0T   98G  4.9T   2% /mnt/fastraid
root@server:/mnt/fastraid# zfs list
NAME       USED  AVAIL     REFER  MOUNTPOINT
fastraid  97.6G  4.85T     97.6G  /mnt/fastraid

ASHIFT 13
root@server:/mnt/fastraid# dd if=/dev/zero of=ashift13.bin bs=1M count=100000
100000+0 records in
100000+0 records out
104857600000 bytes (105 GB, 98 GiB) copied, 92.9889 s, 1.1 GB/s
root@server:/mnt/fastraid# dd if=ashift13.bin of=/dev/null bs=1M
100000+0 records in
100000+0 records out
104857600000 bytes (105 GB, 98 GiB) copied, 74.625 s, 1.4 GB/s
root@server:/mnt/fastraid# df -h
Filesystem      Size  Used Avail Use% Mounted on
fastraid        5.0T   98G  4.9T   2% /mnt/fastraid
root@server:/mnt/fastraid# zfs list
NAME       USED  AVAIL     REFER  MOUNTPOINT
fastraid  97.6G  4.85T     97.6G  /mnt/fastraid
Here's the result with the Crucial P5, also displayed with 512 Sector Size and performance dropping is huge.
ASHIFT 9 root@server:/mnt/nvmeraid# dd if=/dev/zero of=ashift9.bin bs=1M count=100000 100000+0 records in 100000+0 records out 104857600000 bytes (105 GB, 98 GiB) copied, 21.2881 s, 4.9 GB/s root@server:/mnt/nvmeraid# dd if=ashift9.bin of=/dev/null bs=1M 100000+0 records in 100000+0 records out 104857600000 bytes (105 GB, 98 GiB) copied, 9.82965 s, 10.7 GB/s root@server:/mnt/nvmeraid# df -h Filesystem Size Used Avail Use% Mounted on nvmeraid 1.7T 128K 1.7T 1% /mnt/nvmeraid root@server:/mnt/nvmeraid# zfs list NAME USED AVAIL REFER MOUNTPOINT nvmeraid 1.03M 1.67T 24K /mnt/nvmeraid ASHIFT 12 root@server:/mnt/nvmeraid# dd if=/dev/zero of=ashift12.bin bs=1M count=100000 100000+0 records in 100000+0 records out 104857600000 bytes (105 GB, 98 GiB) copied, 83.2163 s, 1.3 GB/ root@server:/mnt/nvmeraid# dd if=ashift12.bin of=/dev/null bs=1M 100000+0 records in 100000+0 records out 104857600000 bytes (105 GB, 98 GiB) copied, 51.633 s, 2.0 GB/s root@server:/mnt/nvmeraid# df -h Filesystem Size Used Avail Use% Mounted on nvmeraid 1.7T 98G 1.6T 6% /mnt/nvmeraid root@server:/mnt/nvmeraid# zfs list NAME USED AVAIL REFER MOUNTPOINT nvmeraid 97.7G 1.57T 97.7G /mnt/nvmeraid -
I think that I've found a way around.
After many researches, I'm not the first having trouble with the P5 from Crucial. To me, the problem is that it tends to disappear for no reason. So I've found the same troubleshoot on this forum and tested @JorgeB's solution. Link
He/She's been suggesting to disable IOMMU (AMD), or Intel VT-d (INTEL) for my old motherboard.
As I'm not doing virtualization for now, I find it efficient to just disable IOMMU. My Crucial are back again.
I'll be back if I'm having this same trouble again.
Thanks a lot for your help.
-
Meanwhile, my nvme drives has once again disappeared from the GUI.
-
My mistake, Docker is a directory which was set on a zraid1 pool on the nvme Drive.
I'm aware about the SD Drive as it was only used to create an array to start Unraid and use it.
I might use another usb drive then.
-
5 minutes ago, steini84 said:
Are you keeping your docker.img on the zfs array? It can cause the lockup you are describing.
Yes I do. I'll try to move it to the SD card if there's not to much writing on it. Or maybe that you've a better option?
-
3 hours ago, SimonF said:
All I can see in the logs are the following looks like issues with nvme drives.
Feb 20 11:28:25 rohrer-enard kernel: nvme nvme1: Device not ready; aborting reset, CSTS=0x1
Feb 20 11:28:25 rohrer-enard kernel: nvme nvme1: Removing after probe failure status: -19
Feb 20 11:28:25 rohrer-enard kernel: nvme nvme0: Device not ready; aborting reset, CSTS=0x1
Feb 20 11:28:25 rohrer-enard kernel: nvme nvme0: Removing after probe failure status: -19
That's what I've seen too.
I disconnect the server from power. Plugged it back and...
I'll check if I can update my HBA card's firmware.
Sorry, everything is fine.. And thanks for your work on ZFS Plugin. ☺️
-
Hi Everyone,
I just wanted to share you a problematic trouble I've met.
For some unknown reasons, I was no more able to load some part of the Unraid GUI and some dockers's been stopped. I've tried to generate a diagnostic file in the settings, and it's has display in windows a writing to one of my NVMe drive, has it it was executing an operation on it.
The problem is that the system was no more responsive and after an hour, I decided to reset the system. After what, I've lost my zpools because the NVMe Drives was no more recognized as ZFS disks.
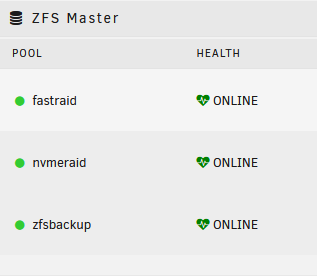
He's the configuration of the ZFS Pool before the lost of the NVMe's drives partition.
Quotezpool status fastraid
pool: fastraid
state: ONLINE
config:NAME STATE READ WRITE CKSUM
fastraid ONLINE 0 0 0
raidz1-0 ONLINE 0 0 0
wwn-SSD1 ONLINE 0 0 0
wwn-SSD2 ONLINE 0 0 0
wwn-SSD3 ONLINE 0 0 0
wwn-SSD4 ONLINE 0 0 0
special
mirror-2 ONLINE 0 0 0
nvme-CT2000P5SSD8_XX-part1 ONLINE 0 0 0
nvme-CT2000P5SSD8_YY-part1 ONLINE 0 0 0
logs
mirror-3 ONLINE 0 0 0
nvme-CT2000P5SSD8_XX-part2 ONLINE 0 0 0
nvme-CT2000P5SSD8_YY-part2 ONLINE 0 0 0This not the first time that I've begin to lost control of my unraid server, but until now I didn't lost anything. All I can say, it's begun to appear with the version 2.0 of the plugin, but maybe that it's linked to something else?
-
So,
The original unbound config is set for DNSSEC. Nothing more to configure else to check the "Use DNSSEC" boxe within Pi-Hole GUI. But even if the box is not checked, it tends to unbound to already use DNSSEC. Furthermore, don't be suprised to see a lot of well known websites not using DNSSEC.
Once done, go on your web browser to https://nifc.fr (a domain name I've set with DNSSEC) and check "Queries Logs"
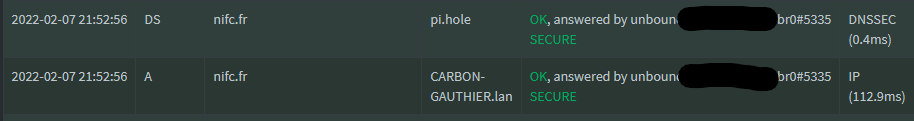
Else, you can check this site https://dnssec.vs.uni-due.de/
Source :
https://discourse.pi-hole.net/t/how-do-i-interperet-the-dnssec-column-in-the-query-log/7185
https://medium.com/nlnetlabs/dns-over-https-in-unbound-c7a407e8480
-
On 2/5/2022 at 2:41 PM, Lanraider said:
Thanks for your answer!
I had time again to play around a bit with unbound & pi-hole, so the pihole container was not set to "Priviledge" i think the "Maximum number of concurrent DNS queries reached (max: 150) error" was because i restarted the pihole container and it always forgets the DNS Settings i put in and changes to "listen to all devices", even though i put in "Allow only local devices" and another DNS Server it should use, when it starts again.
So i tested unbound and i figured out that it is not using my pihole.conf file in the unbound.conf.d dir! Dont know why it is doing this... So i tested unbound with the unbound.conf that is in the unbound main dir and it is working fine and answering in the pihole query log with "sent to unbound.br0#5335" like i put it in the unbound.conf file. How can i say to unbound to use my pihole.conf file or how do i fix this?
Another thing i noticed is that it is not using DNS over TLS with the unbound.conf, like with the pihole.conf file when it was recognised.
Also i get the following errors in the unbound log:
[1644065587] libunbound[21:0] error: udp connect failed: Cannot assign requested address for 2001:500:200::b port 53
[1644065587] libunbound[21:0] error: udp connect failed: Cannot assign requested address for 2001:500:200::b port 53
[1644065587] libunbound[21:0] error: udp connect failed: Cannot assign requested address for 2001:500:2d::d port 53
[1644065587] unbound[1:0] warning: setrlimit: Operation not permitted
[1644065587] unbound[1:0] warning: cannot increase max open fds from 40960 to 189120
[1644065587] unbound[1:0] warning: continuing with less udp ports: 1750
[1644065587] unbound[1:0] warning: increase ulimit or decrease threads, ports in config to remove this warning
[1644065587] unbound[1:0] error: Could not open logfile /dev/null: Permission deniedYou're welcome.
First, how do you know that unbound isn't using the pihole.conf?
Then, I didn't set DoH yet, i'll warn you once done how to do this.
And at last, the errors refers to what I said sooner. Except for the ipv6 address as it's disabled in default unbound.conf file.
Edit 1 : Concerning the pi-hole.conf file not used, open the unbound console :
find / -name pi-hole.conf -printYou're supposed to get your file path inside the docker :
/opt/unbound/etc/unbound/unbound.conf.d/pi-hole.confNow, execute the following command and restart Pi-Hole
unbound -c /opt/unbound/etc/unbound/unbound.conf.d/pi-hole.confEdit 2 : I didn't find the docker parameter to use another unbound.conf file aka pi-hole.conf at launch.
So you can, as you did, set your pi-hole.conf config into the unbound.conf. But the file given by pi-hole is less configured that the original pi-hole file and I don't see what's better, so be cautious. Especially with certificate and key files path which must be kept in the config for DNSSEC.
The only difference from original config file in pi-hole.conf is this line which's been set to "no" :
use-caps-for-id: no -
So, after more investigation I realized many things.
My target there was to free a PCIE slot and still getting my 2 NVMe SSDs working this fast as for my SATA SSDs.
But, the H240 has no support for NVMe. Only SATA/SAS, so my NVMe wouldn't run or in SATA mode at least.
Looking for the 4xM.2 version of my PEX8M2E2, which has native support for NVMe, I imagined using a M.2 to Mini-SAS adapter to connect my bay to this card.
But these cards only accept NVMe protocol, and my 4 SATA SSD wouldn't run then.The only thing that could run are "Tri-Mode" card (SATA/SAS/NVMe) and the price is not the same. Look for HBA 9400-16i Tri-Mode Storage Adapter.
I can't expect to find it on Ebay for cheap.
So i'll considerate to connect back my SATA SSDs to the motherboard and get cut to 3Gb/S instead of 6.
PS: I didn't mention SAS connectors as there would be a lot to talk about too, but it's a mess.
-
Hi everyone,
I'd like to add to my DL320e Gen8 v2 a graphic card.
I've 2 NVMe M.2 drives on a PCIe adapter and 4 2'5 SSD in the bay linked to the other PCIe slot through my HPE P222 Card. So I'm out of PCIe port.
To do so, I'll first replace my HPE P222 Raid card (HBA) with a HPE H240 to connect my first 4 drives in the cage through Mini-SAS.
Now, I need to connect my two M.2 NVMe drives, but after searching for a while, I can't find the specific card that could solve my problem.
Does anyone has a link to the product I'm looking for, else another to solve my problem?
Thank you!
PS: I can't use the motherboard's Mini-SAS connector as it'ld cut bay's speed to 3Gb/s instead of 6Gb/s due to having 4 drives instead of 2.
-
3 hours ago, Wozzagonebush said:
I've got it working by setting pi-hole ip to 192.168.1.2 br0, pointing to unbound br0 192.168.1.3#53
Doesn't sound good to me as Pi-Hole uses this port to reslove clients DNS queries. Can you check in PiHole's Query Log section if the solver's unbound's docker name (With #53 for you of course)?

-
I'll add that you might be concerned about logs errors "due" to poor ressources for Unbound..
Unless you've more than 500 workers in your network depending on your stuff, do not urge to set the container as "Priviledge" if only for home usage.
What i noticed is that in the docker tab the container is still using port 53, instead of showing that it is using port 5335 (like put in the docker config) is this right?
To me, it sounds like a false positive and refers to the out port for DNS request. In my own case, it solves DNS queries and is indeed listening my pihole request on port 5335.
-
43 minutes ago, ich777 said:
Exactly, I would recommend to start over and delete the container and also the directory for this container.
Man/Woman, your solution's worked.. I should have done this before 😅
Thank you!
-
 1
1
-
-
31 minutes ago, ich777 said:
Also this seems more like an issue with the Prometheus container so I would recommend that you ask in the support forums from the container iteslf.
Are you on 6.9.2 then it could be possible that if you have certain application files from Docker on ZFS that it simply doesn't work.
My mistake! I forgot that you didn't design the docker by itself..
I'm doing my way on the docker support forum.
Thanks for your help, I'll try your way around, even if for a first install, it sounds quite weird.
-
Hi everyone,
I've been reading your tutorial but booting up Prometheus's docker is already a mess.
I'm getting the following message in the logs before it goes back to "stopped" status :
ts=2022-01-13T17:23:18.190Z caller=main.go:520 level=info build_context="(go=go1.17.5, user=root@54b6dbd48b97, date=20211217-22:08:06)"
ts=2022-01-13T17:23:18.191Z caller=main.go:521 level=info host_details="(Linux 5.14.15-Unraid #1 SMP Thu Oct 28 09:56:33 PDT 2021 x86_64 947eed537a1c (none))"
ts=2022-01-13T17:23:18.191Z caller=main.go:522 level=info fd_limits="(soft=40960, hard=40960)"
ts=2022-01-13T17:23:18.191Z caller=main.go:523 level=info vm_limits="(soft=unlimited, hard=unlimited)"
ts=2022-01-13T17:23:18.205Z caller=query_logger.go:86 level=error component=activeQueryTracker msg="Error opening query log file" file=/prometheus/queries.active err="open /prometheus/queries.active: permission denied"

panic: Unable to create mmap-ed active query log
Sounds like an permission problem.
http://hostip/metrics is accessible whatever but not relevant
Just in case, the docker folder has been set on a zfs dataset, but i doubt that it could lead to the source of the trouble.
I'm not fully instructed to docker so if you may have an idea on how to resolve this little problem?
Thanks.


ZFS plugin for unRAID
in Plugin Support
Posted
Did some benchmark with FIO. I can recommand the ssd-test.fio which can be personnalized with block size and queue depth.
It appears that my SSDs are indeed 512 Sector Size if we wanna reach the best IOPS numbers. But talking about Bandwith performance, the 4K block size seems most relevant and the cpu usage is divided by 3. Finally the 8k Block Size is twice better in random read and write speed that the ASHIFT 12 and better too in sequential write speed.
So, as it finally depends of my usage too, the 512 sector and block size is not relevant. Going onto the Ashift 12 refers to the most of my usage and might test the ashift 13 later.
For some people interested about the block size ina concrete example, you can read this article, else read the benchmarks.
Block Size 512 / Ashift 9
seq-read: (g=0): rw=read, bs=(R) 512B-512B, (W) 512B-512B, (T) 512B-512B, ioengine=libaio, iodepth=4
rand-read: (g=1): rw=randread, bs=(R) 512B-512B, (W) 512B-512B, (T) 512B-512B, ioengine=libaio, iodepth=4
seq-write: (g=2): rw=write, bs=(R) 512B-512B, (W) 512B-512B, (T) 512B-512B, ioengine=libaio, iodepth=4
rand-write: (g=3): rw=randwrite, bs=(R) 512B-512B, (W) 512B-512B, (T) 512B-512B, ioengine=libaio, iodepth=4
fio-3.23
Starting 4 processes
seq-read: Laying out IO file (1 file / 10240MiB)
Jobs: 1 (f=1): [_(3),w(1)][57.7%][w=1378KiB/s][w=2757 IOPS][eta 02m:50s]
seq-read: (groupid=0, jobs=1): err= 0: pid=2415: Mon Mar 7 23:42:01 2022
read: IOPS=414k, BW=202MiB/s (212MB/s)(10.0GiB/50642msec)
slat (nsec): min=1498, max=10958k, avg=1746.42, stdev=4186.01
clat (nsec): min=1202, max=10978k, avg=7695.11, stdev=7443.96
lat (usec): min=2, max=10979, avg= 9.49, stdev= 8.58
clat percentiles (nsec):
| 1.00th=[ 6880], 5.00th=[ 6880], 10.00th=[ 6880], 20.00th=[ 6944],
| 30.00th=[ 6944], 40.00th=[ 6944], 50.00th=[ 6944], 60.00th=[ 7008],
| 70.00th=[ 7008], 80.00th=[ 7072], 90.00th=[ 7264], 95.00th=[10816],
| 99.00th=[31616], 99.50th=[33536], 99.90th=[40704], 99.95th=[47872],
| 99.99th=[75264]
bw ( KiB/s): min=184828, max=216766, per=100.00%, avg=207502.64, stdev=7385.37, samples=73
iops : min=369656, max=433534, avg=415005.78, stdev=14770.70, samples=73
lat (usec) : 2=0.01%, 4=0.01%, 10=94.20%, 20=4.14%, 50=1.62%
lat (usec) : 100=0.04%, 250=0.01%, 500=0.01%, 750=0.01%
lat (msec) : 10=0.01%, 20=0.01%
cpu : usr=34.03%, sys=65.74%, ctx=20825, majf=0, minf=12
IO depths : 1=0.1%, 2=0.1%, 4=100.0%, 8=0.0%, 16=0.0%, 32=0.0%, >=64=0.0%
submit : 0=0.0%, 4=100.0%, 8=0.0%, 16=0.0%, 32=0.0%, 64=0.0%, >=64=0.0%
complete : 0=0.0%, 4=100.0%, 8=0.0%, 16=0.0%, 32=0.0%, 64=0.0%, >=64=0.0%
issued rwts: total=20971520,0,0,0 short=0,0,0,0 dropped=0,0,0,0
latency : target=0, window=0, percentile=100.00%, depth=4
rand-read: (groupid=1, jobs=1): err= 0: pid=19319: Mon Mar 7 23:42:01 2022
read: IOPS=6417, BW=3209KiB/s (3286kB/s)(188MiB/60001msec)
slat (nsec): min=1758, max=24816k, avg=153474.79, stdev=272284.97
clat (usec): min=12, max=28548, avg=468.70, stdev=488.48
lat (usec): min=24, max=28591, avg=622.36, stdev=570.66
clat percentiles (usec):
| 1.00th=[ 49], 5.00th=[ 64], 10.00th=[ 66], 20.00th=[ 69],
| 30.00th=[ 73], 40.00th=[ 94], 50.00th=[ 553], 60.00th=[ 603],
| 70.00th=[ 635], 80.00th=[ 676], 90.00th=[ 1123], 95.00th=[ 1221],
| 99.00th=[ 1680], 99.50th=[ 1795], 99.90th=[ 2278], 99.95th=[ 2999],
| 99.99th=[13566]
bw ( KiB/s): min= 2419, max= 3595, per=100.00%, avg=3216.67, stdev=222.39, samples=86
iops : min= 4838, max= 7190, avg=6433.76, stdev=444.73, samples=86
lat (usec) : 20=0.01%, 50=1.77%, 100=41.09%, 250=1.66%, 500=0.20%
lat (usec) : 750=40.10%, 1000=1.09%
lat (msec) : 2=13.94%, 4=0.11%, 10=0.01%, 20=0.03%, 50=0.01%
cpu : usr=1.49%, sys=17.11%, ctx=94314, majf=0, minf=11
IO depths : 1=0.1%, 2=0.1%, 4=100.0%, 8=0.0%, 16=0.0%, 32=0.0%, >=64=0.0%
submit : 0=0.0%, 4=100.0%, 8=0.0%, 16=0.0%, 32=0.0%, 64=0.0%, >=64=0.0%
complete : 0=0.0%, 4=100.0%, 8=0.0%, 16=0.0%, 32=0.0%, 64=0.0%, >=64=0.0%
issued rwts: total=385078,0,0,0 short=0,0,0,0 dropped=0,0,0,0
latency : target=0, window=0, percentile=100.00%, depth=4
seq-write: (groupid=2, jobs=1): err= 0: pid=44547: Mon Mar 7 23:42:01 2022
write: IOPS=206k, BW=101MiB/s (105MB/s)(6032MiB/60001msec); 0 zone resets
slat (usec): min=2, max=24843, avg= 4.08, stdev=37.06
clat (nsec): min=1314, max=24859k, avg=15086.66, stdev=64421.15
lat (usec): min=4, max=24862, avg=19.23, stdev=74.40
clat percentiles (usec):
| 1.00th=[ 11], 5.00th=[ 11], 10.00th=[ 11], 20.00th=[ 11],
| 30.00th=[ 11], 40.00th=[ 12], 50.00th=[ 12], 60.00th=[ 12],
| 70.00th=[ 13], 80.00th=[ 13], 90.00th=[ 14], 95.00th=[ 21],
| 99.00th=[ 34], 99.50th=[ 45], 99.90th=[ 660], 99.95th=[ 1020],
| 99.99th=[ 1762]
bw ( KiB/s): min=61533, max=118048, per=99.91%, avg=102850.88, stdev=11619.07, samples=86
iops : min=123066, max=236096, avg=205702.23, stdev=23238.09, samples=86
lat (usec) : 2=0.01%, 10=0.01%, 20=94.42%, 50=5.12%, 100=0.06%
lat (usec) : 250=0.04%, 500=0.01%, 750=0.28%, 1000=0.02%
lat (msec) : 2=0.04%, 4=0.01%, 10=0.01%, 20=0.01%, 50=0.01%
cpu : usr=19.74%, sys=63.16%, ctx=35441, majf=0, minf=13
IO depths : 1=0.1%, 2=0.1%, 4=100.0%, 8=0.0%, 16=0.0%, 32=0.0%, >=64=0.0%
submit : 0=0.0%, 4=100.0%, 8=0.0%, 16=0.0%, 32=0.0%, 64=0.0%, >=64=0.0%
complete : 0=0.0%, 4=100.0%, 8=0.0%, 16=0.0%, 32=0.0%, 64=0.0%, >=64=0.0%
issued rwts: total=0,12352876,0,0 short=0,0,0,0 dropped=0,0,0,0
latency : target=0, window=0, percentile=100.00%, depth=4
rand-write: (groupid=3, jobs=1): err= 0: pid=59723: Mon Mar 7 23:42:01 2022
write: IOPS=2778, BW=1389KiB/s (1422kB/s)(81.4MiB/60001msec); 0 zone resets
slat (usec): min=3, max=36188, avg=357.25, stdev=634.28
clat (usec): min=2, max=37646, avg=1081.06, stdev=1129.42
lat (usec): min=25, max=37673, avg=1438.58, stdev=1313.86
clat percentiles (usec):
| 1.00th=[ 61], 5.00th=[ 75], 10.00th=[ 81], 20.00th=[ 87],
| 30.00th=[ 98], 40.00th=[ 725], 50.00th=[ 1037], 60.00th=[ 1123],
| 70.00th=[ 1287], 80.00th=[ 1975], 90.00th=[ 2442], 95.00th=[ 3097],
| 99.00th=[ 4555], 99.50th=[ 5342], 99.90th=[ 7373], 99.95th=[ 9110],
| 99.99th=[25297]
bw ( KiB/s): min= 801, max= 2739, per=100.00%, avg=1391.27, stdev=178.01, samples=119
iops : min= 1602, max= 5478, avg=2782.54, stdev=356.02, samples=119
lat (usec) : 4=0.01%, 20=0.01%, 50=0.30%, 100=30.17%, 250=7.78%
lat (usec) : 500=0.34%, 750=1.48%, 1000=5.64%
lat (msec) : 2=34.70%, 4=17.70%, 10=1.83%, 20=0.03%, 50=0.02%
cpu : usr=0.88%, sys=9.65%, ctx=47811, majf=0, minf=11
IO depths : 1=0.1%, 2=0.1%, 4=100.0%, 8=0.0%, 16=0.0%, 32=0.0%, >=64=0.0%
submit : 0=0.0%, 4=100.0%, 8=0.0%, 16=0.0%, 32=0.0%, 64=0.0%, >=64=0.0%
complete : 0=0.0%, 4=100.0%, 8=0.0%, 16=0.0%, 32=0.0%, 64=0.0%, >=64=0.0%
issued rwts: total=0,166684,0,0 short=0,0,0,0 dropped=0,0,0,0
latency : target=0, window=0, percentile=100.00%, depth=4
Run status group 0 (all jobs):
READ: bw=202MiB/s (212MB/s), 202MiB/s-202MiB/s (212MB/s-212MB/s), io=10.0GiB (10.7GB), run=50642-50642msec
Run status group 1 (all jobs):
READ: bw=3209KiB/s (3286kB/s), 3209KiB/s-3209KiB/s (3286kB/s-3286kB/s), io=188MiB (197MB), run=60001-60001msec
Run status group 2 (all jobs):
WRITE: bw=101MiB/s (105MB/s), 101MiB/s-101MiB/s (105MB/s-105MB/s), io=6032MiB (6325MB), run=60001-60001msec
Run status group 3 (all jobs):
WRITE: bw=1389KiB/s (1422kB/s), 1389KiB/s-1389KiB/s (1422kB/s-1422kB/s), io=81.4MiB (85.3MB), run=60001-60001msec
Block Size 4k / Ashift 12
seq-read: (g=0): rw=read, bs=(R) 4096B-4096B, (W) 4096B-4096B, (T) 4096B-4096B, ioengine=libaio, iodepth=4
rand-read: (g=1): rw=randread, bs=(R) 4096B-4096B, (W) 4096B-4096B, (T) 4096B-4096B, ioengine=libaio, iodepth=4
seq-write: (g=2): rw=write, bs=(R) 4096B-4096B, (W) 4096B-4096B, (T) 4096B-4096B, ioengine=libaio, iodepth=4
rand-write: (g=3): rw=randwrite, bs=(R) 4096B-4096B, (W) 4096B-4096B, (T) 4096B-4096B, ioengine=libaio, iodepth=4
fio-3.23
Starting 4 processes
seq-read: Laying out IO file (1 file / 10240MiB)
Jobs: 1 (f=1): [_(3),w(1)][59.7%][w=10.7MiB/s][w=2745 IOPS][eta 02m:09s]
seq-read: (groupid=0, jobs=1): err= 0: pid=57281: Mon Mar 7 23:47:49 2022
read: IOPS=92.5k, BW=361MiB/s (379MB/s)(10.0GiB/28328msec)
slat (nsec): min=1649, max=12723k, avg=9796.60, stdev=79990.10
clat (nsec): min=1454, max=12784k, avg=33068.99, stdev=138323.89
lat (usec): min=3, max=12792, avg=42.95, stdev=159.18
clat percentiles (usec):
| 1.00th=[ 8], 5.00th=[ 8], 10.00th=[ 9], 20.00th=[ 9],
| 30.00th=[ 9], 40.00th=[ 9], 50.00th=[ 11], 60.00th=[ 12],
| 70.00th=[ 13], 80.00th=[ 14], 90.00th=[ 29], 95.00th=[ 163],
| 99.00th=[ 441], 99.50th=[ 586], 99.90th=[ 922], 99.95th=[ 1188],
| 99.99th=[ 2147]
bw ( KiB/s): min=222328, max=416368, per=99.81%, avg=369458.49, stdev=67095.84, samples=41
iops : min=55582, max=104092, avg=92364.32, stdev=16773.93, samples=41
lat (usec) : 2=0.01%, 10=47.60%, 20=39.78%, 50=4.16%, 100=0.77%
lat (usec) : 250=4.34%, 500=2.59%, 750=0.56%, 1000=0.10%
lat (msec) : 2=0.07%, 4=0.01%, 10=0.01%, 20=0.01%
cpu : usr=12.00%, sys=28.75%, ctx=75192, majf=0, minf=16
IO depths : 1=0.1%, 2=0.1%, 4=100.0%, 8=0.0%, 16=0.0%, 32=0.0%, >=64=0.0%
submit : 0=0.0%, 4=100.0%, 8=0.0%, 16=0.0%, 32=0.0%, 64=0.0%, >=64=0.0%
complete : 0=0.0%, 4=100.0%, 8=0.0%, 16=0.0%, 32=0.0%, 64=0.0%, >=64=0.0%
issued rwts: total=2621440,0,0,0 short=0,0,0,0 dropped=0,0,0,0
latency : target=0, window=0, percentile=100.00%, depth=4
rand-read: (groupid=1, jobs=1): err= 0: pid=2166: Mon Mar 7 23:47:49 2022
read: IOPS=6223, BW=24.3MiB/s (25.5MB/s)(1459MiB/60001msec)
slat (usec): min=2, max=24918, avg=158.46, stdev=413.01
clat (usec): min=13, max=26751, avg=483.18, stdev=769.79
lat (usec): min=32, max=38001, avg=641.83, stdev=910.28
clat percentiles (usec):
| 1.00th=[ 49], 5.00th=[ 64], 10.00th=[ 67], 20.00th=[ 69],
| 30.00th=[ 74], 40.00th=[ 94], 50.00th=[ 537], 60.00th=[ 586],
| 70.00th=[ 619], 80.00th=[ 668], 90.00th=[ 1090], 95.00th=[ 1188],
| 99.00th=[ 1713], 99.50th=[ 1991], 99.90th=[13042], 99.95th=[13829],
| 99.99th=[25560]
bw ( KiB/s): min=11375, max=29185, per=99.81%, avg=24845.98, stdev=4231.67, samples=86
iops : min= 2843, max= 7296, avg=6211.21, stdev=1057.91, samples=86
lat (usec) : 20=0.01%, 50=1.53%, 100=41.19%, 250=1.75%, 500=0.75%
lat (usec) : 750=38.86%, 1000=2.30%
lat (msec) : 2=13.12%, 4=0.31%, 10=0.02%, 20=0.14%, 50=0.03%
cpu : usr=1.34%, sys=16.62%, ctx=91304, majf=0, minf=15
IO depths : 1=0.1%, 2=0.1%, 4=100.0%, 8=0.0%, 16=0.0%, 32=0.0%, >=64=0.0%
submit : 0=0.0%, 4=100.0%, 8=0.0%, 16=0.0%, 32=0.0%, 64=0.0%, >=64=0.0%
complete : 0=0.0%, 4=100.0%, 8=0.0%, 16=0.0%, 32=0.0%, 64=0.0%, >=64=0.0%
issued rwts: total=373395,0,0,0 short=0,0,0,0 dropped=0,0,0,0
latency : target=0, window=0, percentile=100.00%, depth=4
seq-write: (groupid=2, jobs=1): err= 0: pid=44837: Mon Mar 7 23:47:49 2022
write: IOPS=63.6k, BW=248MiB/s (261MB/s)(10.0GiB/41216msec); 0 zone resets
slat (usec): min=2, max=24949, avg=14.80, stdev=174.58
clat (nsec): min=1273, max=24980k, avg=47763.21, stdev=301767.31
lat (usec): min=4, max=24983, avg=62.64, stdev=347.83
clat percentiles (usec):
| 1.00th=[ 12], 5.00th=[ 12], 10.00th=[ 13], 20.00th=[ 13],
| 30.00th=[ 13], 40.00th=[ 13], 50.00th=[ 13], 60.00th=[ 14],
| 70.00th=[ 14], 80.00th=[ 19], 90.00th=[ 34], 95.00th=[ 40],
| 99.00th=[ 1037], 99.50th=[ 1205], 99.90th=[ 2573], 99.95th=[ 3032],
| 99.99th=[12780]
bw ( KiB/s): min=181077, max=438810, per=99.89%, avg=254142.55, stdev=60172.58, samples=60
iops : min=45269, max=109702, avg=63535.33, stdev=15043.11, samples=60
lat (usec) : 2=0.01%, 10=0.01%, 20=81.33%, 50=14.71%, 100=0.71%
lat (usec) : 250=0.24%, 500=0.09%, 750=1.10%, 1000=0.64%
lat (msec) : 2=1.01%, 4=0.14%, 10=0.01%, 20=0.01%, 50=0.01%
cpu : usr=7.41%, sys=28.66%, ctx=32972, majf=0, minf=14
IO depths : 1=0.1%, 2=0.1%, 4=100.0%, 8=0.0%, 16=0.0%, 32=0.0%, >=64=0.0%
submit : 0=0.0%, 4=100.0%, 8=0.0%, 16=0.0%, 32=0.0%, 64=0.0%, >=64=0.0%
complete : 0=0.0%, 4=100.0%, 8=0.0%, 16=0.0%, 32=0.0%, 64=0.0%, >=64=0.0%
issued rwts: total=0,2621440,0,0 short=0,0,0,0 dropped=0,0,0,0
latency : target=0, window=0, percentile=100.00%, depth=4
rand-write: (groupid=3, jobs=1): err= 0: pid=12876: Mon Mar 7 23:47:49 2022
write: IOPS=2825, BW=11.0MiB/s (11.6MB/s)(662MiB/60002msec); 0 zone resets
slat (usec): min=3, max=24886, avg=351.35, stdev=608.69
clat (usec): min=2, max=26767, avg=1062.93, stdev=1075.23
lat (usec): min=45, max=29390, avg=1414.53, stdev=1249.67
clat percentiles (usec):
| 1.00th=[ 61], 5.00th=[ 76], 10.00th=[ 82], 20.00th=[ 87],
| 30.00th=[ 98], 40.00th=[ 848], 50.00th=[ 1037], 60.00th=[ 1106],
| 70.00th=[ 1270], 80.00th=[ 1958], 90.00th=[ 2409], 95.00th=[ 3032],
| 99.00th=[ 4359], 99.50th=[ 4948], 99.90th=[ 6718], 99.95th=[ 8455],
| 99.99th=[22938]
bw ( KiB/s): min= 8616, max=14144, per=100.00%, avg=11324.30, stdev=917.43, samples=119
iops : min= 2154, max= 3536, avg=2831.06, stdev=229.37, samples=119
lat (usec) : 4=0.01%, 20=0.01%, 50=0.29%, 100=30.22%, 250=7.57%
lat (usec) : 500=0.39%, 750=0.97%, 1000=6.55%
lat (msec) : 2=34.98%, 4=17.44%, 10=1.54%, 20=0.03%, 50=0.01%
cpu : usr=0.92%, sys=9.72%, ctx=48443, majf=0, minf=12
IO depths : 1=0.1%, 2=0.1%, 4=100.0%, 8=0.0%, 16=0.0%, 32=0.0%, >=64=0.0%
submit : 0=0.0%, 4=100.0%, 8=0.0%, 16=0.0%, 32=0.0%, 64=0.0%, >=64=0.0%
complete : 0=0.0%, 4=100.0%, 8=0.0%, 16=0.0%, 32=0.0%, 64=0.0%, >=64=0.0%
issued rwts: total=0,169523,0,0 short=0,0,0,0 dropped=0,0,0,0
latency : target=0, window=0, percentile=100.00%, depth=4
Run status group 0 (all jobs):
READ: bw=361MiB/s (379MB/s), 361MiB/s-361MiB/s (379MB/s-379MB/s), io=10.0GiB (10.7GB), run=28328-28328msec
Run status group 1 (all jobs):
READ: bw=24.3MiB/s (25.5MB/s), 24.3MiB/s-24.3MiB/s (25.5MB/s-25.5MB/s), io=1459MiB (1529MB), run=60001-60001msec
Run status group 2 (all jobs):
WRITE: bw=248MiB/s (261MB/s), 248MiB/s-248MiB/s (261MB/s-261MB/s), io=10.0GiB (10.7GB), run=41216-41216msec
Run status group 3 (all jobs):
WRITE: bw=11.0MiB/s (11.6MB/s), 11.0MiB/s-11.0MiB/s (11.6MB/s-11.6MB/s), io=662MiB (694MB), run=60002-60002msec
Block Size 8k / Ashift 13
seq-read: (g=0): rw=read, bs=(R) 8192B-8192B, (W) 8192B-8192B, (T) 8192B-8192B, ioengine=libaio, iodepth=4
rand-read: (g=1): rw=randread, bs=(R) 8192B-8192B, (W) 8192B-8192B, (T) 8192B-8192B, ioengine=libaio, iodepth=4
seq-write: (g=2): rw=write, bs=(R) 8192B-8192B, (W) 8192B-8192B, (T) 8192B-8192B, ioengine=libaio, iodepth=4
rand-write: (g=3): rw=randwrite, bs=(R) 8192B-8192B, (W) 8192B-8192B, (T) 8192B-8192B, ioengine=libaio, iodepth=4
fio-3.23
Starting 4 processes
seq-read: Laying out IO file (1 file / 10240MiB)
Jobs: 1 (f=1): [_(3),w(1)][59.9%][w=13.0MiB/s][w=1788 IOPS][eta 02m:08s]
seq-read: (groupid=0, jobs=1): err= 0: pid=7522: Mon Mar 7 23:53:32 2022
read: IOPS=39.1k, BW=305MiB/s (320MB/s)(10.0GiB/33553msec)
slat (nsec): min=1855, max=13480k, avg=24436.50, stdev=196678.73
clat (nsec): min=1469, max=13496k, avg=77508.98, stdev=337467.22
lat (usec): min=3, max=13499, avg=102.04, stdev=387.41
clat percentiles (usec):
| 1.00th=[ 9], 5.00th=[ 10], 10.00th=[ 10], 20.00th=[ 10],
| 30.00th=[ 10], 40.00th=[ 10], 50.00th=[ 14], 60.00th=[ 16],
| 70.00th=[ 17], 80.00th=[ 29], 90.00th=[ 206], 95.00th=[ 412],
| 99.00th=[ 898], 99.50th=[ 1172], 99.90th=[ 2073], 99.95th=[12256],
| 99.99th=[12518]
bw ( KiB/s): min=195616, max=412528, per=99.90%, avg=312195.83, stdev=86634.46, samples=48
iops : min=24452, max=51566, avg=39024.17, stdev=10829.25, samples=48
lat (usec) : 2=0.01%, 10=42.55%, 20=32.72%, 50=7.70%, 100=0.55%
lat (usec) : 250=9.05%, 500=4.42%, 750=1.63%, 1000=0.60%
lat (msec) : 2=0.67%, 4=0.05%, 20=0.05%
cpu : usr=5.82%, sys=17.60%, ctx=74453, majf=0, minf=19
IO depths : 1=0.1%, 2=0.1%, 4=100.0%, 8=0.0%, 16=0.0%, 32=0.0%, >=64=0.0%
submit : 0=0.0%, 4=100.0%, 8=0.0%, 16=0.0%, 32=0.0%, 64=0.0%, >=64=0.0%
complete : 0=0.0%, 4=100.0%, 8=0.0%, 16=0.0%, 32=0.0%, 64=0.0%, >=64=0.0%
issued rwts: total=1310720,0,0,0 short=0,0,0,0 dropped=0,0,0,0
latency : target=0, window=0, percentile=100.00%, depth=4
rand-read: (groupid=1, jobs=1): err= 0: pid=29731: Mon Mar 7 23:53:32 2022
read: IOPS=5827, BW=45.5MiB/s (47.7MB/s)(2732MiB/60001msec)
slat (usec): min=2, max=25743, avg=169.22, stdev=441.20
clat (nsec): min=1633, max=27271k, avg=516016.87, stdev=810421.15
lat (usec): min=22, max=37803, avg=685.50, stdev=958.34
clat percentiles (usec):
| 1.00th=[ 50], 5.00th=[ 65], 10.00th=[ 67], 20.00th=[ 69],
| 30.00th=[ 73], 40.00th=[ 94], 50.00th=[ 578], 60.00th=[ 619],
| 70.00th=[ 652], 80.00th=[ 701], 90.00th=[ 1172], 95.00th=[ 1254],
| 99.00th=[ 1844], 99.50th=[ 2343], 99.90th=[13042], 99.95th=[13960],
| 99.99th=[25560]
bw ( KiB/s): min=25548, max=56288, per=99.69%, avg=46477.88, stdev=8218.44, samples=84
iops : min= 3193, max= 7036, avg=5809.37, stdev=1027.29, samples=84
lat (usec) : 2=0.01%, 20=0.01%, 50=1.33%, 100=41.67%, 250=1.35%
lat (usec) : 500=0.12%, 750=38.17%, 1000=2.31%
lat (msec) : 2=14.31%, 4=0.52%, 10=0.03%, 20=0.15%, 50=0.03%
cpu : usr=1.41%, sys=15.88%, ctx=86229, majf=0, minf=19
IO depths : 1=0.1%, 2=0.1%, 4=100.0%, 8=0.0%, 16=0.0%, 32=0.0%, >=64=0.0%
submit : 0=0.0%, 4=100.0%, 8=0.0%, 16=0.0%, 32=0.0%, 64=0.0%, >=64=0.0%
complete : 0=0.0%, 4=100.0%, 8=0.0%, 16=0.0%, 32=0.0%, 64=0.0%, >=64=0.0%
issued rwts: total=349661,0,0,0 short=0,0,0,0 dropped=0,0,0,0
latency : target=0, window=0, percentile=100.00%, depth=4
seq-write: (groupid=2, jobs=1): err= 0: pid=59526: Mon Mar 7 23:53:32 2022
write: IOPS=36.6k, BW=286MiB/s (300MB/s)(10.0GiB/35824msec); 0 zone resets
slat (usec): min=3, max=24896, avg=26.31, stdev=179.17
clat (nsec): min=1405, max=24920k, avg=82630.21, stdev=306807.41
lat (usec): min=5, max=24925, avg=109.03, stdev=351.66
clat percentiles (usec):
| 1.00th=[ 13], 5.00th=[ 14], 10.00th=[ 14], 20.00th=[ 14],
| 30.00th=[ 14], 40.00th=[ 14], 50.00th=[ 14], 60.00th=[ 15],
| 70.00th=[ 18], 80.00th=[ 34], 90.00th=[ 40], 95.00th=[ 627],
| 99.00th=[ 1254], 99.50th=[ 1467], 99.90th=[ 2933], 99.95th=[ 3163],
| 99.99th=[ 5932]
bw ( KiB/s): min=191232, max=524263, per=99.85%, avg=292277.83, stdev=73343.82, samples=52
iops : min=23904, max=65532, avg=36534.29, stdev=9167.91, samples=52
lat (usec) : 2=0.01%, 10=0.01%, 20=72.48%, 50=19.26%, 100=1.70%
lat (usec) : 250=0.46%, 500=0.03%, 750=1.85%, 1000=1.31%
lat (msec) : 2=2.60%, 4=0.28%, 10=0.01%, 20=0.01%, 50=0.01%
cpu : usr=4.89%, sys=21.73%, ctx=32207, majf=0, minf=12
IO depths : 1=0.1%, 2=0.1%, 4=100.0%, 8=0.0%, 16=0.0%, 32=0.0%, >=64=0.0%
submit : 0=0.0%, 4=100.0%, 8=0.0%, 16=0.0%, 32=0.0%, 64=0.0%, >=64=0.0%
complete : 0=0.0%, 4=100.0%, 8=0.0%, 16=0.0%, 32=0.0%, 64=0.0%, >=64=0.0%
issued rwts: total=0,1310720,0,0 short=0,0,0,0 dropped=0,0,0,0
latency : target=0, window=0, percentile=100.00%, depth=4
rand-write: (groupid=3, jobs=1): err= 0: pid=572: Mon Mar 7 23:53:32 2022
write: IOPS=2766, BW=21.6MiB/s (22.7MB/s)(1297MiB/60001msec); 0 zone resets
slat (usec): min=4, max=24948, avg=358.90, stdev=642.01
clat (usec): min=2, max=38100, avg=1085.59, stdev=1153.62
lat (usec): min=44, max=39260, avg=1444.76, stdev=1350.83
clat percentiles (usec):
| 1.00th=[ 61], 5.00th=[ 72], 10.00th=[ 81], 20.00th=[ 86],
| 30.00th=[ 95], 40.00th=[ 676], 50.00th=[ 1037], 60.00th=[ 1123],
| 70.00th=[ 1303], 80.00th=[ 1958], 90.00th=[ 2507], 95.00th=[ 3064],
| 99.00th=[ 4686], 99.50th=[ 5473], 99.90th=[ 7963], 99.95th=[12649],
| 99.99th=[25297]
bw ( KiB/s): min=12272, max=40496, per=100.00%, avg=22213.78, stdev=3626.11, samples=119
iops : min= 1534, max= 5062, avg=2776.72, stdev=453.26, samples=119
lat (usec) : 4=0.01%, 50=0.36%, 100=31.45%, 250=6.16%, 500=0.44%
lat (usec) : 750=2.26%, 1000=5.54%
lat (msec) : 2=34.44%, 4=17.44%, 10=1.86%, 20=0.06%, 50=0.02%
cpu : usr=0.93%, sys=9.82%, ctx=48827, majf=0, minf=11
IO depths : 1=0.1%, 2=0.1%, 4=100.0%, 8=0.0%, 16=0.0%, 32=0.0%, >=64=0.0%
submit : 0=0.0%, 4=100.0%, 8=0.0%, 16=0.0%, 32=0.0%, 64=0.0%, >=64=0.0%
complete : 0=0.0%, 4=100.0%, 8=0.0%, 16=0.0%, 32=0.0%, 64=0.0%, >=64=0.0%
issued rwts: total=0,165978,0,0 short=0,0,0,0 dropped=0,0,0,0
latency : target=0, window=0, percentile=100.00%, depth=4
Run status group 0 (all jobs):
READ: bw=305MiB/s (320MB/s), 305MiB/s-305MiB/s (320MB/s-320MB/s), io=10.0GiB (10.7GB), run=33553-33553msec
Run status group 1 (all jobs):
READ: bw=45.5MiB/s (47.7MB/s), 45.5MiB/s-45.5MiB/s (47.7MB/s-47.7MB/s), io=2732MiB (2864MB), run=60001-60001msec
Run status group 2 (all jobs):
WRITE: bw=286MiB/s (300MB/s), 286MiB/s-286MiB/s (300MB/s-300MB/s), io=10.0GiB (10.7GB), run=35824-35824msec
Run status group 3 (all jobs):
WRITE: bw=21.6MiB/s (22.7MB/s), 21.6MiB/s-21.6MiB/s (22.7MB/s-22.7MB/s), io=1297MiB (1360MB), run=60001-60001msec