


Capt.Insano
Community Developer
-
Joined
-
Last visited
Everything posted by Capt.Insano
-
I updated the plugin today and now I am getting the following error at the top of the speedtest page in the WebUI: Warning: parse_ini_file(/boot/config/plugins/speedtest/speedtest.cfg): failed to open stream: No such file or directory in /usr/local/emhttp/plugins/speedtest/include/parse_cfg.php on line 4 I have cleared browser cache but the error remains, any ideas? Thanks!
-
Any chance of adding a cron option? Running it every x hours/days/weeks with no user interaction and the results added to the table. I wouldn't mind repeating this on a schedule to monitor the average speeds from my ISP. Just an idea! Thanks
-
I was just looking through your cups DOCKERFILE and I think all of the above has already been added!! If so, please disregard all I said!! (and possibly think of adding "Cloudprint/Airprint Supported" to the container description to stop fools like me bothering you!!) Thanks again, The Capt!
-
@gfjardim Any interest in 1. Adding Google Cloud Print to your cups Docker Container?: Here is the guide I used (including a PPA for ease of use) when setting up a raspberry pi as a CUPS print server. http://davesteele.github.io/cloudprint-service/index.html Maybe map the config file to a Docker exposed volume? 2. Adding iOS Airprint?: Again I followed this guide to add Airprint to Cloudrprint and CUPS on my pi: https://rohankapoor.com/2012/06/configuring-the-raspberry-pi-as-an-airprint-server/ Especially since unRAID 6.0.1 has added USB printer support, I would love to free my RasPi for other projects! Anyway, thanks as always gfjardim! The Capt Edit: see below!!
-
Any update?
-
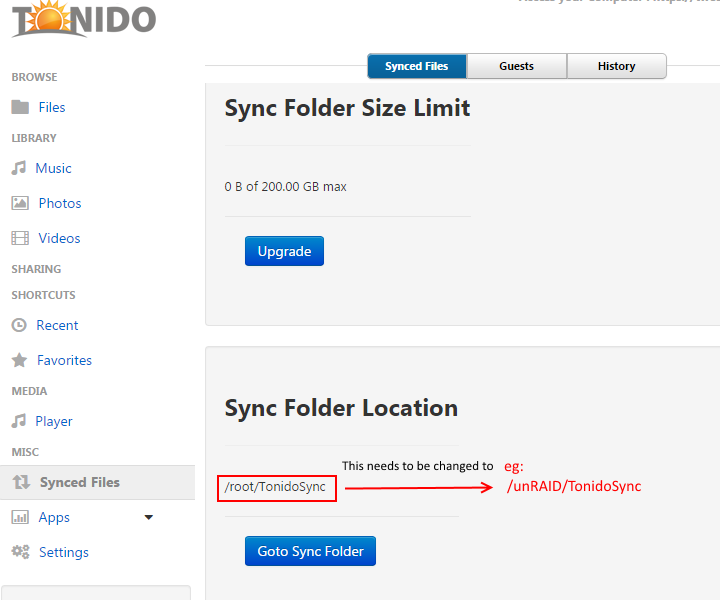
I think I found the answer to your problem: The Sync Plugin of Tonido is set such that the Sync Folder location is "/root/TonidoSync" by default, but we want the Sync folder location to be a subfolder of /unRAID. See my attached image for an example and follow the instructions here to change the location of your sync folder to be a subfolder of /unRAID. On my system (yours will vary) the location of the xml to be changed was /mnt/cache/Docker/AppData/Tonido/profiles\<myprofile>\plugindata\syncserver\syncserverconfig.xml stop the docker, edit the file changing <rowentry> <name>syncfolderlocation</name> <type>string</type> <value>DEFAULT</value> </rowentry> to <rowentry> <name>syncfolderlocation</name> <type>string</type> <value>/unRAID/TonidoFiles/Sync</value> </rowentry> Save file and restart Tonido Docker. Check that folder location is now correctly showing new location. Should work now. the Capt.
-
Your volume mapping is correct so. If you login to your Tonido server via the webui you should see the blank test.txt file. If you place files in /mnt/user/Tonido they will be accessible via tonido.
-
Will you run the following: touch /mnt/user/Tonido/test.txt docker exec -it Tonido /bin/bash ls -la /unRAID Post the output. (Using CODE tags if possible for easier reading) If test.txt exists in /unRAID inside the container then your mapping is correct.
-
Could you do the following: 1: SSH into your unRAID server and post the output of the following commands ls- la /mnt/user ls -la /mnt/user/Tonido 2. Enter the following commands (one after the other) and post the outputs: docker exec -it Tonido /bin/bash ls -la /unRAID The Capt.
-
Does the plugin also now work on beta14b? Thanks for the work!
-
Look under /unRaid in Tonido!
-
Look at the Tonido wiki or forums for multiuser instructions or Just run multiple Tonido containers on different ports to allow different users!!
-
Didn't have any excessive CPU use during indexing myself (and I also run Folding@Home full-time), but you could always look at the following to use CPU pinning: http://lime-technology.com/forum/index.php?topic=36257.0
-
Reserved
-
Hi folks I have put together a container for Tonido server. It allows secure remote file management(including downloading files from unRAID server remotely) and file access (Video/Audio Streaming etc.). It also comes with some pretty great iOS and Android apps for remote access. Official Blurb: It is fairly self explanitory when set up. Go to: http://www.tonido.com/ for more info. To get it, just add my repo: https://github.com/CaptInsano/docker-containers/tree/templates Hope you enjoy, The Capt.
-
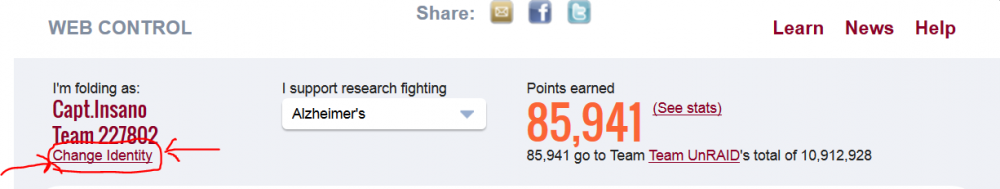
To confirm my own suspicion: Yes, yes usernames can be easily changed via the WebUI!! See screenshot attached!
-
Can't it also be done through the webui? I seem to remember changing it very easily through the webui.
-
I also use plop bootmanager, my server does actually support USB booting but only at USB 1.1 speeds for some weird reason so boot took FOREVER!! Now I have my server to autoboot to CD with plop on it, plop then loads proper USB drivers and boots off my unRAID USB stick WAY faster than without plop. Hopefully you can get this to work and get your test server up and running again, I find Docker great but I really want to try and run Vortexbox on my server and it need proper virtualisation. Anyway, best of luck!
-
Thanks for suggestion, but I'm afraid this will not work, looking at the addition suggested to the GO file I checked around my file system and "/usr/local/emhttp/plugins/webGui/phaze.page" does not even exist on my system. Hopefully we will see native support of b12+ within this plugin soon, until then I'll wait!
-
I have been unable to get this plugin working on 6b12+. I just attempted with 6b14b, I was going to compile VirtualBox for my kernel myself. I installed the plg using the webui but I could not access the plugin settings page, it was just blank even after a restart. Hopefully it will be updated at some stage!
-
Sorry was away all weekend. Changes look good, merged to master. Thanks Sparklyballs!! For anyone updating, Sparkyballs changes resulted that I needed to update my Username and Passkey via the webUI. EDIT: No longer an issue, I update the template.xml to reflect the new directory structure within the container. Anyone updating: change "/etc/fahclient" to "/config" in the "Edit Docker" popup. The Capt.
-
@Darqfallen Some score!! Good job! What are the specs of your unRAID machine? You much be flying through the work units to get that score (417268 at time of post) with that few work units done (42 at the of post). You are averaging 9935 points per work unit, that is amazing!! I am only averaging 155 by comparision!! (My CPU: AMD Athlon 64x2 Dual core 4600+ 2.41GHZ) @everyone Incase anyone is interested (I was, I just read it) here is how points are calculated!! Also Team unRAID is doing great everyone!, with only 8 named members we are in the 96th percentile of all Folding@Home Teams ie: We doing better than 95% of all the teams registered with Folding@Home. Thanks to all, hopefully more unRAID users will join us! The Capt.
-
Not possible in docker I'm afraid. Docker does not support device passthrough. UnRAID itself would need to have the 301.xx NV drivers included for a container to be able to use the device. It should be possible in a Virtual Machine however if your motherboard supports passthrough, maybe have a look at XEN or KVM or the VirtualBox Plugin. The Capt.
-
Just wondering; As Folding@Home has no native scheduling ability, would people be interested in a crontab scheduling option that would allow people schedule times where FAHClient would run @ Light/Medium/Full Power etc.? From what I have been reading on the Folding@Home wiki it should be possible. I am mainly thinking of people who may be avoiding this container due to already running intensive CPU tasks such as Plex etc. and worrying that it would affect their streams during the day. My Idea: If people had the FAHClient running with "Light" CPU use during the day they would notice no problems with other services from their UnRAID server and then maybe change to "Medium" or "High" CPU use during the night when the server is not in use. Ideas Welcome. The Capt.
-
Have a look here: https://fah-web.stanford.edu/projects/FAHClient/wiki/ClientDifferencesV6ToV7 and https://fah-web.stanford.edu/projects/FAHClient/wiki/ClientUserGuide It gives a list of options that can be added to the config.xml to set it up as you would like. I will add that link to the OP. @All: I finally figured out the correct mounting and saving of the config.xml. (Thank your BRiT!) Update is now out that fixes it. Both the DockerMan .xml and the container have been updated so hit "Reload Info" on DockerMan prior to re-adding Container. Anyway, bumpy ride but hopefully all is well now!! Thanks for being impromptu beta-testers!!

