

IamSpartacus
-
Posts
802 -
Joined
-
Last visited
Content Type
Profiles
Forums
Downloads
Store
Gallery
Bug Reports
Documentation
Landing
Report Comments posted by IamSpartacus
-
-
Changed Status to Open
-
5 minutes ago, jonp said:
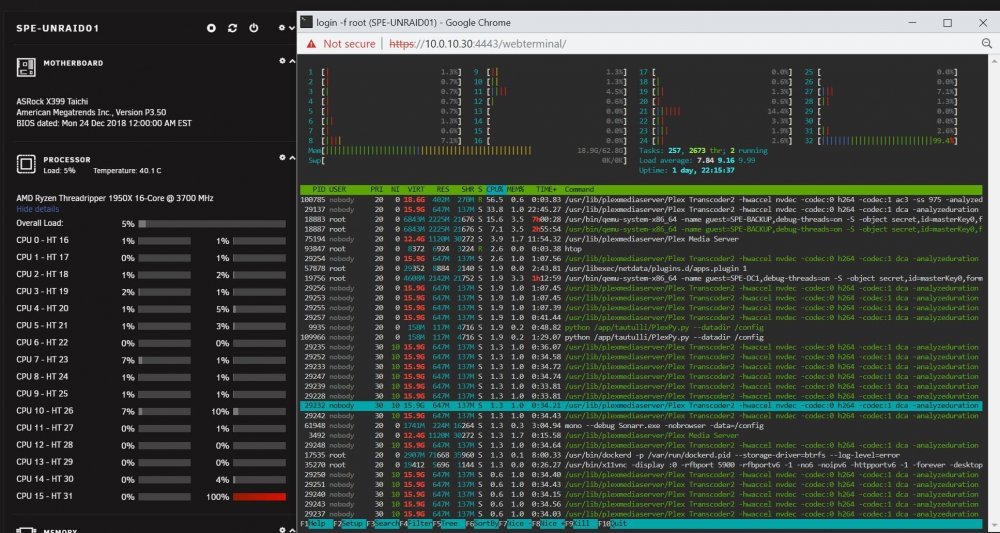
I believe the OP is confused by the CPU numbering in HTOP vs. our dashboard. In htop, there is no CPU0, so CPU0 = CPU1. That means that your pinning in htop is for CPUs 13-16 and 29-32. I do not see any other processes using those CPUs. Marking for retest to give the OP time to produce evidence to the contrary.
4 minutes ago, limetech said:From your first post, can't tell what process is running on which cpu.
From your last post, htop only says CPU 28 is being used by host process (ffmpeg). But, 'htop' numbers CPU from 1 instead of 0, so that's really CPU 27.
I agree about CPU 28 being 27 and thus not one of the pinned cores. But Look at the 3rd process down in my most recent Screen Shot. It's using CPU 31 (or CPU 30).
-
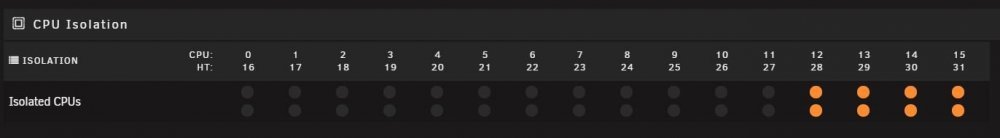
No docker containers have pinned CPUs. Please see attached.

-
Changed Status to Open
-
5 minutes ago, jbartlett said:
Other than I didn't know about being able to hyphenate the range, no.
I didn't do it manually. By isolating the CPUs in the settings it appended the syslinux file automatically.
-
19 hours ago, jbartlett said:
On your HTOP, the matching CPU from the Dashboard graph is also maxed which isn't the scenario I reported here.
I'd recommend excluding the VM CPU's in the sys config to keep the OS away from them.
IE: append isolcpus=12,13,14,15,28,29,30,31 initrd=/bzroot
I already have the CPU's isolated as you can see from my screen shot but my syslinux file looks like shows isolcpus=12-15,28-31 instead of isolcpus=12,13,14,15,28,29,30,31 like you described. Is there a difference there?
-
This happened to me the other day.
I just noticed this behavior as well. Running RC7. To make things even weirder you can see the one CPU thread that is showing as pinned at 100% is isolated to a VM that is powered off. I also noticed something else which could be completely unrelated. But while this is happening if I switch tabs in Chrome so that Unraid is in the background, when I go back to that tab I'm at a blank (black) web page and I have to reload the page to access the WebGUI again.
-
Changed Status to Solved
-
Ok I think I found the culprint. My Unifi Video docker appears to have a memory leak and it keeps hitting it's 4GB limit.
Feb 25 09:38:31 SPE-UNRAID01 kernel: Task in /docker/55b2e60f9f27f0028b26ff6f2afd34d31c045f1660d64d530ff2622a795f96cc killed as a result of limit of /docker/55b2e60f9f27f0028b26ff6f2afd34d31c045f1660d64d530ff2622a795f96cc Feb 25 09:38:31 SPE-UNRAID01 kernel: memory: usage 4194304kB, limit 4194304kB, failcnt 234151298 Feb 25 09:38:31 SPE-UNRAID01 kernel: memory+swap: usage 4194304kB, limit 8388608kB, failcnt 0 Feb 25 09:38:31 SPE-UNRAID01 kernel: kmem: usage 47156kB, limit 9007199254740988kB, failcnt 0 Feb 25 09:38:31 SPE-UNRAID01 kernel: Memory cgroup stats for /docker/55b2e60f9f27f0028b26ff6f2afd34d31c045f1660d64d530ff2622a795f96cc: cache:12772KB rss:4133200KB rss_huge:1951744KB shmem:3480KB mapped_file:396KB dirty:396KB writeback:132KB swap:0KB inactive_anon:3928KB active_anon:4134452KB inactive_file:4896KB active_file:1180KB unevictable:0KB Feb 25 09:38:31 SPE-UNRAID01 kernel: Tasks state (memory values in pages): Feb 25 09:38:31 SPE-UNRAID01 kernel: [ pid ] uid tgid total_vm rss pgtables_bytes swapents oom_score_adj name Feb 25 09:38:31 SPE-UNRAID01 kernel: [ 32436] 0 32436 5840 81 81920 0 0 run.sh Feb 25 09:38:31 SPE-UNRAID01 kernel: [ 32578] 0 32578 4314 42 73728 0 0 jsvc Feb 25 09:38:31 SPE-UNRAID01 kernel: [ 8499] 99 8499 7912541 1030559 10633216 0 0 jsvc Feb 25 09:38:31 SPE-UNRAID01 kernel: Memory cgroup out of memory: Kill process 8499 (jsvc) score 985 or sacrifice child Feb 25 09:38:31 SPE-UNRAID01 kernel: Killed process 8499 (jsvc) total-vm:31650164kB, anon-rss:4123796kB, file-rss:0kB, shmem-rss:0kB -
57 minutes ago, trurl said:
Your syslog says it had to kill something due to out of memory. This is something you need to deal with whether or not it is currently out of memory. I doubt this has anything to do with the release.
I just don't get what that could be since i have 64GB of memory in my server and it's only using a third. Unless it will log this error if one of my dockers is hitting it's configured limit?
-
If by console you mean a terminal window, I also have had this happen on RC4. Checked logs when it happened but no entries so didn't have any info to share.
-
@bonienl Love the new syslog feature, it's fantastic.
Now let me know if I should create a separate feature request for this but is it possible to allow the syslogs to go to a mounted Unassigned Disk? Right now the only available shares to send the syslogs to are those defined specifically in "Shares."
Again thanks so much for this feature, game changer for me.
-
Quote
Mainly bug fix to address "slow transfer to xfs-encrypted array disks" issue.
I will test this on both my servers this weekend.
-
Just now, Niklas said:
I had 3 encrypted drives (all my stuff still fits on 1 disk). Moved everything and formatted the drive without encryption. Moving over to IronWolf so for now, I have 1 unencrypted and 1 encrypted drives.
")
Nice, you're the perfect test case then.
-
2 minutes ago, Niklas said:
I have tested it.
Oh nice. You must either have little data on your array or 1+ unencrypted drives to begin with. Glad to know it's been tested though.
-
I have to say since rolling back to the 6.6.6 I really do like having more colorful icons. Makes navigating the WebUI much easier. Not a deal breaker for me for sure but would be nice to to offer the new/old icons as themes so users have a choice.
-
 1
1
-
 1
1
-
-
4 minutes ago, johnnie.black said:
There appears to be some issues with encryption and slow writes with v6.7
I see. I would swap back and forth between encrypted and non-encrypted array to test more if it were easy but I have too much data on my array to have to re-copy everything.
-
Upgraded both my RC2 servers without issue. Will examine logs for any issues tomorrow
-
1 minute ago, trurl said:
Do you have any other browsers (including tabs on the same browser, or mobile apps such as ControlR) open to your server?
Only one Chrome tab open on my PC (10.0.10.50).
-
Just noticed this in the logs during a mover operation. Don't know that this is RC related.
Feb 7 08:39:17 SPE-UNRAID01 nginx: 2019/02/07 08:39:17 [error] 24097#24097: *2517925 upstream timed out (110: Connection timed out) while reading response header from upstream, client: 10.0.10.50, server: , request: "POST /webGui/include/Notify.php HTTP/2.0", upstream: "fastcgi://unix:/var/run/php5-fpm.sock", host: "10.0.10.30:4443", referrer: "https://10.0.10.30:4443/Dashboard" Feb 7 08:39:18 SPE-UNRAID01 nginx: 2019/02/07 08:39:18 [error] 24097#24097: *2517925 upstream timed out (110: Connection timed out) while reading response header from upstream, client: 10.0.10.50, server: , request: "POST /webGui/include/DashUpdate.php HTTP/2.0", upstream: "fastcgi://unix:/var/run/php5-fpm.sock", host: "10.0.10.30:4443", referrer: "https://10.0.10.30:4443/Dashboard" Feb 7 08:39:22 SPE-UNRAID01 nginx: 2019/02/07 08:39:22 [error] 24097#24097: *2517925 upstream timed out (110: Connection timed out) while reading response header from upstream, client: 10.0.10.50, server: , request: "POST /plugins/preclear.disk/Preclear.php HTTP/2.0", upstream: "fastcgi://unix:/var/run/php5-fpm.sock", host: "10.0.10.30:4443", referrer: "https://10.0.10.30:4443/Dashboard" -
Changed Status to Solved
-
33 minutes ago, bonienl said:
Post a screenshot. Button size is okay on my screen.
That page looks normal to me too, but not the MAIN page that has all my array information. All the buttons under Array Operation and Shares seem huge compared to the text on that page. Will post a screen shot shortly.
-
Has anyone else commented on how large the new Orange buttons are? In Chrome I have to zoom to 80% for them to appear at a normal size. Definitely don't seem proportional the rest of the UI.
-
Ok, the issue was completely on my end. I forgot I had made some firewall changes a few months back for my VPN connection. I haven't had to reboot my server since. So I just had to allow the CIFS ports in my firewall and now I'm up and running. My sincere apologies @limetech for wasting your time.


CPU Isolation Not Working
-
-
-
-
-
in Prereleases
Posted
Yes I'm 100% sure because I've never pinned CPUs for any docker containers. But I have just taken your advice and limited the CPUs this particular container can use and it appears to have fixed the issue for the time being.