





DZMM
Members
-
Joined
-
Last visited
Everything posted by DZMM
-
@JorgeB I had a good 12+ hour run the longest in a while, but I've just lost access again. I thought I'd made it 🙁 Can you have another look please. highlander-diagnostics-20260901-1058.zip
-
Thanks. I made some other changes to reclone's VFS caching that seemed to stabilise things as I didn't have a crash for 4 hours+. But, then the docker autoupdate ran and tried to update some of my containers that I'd moved to Docker Compose. I think this triggered another crash and I'm just waiting for a task to complete before I reboot the server. Will come back if I get another crash. Should I remove all these lines? --contimeout 5 --timeout 10s --low-level-retries 3
-
I have added: --contimeout 5 --timeout 10s --low-level-retries 3 to my rclone mount to try and get it to timeout quicker
-
@JorgeB I sadly still lost webui access again after deleting the line from my script 😒 highlander-diagnostics-20260829-2035.zip
-
I have just realised that my hourly script runs at 47 mins past the hour - I just assumed it ran on the hour. This I think coincides with my crashes. If use of pgrep is the issue then this line in my hourly is the culprit as it was added a few days ago: RCLONE_PID=$(pgrep -f "rclone mount" | head -n1) I've just removed that whole section as it's pretty pointless and will see if I get stability back
-
I think that last diags didn't have what you need - just run again highlander-diagnostics-20260829-0956.zip
-
I just woke up to it being down again. I'm not sure if the command adds anything to the diagnostics as nothing was displayed in the terminal. It's driving me mad as all was good a few days ago! root@Highlander:~# echo w > /proc/sysrq-trigger root@Highlander:~# diagnostics Starting diagnostics collection... done. ZIP file '/boot/logs/highlander-diagnostics-20260829-0900.zip' created. I've been doing a lot of work to optimise my zfs snapshots, recordsizes, arr + plex + nzbdav/Decypharr stack over the last month as well as testing silo_server, so something in there is probably the issue, particularly zfs as I don't really understand it yet. At the time of the crash in that quote I think I was running this script I've been using on shares to find the best recordsizes - the silo directory is 200GB+ so that could be why, but I've run the script below in the past against large directories with no issues. #!/bin/bash # ==================================================================== # SCRIPT: ZFS performance-aligned File Size Distribution Analyzer # VERSION: 1.0 # DESCRIPTION: Analyzes file size distributions in the current directory # (or a specified target) to help align ZFS recordsizes # and find block size mismatch bottlenecks. # ==================================================================== TARGET_DIR="${1:-.}" if [ ! -d "$TARGET_DIR" ]; then echo "[-] ERROR: Directory '$TARGET_DIR' does not exist." exit 1 fi # Convert relative path to absolute for display ABS_DIR=$(cd "$TARGET_DIR" && pwd) echo "=================================================================" echo " ZFS BLOCK ALIGNMENT FILE SIZE DISTRIBUTION " echo "=================================================================" echo "Target Directory: $ABS_DIR" echo "Analyzing files... (This may take a moment for large directories)" echo "" # Scan target directory and pipe file counts/sizes into the awk bucket-analyzer find "$TARGET_DIR" -type f -exec du -b {} + 2>/dev/null | awk ' BEGIN { # ZFS Performance Buckets b[1] = 4096; # 4KB b[2] = 16384; # 16KB b[3] = 65536; # 64KB b[4] = 131072; # 128KB b[5] = 1048576; # 1MB lbl[1] = "< 4KB "; lbl[2] = "4KB - 16KB "; lbl[3] = "16KB - 64KB"; lbl[4] = "64KB-128KB "; lbl[5] = "128KB - 1MB"; lbl[6] = "> 1MB "; for (i=1; i<=6; i++) { count[i] = 0; sum[i] = 0; } } { size = $1; found = 0; for (i = 1; i <= 5; i++) { if (size <= b[i]) { count[i]++; sum[i] += size; found = 1; break; } } if (!found) { count[6]++; sum[6] += size; } } END { printf "%-15s | %10s | %15s | %10s\n", "SIZE BUCKET", "FILE COUNT", "TOTAL SIZE", "PERCENTAGE"; print "-----------------------------------------------------------------"; tot_files = 0; tot_bytes = 0; for (i = 1; i <= 6; i++) { tot_files += count[i]; tot_bytes += sum[i]; } for (i = 1; i <= 6; i++) { p = 0; if (tot_bytes > 0) p = (sum[i] / tot_bytes) * 100; h_bytes = sum[i]; unit = "B "; if (h_bytes >= 1073741824) { h_bytes /= 1073741824; unit = "GB"; } else if (h_bytes >= 1048576) { h_bytes /= 1048576; unit = "MB"; } else if (h_bytes >= 1024) { h_bytes /= 1024; unit = "KB"; } printf "%-15s | %10d | %11.2f %-2s | %9.1f%%\n", lbl[i], count[i], h_bytes, unit, p; } print "-----------------------------------------------------------------"; h_tot = tot_bytes; tot_unit = "B "; if (h_tot >= 1073741824) { h_tot /= 1073741824; tot_unit = "GB"; } else if (h_tot >= 1048576) { h_tot /= 1048576; tot_unit = "MB"; } else if (h_tot >= 1024) { h_tot /= 1024; tot_unit = "KB"; } printf "%-15s | %10d | %11.2f %-2s | %9.1f%%\n", "TOTALS", tot_files, h_tot, tot_unit, 100.0; print "================================================================="; # Output recommendations based on footprint (data density weight) print "\n[ZFS RECORDSIZE ALIGNMENT RECOMMENDATIONS]:"; max_idx = 1; max_val = sum[1]; for (i = 2; i <= 6; i++) { if (sum[i] > max_val) { max_val = sum[i]; max_idx = i; } } if (tot_files == 0) { print " -> No files detected in target directory. Recommended: Default 128K."; } else if (max_idx 1 || max_idx 2) { print " -> Majority data footprint: Small Files (< 16KB)\n RECOMMENDED RECORDSIZE: 16K (Perfect for SQLite/Postgres DB datasets!)"; } else if (max_idx == 3) { print " -> Majority data footprint: Medium-Small Files (16KB - 64KB)\n RECOMMENDED RECORDSIZE: 64K"; } else if (max_idx == 4) { print " -> Majority data footprint: Medium Files (64KB - 128KB)\n RECOMMENDED RECORDSIZE: 128K (Unraid default profile)"; } else { print " -> Majority data footprint: Large Files (> 128KB)\n RECOMMENDED RECORDSIZE: 1M (Gold standard for media/large binary streaming datasets!)"; } }' Latest diags attached. For this crash I was just moving files from mnt/cache to /mnt/appdata as /mnt/cache was over 80% utliised and the AI said this could be causing problems for ZFS snapshots and behind my issues. Once I'd finished I went to bed but it looks like some weird stuff went off around 3:30am including my VM Buzz shutting down which wasn't initiated by me. Script wise, the only scripts running overnight were my hourly maintenance script below: #!/bin/bash ### ==================================================================== ### SCRIPT: Hourly Maintenance ### VERSION: 2.3 (Boot-Sync Gated & FUSE-Safe Bypass) ### DESCRIPTION: Handles hourly snapshots, database health monitoring, ### and intelligent FUSE cache safety audits for Highlander. ### Synchronized with the v8.0 Startup State Machine. ### ==================================================================== ### --- 1. STARTUP SYNC GUARD --- # Prevent Hourly Maintenance from triggering or throwing errors if the array is still booting. # Loops and waits up to 5 minutes (300s) for the Master Startup flag to be created. READY_FLAG="/var/run/highlander_ready" MAX_BOOT_WAIT=300 BOOT_WAITED=0 while [ ! -f "$READY_FLAG" ]; do if [ $BOOT_WAITED -ge $MAX_BOOT_WAIT ]; then echo "[$(date '+%H:%M:%S')] ERROR: Master startup did not complete within ${MAX_BOOT_WAIT}s. Aborting Hourly Maintenance to prevent database/ZFS conflicts." exit 1 fi echo "[$(date '+%H:%M:%S')] WAIT: Master startup is still running. Waiting 15s before retrying..." sleep 15 ((BOOT_WAITED+=15)) done ### --- 2. USER CONFIGURATION --- # FUSE-Bypass Logging: Writes directly to physical cache NVMe to prevent filesystem locks LOG_FILE="/mnt/cache/appdata/other/scripts/hourly/hourly.log" SANOID_CONF_DIR="/boot/config/plugins/sanoid" VFS_CACHE_DIR="/mnt/samsung/streaming_cache/nzbdav" CACHE_DRIVE_MAX_UTILISATION="70%" # MULTI-DATABASE SENTINEL SETTINGS PG_CONTAINERS=("postgresql16" "silo_postgres") DB_USERS=("derycks" "silo") DB_NAMES=("postgres" "silo") MAX_CONNS=250 SLOW_QUERY_MAX_SEC=300 ### --- 3. LOGGING & NOTIFICATIONS --- mkdir -p "$(dirname "$LOG_FILE")" log_event() { local TYPE="$1" local MSG="$2" echo "[$(date '+%H:%M:%S')] $TYPE: $MSG" | tee -a "$LOG_FILE" } send_unraid_notify() { local SUBJECT="$1" local MESSAGE="$2" local IMPORTANCE="$3" # normal, warning, alert /usr/local/emhttp/webGui/scripts/notify -e "Highlander Sentinel" -s "$SUBJECT" -d "$MESSAGE" -i "$IMPORTANCE" } log_event "INFO" "--- STARTING HOURLY SYSTEM AUDIT (v2.3) ---" ### -------------------------------------------------------------------------------------- ### 1. HOURLY SANOID SNAPSHOTS ### -------------------------------------------------------------------------------------- log_event "INFO" "Ensuring Sanoid configuration link..." ln -sf "$SANOID_CONF_DIR/sanoid.conf" /etc/sanoid/sanoid.conf log_event "INFO" "Starting Sanoid snapshot and prune process..." /usr/local/sbin/sanoid --take-snapshots --prune SANOID_EXIT=$? if [ $SANOID_EXIT -ne 0 ]; then log_event "ERROR" "Sanoid snapshot process FAILED (Exit Code: $SANOID_EXIT)." send_unraid_notify "BACKUP FAILURE" "Sanoid failed to take snapshots. Check logs at $LOG_FILE" "alert" else log_event "INFO" "Sanoid snapshots completed successfully." fi ### -------------------------------------------------------------------------------------- ### 2. MULTI-POSTGRES SENTINEL (Auto-Correction & Maintenance) ### -------------------------------------------------------------------------------------- for i in "${!PG_CONTAINERS[@]}"; do CONTAINER="${PG_CONTAINERS[$i]}" DB_USER="${DB_USERS[$i]}" DB_NAME="${DB_NAMES[$i]}" log_event "INFO" "Running health audit for $CONTAINER..." # Pre-flight check: Is the database container running? if [ "$(docker inspect -f '{{.State.Running}}' "$CONTAINER" 2>/dev/null)" != "true" ]; then log_event "ERROR" "Container $CONTAINER is DOWN! Attempting auto-restart..." send_unraid_notify "CRITICAL" "Database $CONTAINER is DOWN. Auto-restart attempted." "alert" docker start "$CONTAINER" > /dev/null 2>&1 continue fi # 1. Terminate Zombie/Stalled Queries ZOMBIES=$(docker exec "$CONTAINER" psql -U "$DB_USER" -d "$DB_NAME" -t -c \ "SELECT count(*) FROM pg_stat_activity WHERE state != 'idle' AND (now() - query_start) > interval '$SLOW_QUERY_MAX_SEC seconds';" | xargs) [[ $ZOMBIES =~ ^[0-9]+$ ]] || ZOMBIES=0 if [ "$ZOMBIES" -gt 0 ]; then log_event "ACTION" "Detected $ZOMBIES hung queries in $CONTAINER. Terminating..." docker exec "$CONTAINER" psql -U "$DB_USER" -d "$DB_NAME" -c \ "SELECT pg_terminate_backend(pid) FROM pg_stat_activity WHERE state != 'idle' AND (now() - query_start) > interval '$SLOW_QUERY_MAX_SEC seconds';" > /dev/null send_unraid_notify "Maintenance" "Terminated $ZOMBIES zombie queries stalled over $SLOW_QUERY_MAX_SEC seconds in $CONTAINER." "warning" fi # 2. Connection Pool Monitoring CONNS=$(docker exec "$CONTAINER" psql -U "$DB_USER" -d "$DB_NAME" -t -c "SELECT count(*) FROM pg_stat_activity;" | xargs) [[ $CONNS =~ ^[0-9]+$ ]] || CONNS=0 if [ "$CONNS" -gt "$MAX_CONNS" ]; then log_event "WARNING" "High connection count in $CONTAINER: $CONNS / $MAX_CONNS" send_unraid_notify "High Load" "Database $CONTAINER connections ($CONNS) nearing capacity limits." "warning" fi # 3. Auto-Maintenance: Vacuum Analyze log_event "INFO" "Running background maintenance (Analyze) on $CONTAINER..." if ! docker exec "$CONTAINER" psql -U "$DB_USER" -d "$DB_NAME" -c "VACUUM ANALYZE;" > /dev/null 2>&1; then log_event "ERROR" "Maintenance (VACUUM ANALYZE) failed on $CONTAINER." send_unraid_notify "Maintenance Error" "Database $CONTAINER VACUUM ANALYZE failed." "warning" else log_event "INFO" "Database $CONTAINER vacuum maintenance completed successfully." fi done ### -------------------------------------------------------------------------------------- ### 3. VFS-SMART CACHE PRUNING AUDIT ### -------------------------------------------------------------------------------------- log_event "INFO" "VFS CACHE: Analyzing active mount settings..." # Detect the active VFS cache mode from the running rclone process RCLONE_PID=$(pgrep -f "rclone mount" | head -n1) if [ -n "$RCLONE_PID" ]; then VFS_MODE_DETECTED=$(ps -o args= -p "$RCLONE_PID" | grep -oE -- '--vfs-cache-mode [a-z]+' | awk '{print $2}') log_event "INFO" "VFS CACHE: Detected active VFS mode: '${VFS_MODE_DETECTED:-unknown}'" else VFS_MODE_DETECTED="unknown" log_event "WARNING" "VFS CACHE: No active rclone mount process found." fi # Apply targeted pruning behavior based on VFS mode if [[ "$VFS_MODE_DETECTED" "writes" ]] || [[ "$VFS_MODE_DETECTED" "minimal" ]]; then log_event "INFO" "VFS CACHE: Handing cache management to rclone's internal GC. Manual pruning skipped to protect active uploads." # Emergency warning check: If the SSD is critically full, alert the user instead of deleting files CURRENT_UTIL=$(df -P "$VFS_CACHE_DIR" | awk 'NR==2 {print $5}' | sed 's/%//') if [ "$CURRENT_UTIL" -gt 95 ]; then log_event "CRITICAL" "Samsung SSD is over 95% full ($CURRENT_UTIL%) under 'writes' mode! Uploads may stall." send_unraid_notify "CRITICAL: Storage Exhaustion" "VFS Cache Drive is critically full ($CURRENT_UTIL%). Manual pruning bypassed to protect uploads. Please inspect upload queues." "alert" fi elif [[ "$VFS_MODE_DETECTED" == "full" ]]; then if [[ -d "$VFS_CACHE_DIR/vfs" ]]; then log_event "INFO" "VFS CACHE: Initiating smart cache drive prune for 'full' read-cache..." TARGET_UTIL_PCT="${CACHE_DRIVE_MAX_UTILISATION%%%}" CURRENT_UTIL=$(df -P "$VFS_CACHE_DIR" | awk 'NR==2 {print $5}' | sed 's/%//') if [ "$CURRENT_UTIL" -gt "$TARGET_UTIL_PCT" ]; then log_event "INFO" "VFS CACHE: Utilization ($CURRENT_UTIL%) exceeds threshold ($TARGET_UTIL_PCT%). Purging oldest cache items..." find "$VFS_CACHE_DIR/vfs" -type f -printf '%T@ %p\n' | sort -n | cut -d' ' -f2- | while read -r file; do rm -f "$file" CURRENT_UTIL=$(df -P "$VFS_CACHE_DIR" | awk 'NR==2 {print $5}' | sed 's/%//') if [ "$CURRENT_UTIL" -le "$TARGET_UTIL_PCT" ]; then log_event "INFO" "VFS CACHE: Target utilization achieved ($CURRENT_UTIL%)." break fi done else log_event "INFO" "VFS CACHE: Utilization ($CURRENT_UTIL%) is safe under target ($TARGET_UTIL_PCT%)." fi fi else log_event "INFO" "VFS CACHE: Manual pruning skipped. Cache is either inactive or unmanaged." fi log_event "INFO" "--- HOURLY MAINTENANCE COMPLETE ---" exit 0 highlander-diagnostics-20260829-0348.zip
-
highlander-diagnostics-20260829-0128.zip It seems to happen when I'm running a script and Fix Common Problems is running at the same time????
-
Thanks for replying. I stopped using TTM as I saw that as well, but it's just happened again. Here's the new diagnostics The new file command hangs when I try to run it highlander-diagnostics-20260828-1643.zip
-
Hi, This week I keep losing access to my WebUI after a fresh start. Everything else seems to work - SSH, containers, VMs etc I just can't access the WebUI. It's only been like this for the last 48 hours. Diagnostics attached - can someone have a look please and see if they can spot the problem. Thanks in advance!highlander-diagnostics-20260828-1224.zip
-
I've never used Jellyfin so I'm not sure. line 160 is the line you'd need to update - basically triggering a Jellyfin scan if any files are deleted.
-
Sorry - it's taken me a while to get nzbget optimised and I'm short of time to try another service. I've had a quick peek at AltMount and it looks like you just need to mount it's webdav via rclone instead of nzbdav's. which bit are you stuck on?
-
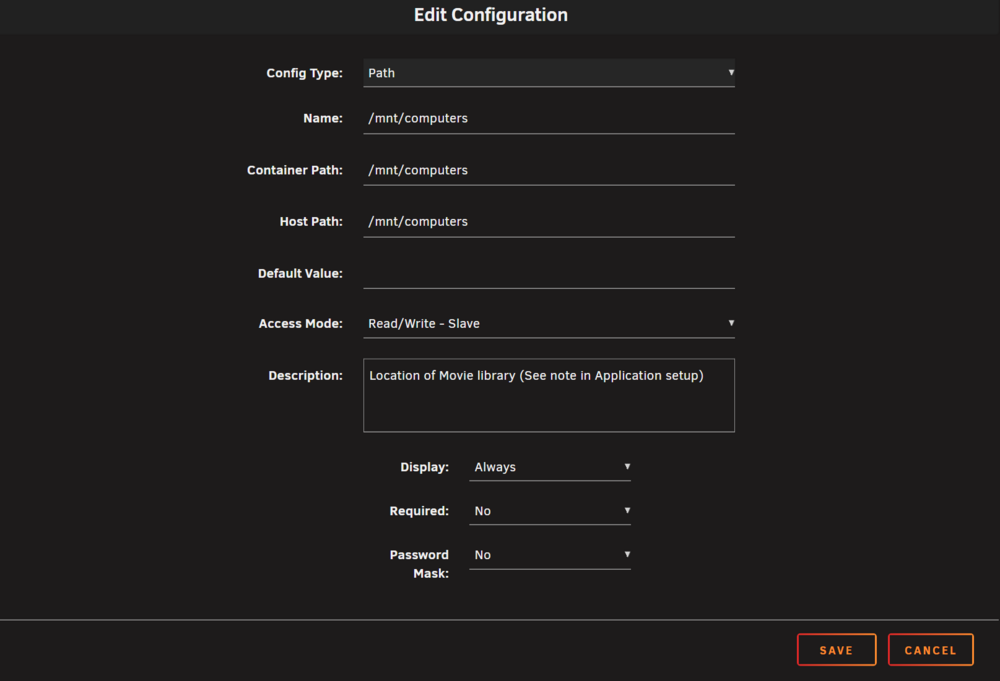
Post your radarr mappings. Post your docker mappings. Make sure the mapping to your mount uses R/W Slave:
-
I learnt the hard way not to use the orphaned files option as it removes all files not added yet to your library! Broken symlinks are more an issue with Decyoharr. NzbDAV's repair tool will eventually get there, but it could be weeks if your library is big e.g. around 50% of my library is still waiting to be checked
-
Yes - it's the library ID Yes - it means it found no broken links to delete.
-
it's considered more efficient as rclone can provide responses to e.g. the arrs
-
The guide was before NzbDAV included rclone rc support which allows long -dir-cache-time
-
what version of the script are you using? There was a version where I stupidly was testing --read-only in the mount command to try and fix some 403 errors in rclone which would cause this problem. I also added: --uid 99 --gid 100 --umask 000 \ to more recent versions to ensure rclone mounted the folders with the right permissions.
-
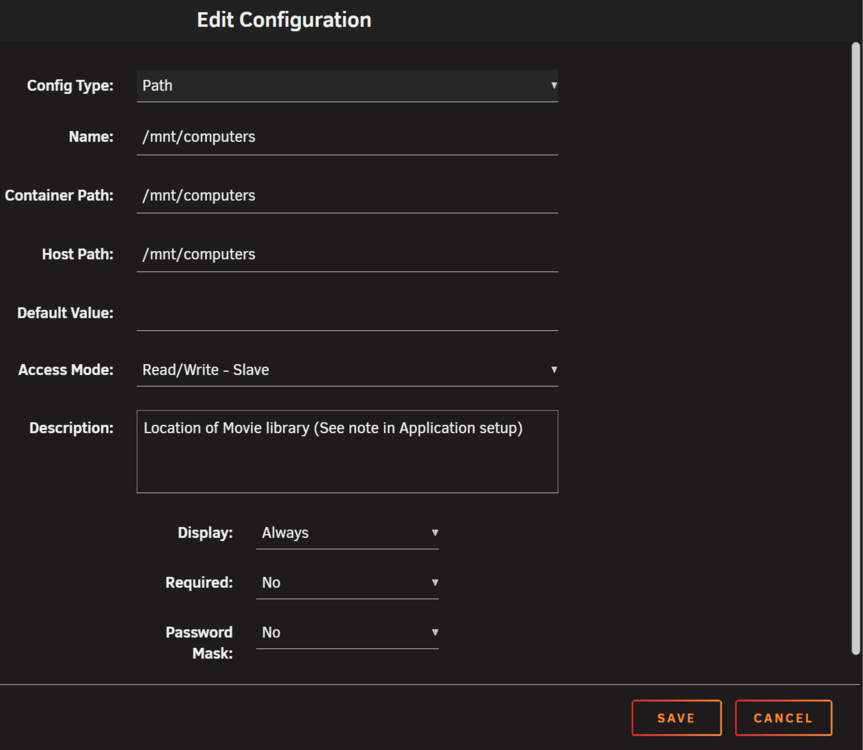
Try changing your radarr and other mappings pointing to the mount to R/W Slave which works better with mounts. Make sure you also have hardlinks turned on in Radarr
-
In the last logs it worked! On every run it does checks first to see if the mount is already up: [2026-05-15 23:32:25] CHECKING: NzbDAV Mount integrity... [2026-05-15 23:32:25] [!] NzbDAV process/mount missing. Bypassing patience window... [2026-05-15 23:32:25] [!] Failed: NzbDAV is DOWN. If down it remounts and then checks up to 5 times to see if it worked ok - I've found sometimes it can take a while for the mounts to settile. It checks for up to 30 seconds and moves on as soon as it works. Yours worked on the first attempt: [2026-05-15 23:32:25] REBUILD: Initiating In-Place Rclone recovery... [2026-05-15 23:32:27] Launching Rclone Mount... [2026-05-15 23:32:27] WAITING: Mount stabilizing (Attempt 1/5)... [2026-05-15 23:32:33] SUCCESS: Mount stabilized.
-
Great news. What did you do differently in your array start script as I use this one to do everyting - I just set it on a 3 min cron? How are you finding playback? With the settings I put as defaults I'm getting launches typically under 2-3 seconds, for non-4K content mostly before I can count to "one"!
-
yes you need to have the rclone plugin installed and to have used rclone config to create a WebDAV remote nzb-dav:
-
@impostrrlobstrr can you try the latest version I just uploaded as I realised myself when I had to temporarily disable Decypharr that the script failed. The new version is a lot simplier overall https://github.com/BinsonBuzz/unRAID-rclone-mounting-scripts-for-NzbDAV/blob/main/Scripts/Mount%20Script
-
3rd script added to the collection that scans for broken NzbDAV or Decypharr symlinks, deletes them, and tells the arrs to replace https://github.com/BinsonBuzz/unRAID-rclone-mounting-scripts-for-NzbDAV/blob/main/README.md
-
New version posted - with some helpful new features https://github.com/BinsonBuzz/unRAID-rclone-mounting-scripts-for-NzbDAV/tree/main ## Changelog: v1.5.2 → v1.5.11 Focused on making the script smarter and more resilient so it spends less time fixing things and more time staying out of the way. --- ### Key Improvements & Fixes * Smarter Recovery: The script now checks for specific subfolders to verify a mount is actually working, rather than just checking if the folder exists * Decypharr Stability: Added a "wait and retry" loop for Decypharr mounts. If it isn't ready immediately, the script will give it 10 chances to wake up before giving up * Safety First: Added a "Port Cleaner" that automatically clears blocked connections before attempting a remount, preventing "address already in use" errors * Notification Support: You will now get Unraid system notifications if a mount goes down or if a recovery is successful * Database Awareness: Full support for Postgres-based apps (like the *arrs) ensuring they are stopped and started in the correct order during a reset * Performance Monitoring: The summary report now tracks how many days of data your cache is holding and shows exactly how much of your cache drive is full * Better Resource Handling: Improved how the script handles high server loads to prevent it from accidentally making a slow system even slower --- ### What’s New in the Summary? The bottom of the log now gives a one-line "health check" showing: * Mount Age: How long your mounts have been stable * Cache Health: Total files primed, cache disk usage %, and data retention days * System Vital Signs: Current server load and available RAM


