tehtide

Members
  • Posts

    25
  • Joined

  • Last visited

Everything posted by tehtide

  1. I've got both networks in there. I'm able to ping the deluge docker VPN from both networks, but radarr/sonarr won't connect to the json feed if they are on the same network. Unknown exception: The operation has timed out.: 'http://10.10.50.22:8112/json'
  2. OK I'm having another strange issue. I'm moving my setup over to vlans and I currently have a vlan that is for all my dockers on my server. When I put this docker on the vlan br.50, no other dockers on that vlan can communicate with it. IE radarr or sonarr. However if I move radarr or sonarr back to br0 then they will communicate. I'd really like to get these all on the same vlan to keep things simple. Any idea why this is happening?
  3. OK so use by reverting to 6.8.1 I've had no more issues with kernel panics. So is there anything in 6.8.2 that would have changed to cause issues? And would I be better off sitting at 6.8.1 or jump to 6.8.3?
  4. The only dockers I have running right now are on br0 with custom IP's. Is that a support configuration? Should I drop everything back to bridge mode and see if that is the issue? Or is there something else going on here? Thanks!
  5. OK so this takes about 5~ days to crash everytime. I've stopped every Docker and just had another crash. This is a Dell R530. Dual Intel(R) Xeon(R) CPU E5-2630 v3 @ 2.40GHz 64GB DDR-4 ECC Memory Embedded NIC is Broadcom Gigabit Ethernet BCM5720 Disks are a mix of 4 and 8 TB. I've run the Dell Diagnostics and all the memory checked out fine. There were no issues detected in the HW scan. I've been running UnRAID on this for almost a year now. Troubles seems to have started just a few weeks ago. I'm going to roll back to 6.8.1 and see if that helps. Anything else I can provide to help out? This seems to be one of the kernel panics. It seems to be revolving around the macvlan stuff maybe? Feb 25 12:14:09 Coruscant kernel: WARNING: CPU: 16 PID: 6741 at net/netfilter/nf_conntrack_core.c:945 __nf_conntrack_confirm+0xa0/0x69e Feb 25 12:14:09 Coruscant kernel: Modules linked in: macvlan xt_CHECKSUM ipt_REJECT ip6table_mangle ip6table_nat nf_nat_ipv6 iptable_mangle ip6table_filter ip6_tables vhost_net tun vhost tap veth xt_nat iptable_filter xfs nfsd lockd grace sunrpc md_mod iptable_nat ipt_MASQUERADE nf_nat_ipv4 nf_nat ip_tables wireguard ip6_udp_tunnel udp_tunnel bonding tg3 sr_mod cdrom mxm_wmi sb_edac x86_pkg_temp_thermal intel_powerclamp coretemp kvm_intel kvm crct10dif_pclmul crc32_pclmul crc32c_intel ghash_clmulni_intel pcbc aesni_intel aes_x86_64 crypto_simd cryptd glue_helper intel_cstate intel_uncore intel_rapl_perf ipmi_ssif i2c_core ahci megaraid_sas libahci ipmi_si wmi pcc_cpufreq button acpi_power_meter [last unloaded: tg3] Feb 25 12:14:09 Coruscant kernel: CPU: 16 PID: 6741 Comm: kworker/16:0 Not tainted 4.19.98-Unraid #1 Feb 25 12:14:09 Coruscant kernel: Hardware name: Dell Inc. PowerEdge R530/03XKDV, BIOS 2.7.1 01/26/2018 Feb 25 12:14:09 Coruscant kernel: Workqueue: events macvlan_process_broadcast [macvlan] Feb 25 12:14:09 Coruscant kernel: RIP: 0010:__nf_conntrack_confirm+0xa0/0x69e Feb 25 12:14:09 Coruscant kernel: Code: 04 e8 56 fb ff ff 44 89 f2 44 89 ff 89 c6 41 89 c4 e8 7f f9 ff ff 48 8b 4c 24 08 84 c0 75 af 48 8b 85 80 00 00 00 a8 08 74 26 <0f> 0b 44 89 e6 44 89 ff 45 31 f6 e8 94 f1 ff ff be 00 02 00 00 48 Feb 25 12:14:09 Coruscant kernel: RSP: 0018:ffff88885fa03d58 EFLAGS: 00010202 Feb 25 12:14:09 Coruscant kernel: RAX: 0000000000000188 RBX: ffff888570f1d300 RCX: ffff8883e36396d8 Feb 25 12:14:09 Coruscant kernel: RDX: 0000000000000001 RSI: 0000000000000001 RDI: ffffffff81e08fcc Feb 25 12:14:09 Coruscant kernel: RBP: ffff8883e3639680 R08: 000000006547e895 R09: ffffffff81c8a9c0 Feb 25 12:14:09 Coruscant kernel: R10: 0000000000000158 R11: ffffffff81e91140 R12: 000000000000fa73 Feb 25 12:14:09 Coruscant kernel: R13: ffffffff81e91140 R14: 0000000000000000 R15: 0000000000004da5 Feb 25 12:14:09 Coruscant kernel: FS: 0000000000000000(0000) GS:ffff88885fa00000(0000) knlGS:0000000000000000 Feb 25 12:14:09 Coruscant kernel: CS: 0010 DS: 0000 ES: 0000 CR0: 0000000080050033 Feb 25 12:14:09 Coruscant kernel: CR2: 00001490681a8000 CR3: 0000000001e0a001 CR4: 00000000001606e0 Feb 25 12:14:09 Coruscant kernel: Call Trace: Feb 25 12:14:09 Coruscant kernel: <IRQ> Feb 25 12:14:09 Coruscant kernel: ipv4_confirm+0xaf/0xb9 Feb 25 12:14:09 Coruscant kernel: nf_hook_slow+0x3a/0x90 Feb 25 12:14:09 Coruscant kernel: ip_local_deliver+0xad/0xdc Feb 25 12:14:09 Coruscant kernel: ? ip_sublist_rcv_finish+0x54/0x54 Feb 25 12:14:09 Coruscant kernel: ip_sabotage_in+0x38/0x3e Feb 25 12:14:09 Coruscant kernel: nf_hook_slow+0x3a/0x90 Feb 25 12:14:09 Coruscant kernel: ip_rcv+0x8e/0xbe Feb 25 12:14:09 Coruscant kernel: ? ip_rcv_finish_core.isra.0+0x2e1/0x2e1 Feb 25 12:14:09 Coruscant kernel: __netif_receive_skb_one_core+0x53/0x6f Feb 25 12:14:09 Coruscant kernel: process_backlog+0x77/0x10e Feb 25 12:14:09 Coruscant kernel: net_rx_action+0x107/0x26c Feb 25 12:14:09 Coruscant kernel: __do_softirq+0xc9/0x1d7 Feb 25 12:14:09 Coruscant kernel: do_softirq_own_stack+0x2a/0x40 Feb 25 12:14:09 Coruscant kernel: </IRQ> Feb 25 12:14:09 Coruscant kernel: do_softirq+0x4d/0x5a Feb 25 12:14:09 Coruscant kernel: netif_rx_ni+0x1c/0x22 Feb 25 12:14:09 Coruscant kernel: macvlan_broadcast+0x111/0x156 [macvlan] Feb 25 12:14:09 Coruscant kernel: ? __switch_to_asm+0x41/0x70 Feb 25 12:14:09 Coruscant kernel: macvlan_process_broadcast+0xea/0x128 [macvlan] Feb 25 12:14:09 Coruscant kernel: process_one_work+0x16e/0x24f Feb 25 12:14:09 Coruscant kernel: worker_thread+0x1e2/0x2b8 Feb 25 12:14:09 Coruscant kernel: ? rescuer_thread+0x2a7/0x2a7 Feb 25 12:14:09 Coruscant kernel: kthread+0x10c/0x114 Feb 25 12:14:09 Coruscant kernel: ? kthread_park+0x89/0x89 Feb 25 12:14:09 Coruscant kernel: ret_from_fork+0x35/0x40 Feb 25 12:14:09 Coruscant kernel: ---[ end trace 949816e8afd00bfc ]--- This week I also plan on upgrading the server BIOS etc... to get everything up to snuff as well.
  6. Just crashed again overnight. Kernel panic. Attached is the syslog. I rebooted it around 09:00 am... there doesn't seem to be anything in there. I've also included the diagnostics file as well.coruscant-diagnostics-20200225-0932.zipsyslog-10.10.20.10.log Anything else I can try?
  7. OK thanks. I enabled it... hopefully it'll catch something.
  8. It appears that I'm having sporadic crashing/kernel panic issues on my 6.8.2 installation. This is a Dell R530. No response to ping, to ability to ssh and the console was locked up. I did take a picture of the screen before powering off the server and powering it back on. I ran the Dell diagnostics and nothing came back as bad in the hardware. Any logs or anything I can enable to capture the full panic for help in troubleshooting? Anything I can post after a reboot to capture the issue?
  9. I've got a Dell R530 that seems to be locking/crashing. The server is not pingable and the console is unresponsive. Attached is a screen shot from the server.... not sure if it is useful or not. Only way to get it back is a hard boot. Are there any logs I can send after this that will help? I'm going to run Dells hardware diagnostics to make sure I don't have a memory issue etc... Anything else I can try?
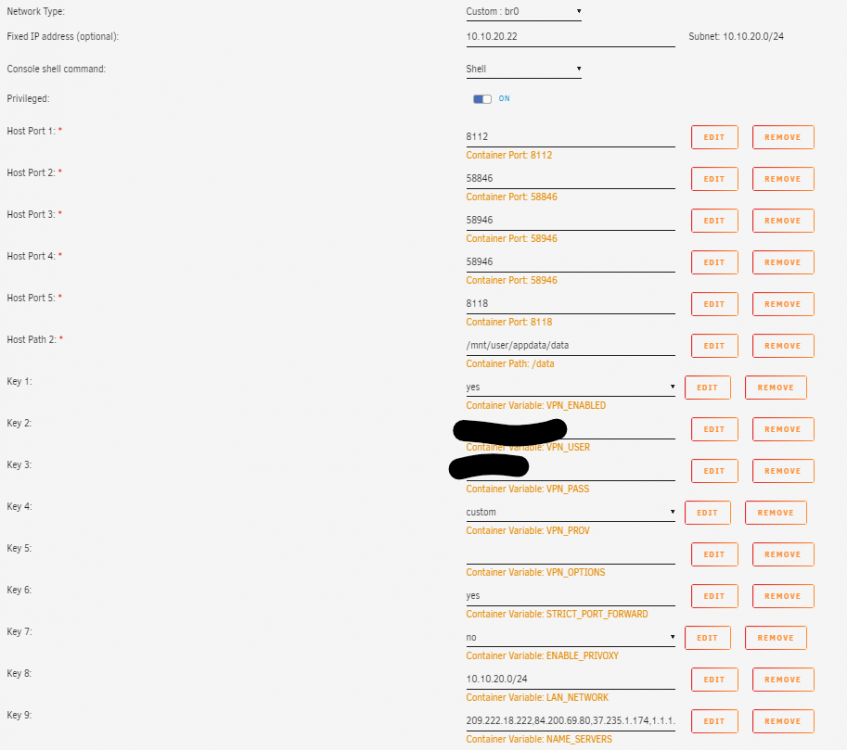
  10. I'm having an issue with radarr and sonarr connecting to this container. It had been working, but now I cannot get radarr and sonarr to connect to deluge. In both sonarr and radarr I'm getting the following error: Unknown exception: The operation has timed out.: 'http://10.10.20.22:8112/json' If I look into the logs for radarr and sonarr this is what I'm seeing: [Error] Deluge: The operation has timed out.: 'http://10.10.20.22:8112/json' [v0.2.0.1450] System.Net.WebException: The operation has timed out.: 'http://10.10.20.22:8112/json' ---> System.Net.WebException: The operation has timed out. at System.Net.HttpWebRequest.GetRequestStream () [0x00016] in <91935ad653254a93b9d73a9f8f2f7a2d>:0 at NzbDrone.Common.Http.Dispatchers.ManagedHttpDispatcher.GetResponse (NzbDrone.Common.Http.HttpRequest request, System.Net.CookieContainer cookies) [0x000ef] in C:\projects\radarr-usby1\src\NzbDrone.Common\Http\Dispatchers\ManagedHttpDispatcher.cs:76 --- End of inner exception stack trace --- at NzbDrone.Common.Http.Dispatchers.ManagedHttpDispatcher.GetResponse (NzbDrone.Common.Http.HttpRequest request, System.Net.CookieContainer cookies) [0x001cf] in C:\projects\radarr-usby1\src\NzbDrone.Common\Http\Dispatchers\ManagedHttpDispatcher.cs:113 at NzbDrone.Common.Http.Dispatchers.FallbackHttpDispatcher.GetResponse (NzbDrone.Common.Http.HttpRequest request, System.Net.CookieContainer cookies) [0x000cc] in C:\projects\radarr-usby1\src\NzbDrone.Common\Http\Dispatchers\FallbackHttpDispatcher.cs:60 at NzbDrone.Common.Http.HttpClient.ExecuteRequest (NzbDrone.Common.Http.HttpRequest request, System.Net.CookieContainer cookieContainer) [0x0007e] in C:\projects\radarr-usby1\src\NzbDrone.Common\Http\HttpClient.cs:121 at NzbDrone.Common.Http.HttpClient.Execute (NzbDrone.Common.Http.HttpRequest request) [0x00008] in C:\projects\radarr-usby1\src\NzbDrone.Common\Http\HttpClient.cs:57 at NzbDrone.Core.Download.Clients.Deluge.DelugeProxy.AuthenticateClient (NzbDrone.Common.Http.JsonRpcRequestBuilder requestBuilder, NzbDrone.Core.Download.Clients.Deluge.DelugeSettings settings, System.Boolean reauthenticate) [0x0005b] in C:\projects\radarr-usby1\src\NzbDrone.Core\Download\Clients\Deluge\DelugeProxy.cs:284 at NzbDrone.Core.Download.Clients.Deluge.DelugeProxy.BuildRequest (NzbDrone.Core.Download.Clients.Deluge.DelugeSettings settings) [0x0006b] in C:\projects\radarr-usby1\src\NzbDrone.Core\Download\Clients\Deluge\DelugeProxy.cs:197 at NzbDrone.Core.Download.Clients.Deluge.DelugeProxy.ProcessRequest[TResult] (NzbDrone.Core.Download.Clients.Deluge.DelugeSettings settings, System.String method, System.Object[] arguments) [0x00000] in C:\projects\radarr-usby1\src\NzbDrone.Core\Download\Clients\Deluge\DelugeProxy.cs:204 at NzbDrone.Core.Download.Clients.Deluge.DelugeProxy.GetVersion (NzbDrone.Core.Download.Clients.Deluge.DelugeSettings settings) [0x00000] in C:\projects\radarr-usby1\src\NzbDrone.Core\Download\Clients\Deluge\DelugeProxy.cs:53 at NzbDrone.Core.Download.Clients.Deluge.Deluge.TestConnection () [0x00000] in C:\projects\radarr-usby1\src\NzbDrone.Core\Download\Clients\Deluge\Deluge.cs:188 Attached is the screenshot of the deluge settings. I'm using NORDVpn. If I turn off STRICT_PORT_FORWARD it doesn't change, however if I turn off the VPN in the deluge container then I can connect. Any ideas?
  11. OK... so I'm sure that it is somewhere I just can't find it. How can I use the letsencrypt docker to provide a certificate for this docker so when I connect via my private side chrome on a Mac will allow me to connect? It is setup for a self signed right now I'd rather use a good certificate so that things are proper. Thanks!
  12. OK... so after a day of messing with everything, I finally figured it out. I have squid installed on my PFSense router and didn't exclude the ip range that the unraid server is on. I excluded that range and I'm all good now. Thanks for the patience and all the help
  13. If I connect to the same vlan as the server it is fine. But anything else it's a no go... unless it is via VPN, which is strange. No AV, no nothing. This happens on two different devices as well.
  14. So the two networks are LAN and WIFI. Rules for the LAN VLAN Rules for the WiFi VLAN Pretty basic... but firewalls aren't my forte. Anything showing up as horribly wrong? I can ping and access everything else between those two networks including dockers etc... there is just something with the webservice traffic that is getting dropped or blocked somewhere.
  15. OK... so it seems that if I connect to the vlan that the unraid server is on this works properly. But if I connect to a different VLAN the web terminal doesn't work. I'm using pfsense as my router/firewall and nothing else seems to be blocked. Any ideas?
  16. Understood. Issue occurs on Chrome and Firefox on a Mac. Tomorrow I'll have access to a widows machine and I can test from that as well.
  17. Rebooted server and client. No dice. Still a black screen when clicking the console link on the main header, or any of the console links for any of the dockers.
  18. I've not done that yet. I was hoping to be able to do something without rebooting the server. I'll try that tonight and see if that changes anything.
  19. So I've got a strange issue and I'm hoping someone has some guidance. The web terminal/console link in Unraid 6.7.2 has stopped working. When I click on it I get a new tab, but it is all black with just ttyd - Terminal at the popup title. Nothing else. This seems to effect docker consoles as well because none of those are working either. I couldn't get any error to show up in Chrome developer, but in firefox I get this error: Firefox can’t establish a connection to the server at ws://10.10.20.10/webterminal/ws. webterminal:1:294635 Websocket connection closed with code: 1006 This happens in Chrome, Firefox and Safari. Any ideas? Somewhere to start looking? Attached are my diagnostics for the server. Thanks in advance coruscant-diagnostics-20190813-0011.zip
  20. Thanks for the help. I added a cache drive and cross my fingers I've not had an issue in almost 24 hours.
  21. That's what I was afraid of... OK I'll work on that. I don't have a cache drive setup yet as I'm migrating over from an old homebrew ubuntu system and don't have a drive available for a cache yet. Are there any other possible work arounds?
  22. I'm just switching over to Unraid and have deployed this docker as well as the Sonarr docker and I'm having similar issues in both. After running the docker image for a while, I start to get errors in the log: [Error] TaskExtensions: Task Error [v2.0.0.5322] System.Data.SQLite.SQLiteException (0x80004005): database disk image is malformed database disk image is malformed Sometimes if I restart the docker the issues disappears, but other times it persists and I have to restore a backup. Needless to say this is quite annoying as this will blow up the queue, movie database etc... Is there a fix for this? Anything I need to tweak/change?