






falconexe
Community Developer
-
Joined
Everything posted by falconexe
-
Out of curiosity, what "things" were taken for granted? I really want to improve this as much as possible. Note: I did point everyone to GilbN's great tutorial off of his website. Take a look at that and let me know if there are any things I need to add to my topic. Keep in mind, my topic just shows Dependencies and has SOME setup. I assume that if you are looking into Grafana, you have some basic understanding of what it is/does. https://technicalramblings.com/blog/how-to-setup-grafana-influxdb-and-telegraf-to-monitor-your-unraid-system/ Perhaps I need to do a full blown install instructions?

-
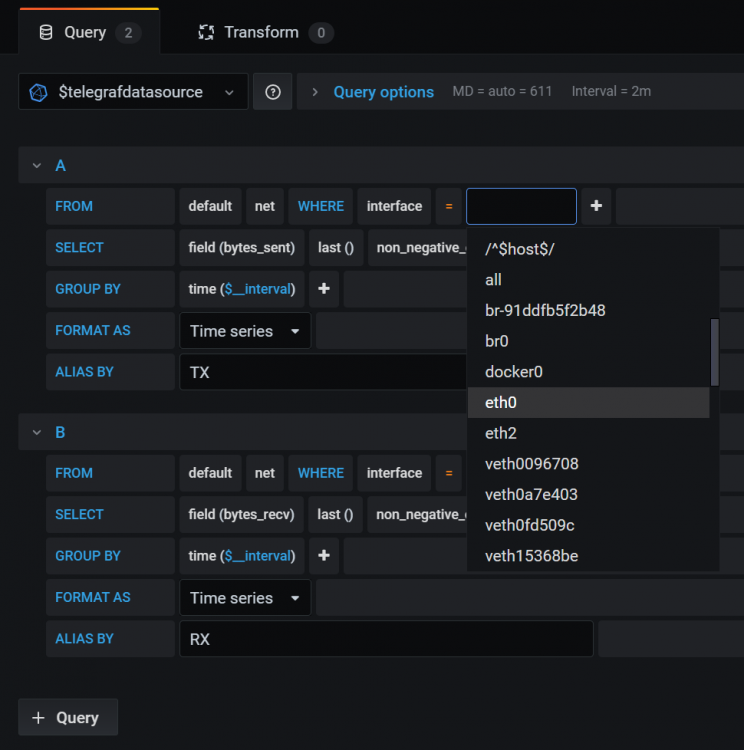
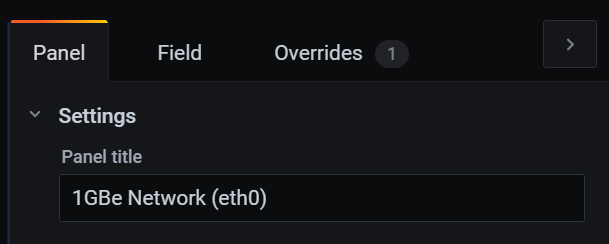
Again, you'll need to adjust to your hardware. You'll have to pick the correct NIC(s) in ALL of the network related queries, and then you'll need to adjust the Panel TITLE to reflect what you picked.
-
The UUD comes out of the box with a 2 CPU setup. You just need to delete the "CPU 02" panel if you are only running 1 CPU. The REGEX will need to be adjusted, or you can manually select your cores on "CPU 01". Please go back and re-read the topic. A few pages back, I helped another user with this exact issue and showed him how to fix it manually. I'll see if I can find link for you... EDIT: Here is the post where I teach how to manually add cores. Click the arrow in the upper right...

-
First off, congrats on getting this far! Please keep in mind, AND THIS GOES FOR EVERYONE, that on Post #1 I clearly state the following: You just finished PHASE 1, which is getting the dang thing installed and having a baseline. You now NEED to start PHASE 2, which is configuring the Dashboard for YOUR HARDWARE. The UUD provides all of the tools for a maxed out system, like mine, so we can have a broad brush to encompass all manner of UNRAID systems. IF you don't have a feature, you can simply delete/adjust the panel(s) as required to suite your own needs. Due to the nature of what this thing is, and the millions of users out there, it would be impossible for the UUD to be released already knowing exactly what is on a user's system. That is why we use REGEX to attempt this, but you still need to adjust that sometimes. So you can either adjust the REGEX or go the old fashioned way and manually add your stuff to the queries and remove the REGEX. I highly recommend you, and anyone else having similar concerns, spend some time and read this ENTIRE topic. I have covered many of these items extensively with instructions, code, and screenshots. I'm starting to see a pattern where new users install UUD, and have the same issues over and over. I've been happy to help thus far, but it is taking a lot of my time supporting, instead of actually developing new features. Note: This is not anything to do with you personally, I'm just using this post as an opportunity to educate. I'm hoping to empower those that use UUD with knowledge, so they can help themselves as much as possible. Just like I learned, everyone who uses UUD will have to get familiar with the basics. This is extremely powerful, but you have to know some things about it to use that power. Less than a month ago, I knew absolutely ZERO about this, now I am here writing this...😃

-
Hmm, that is a weird one. I've gone thought he CA backup process and have not seen that. I assume if you refresh, or close/reopen the window, it remains? I'm sure you are already doing this, but one thought is to make sure that all 3 Dockers (Grafana/Telegraf/InfluxDB) are all set to auto restart. The way I acomplish this is defining an Extra Parameter in each Docker of "--restart=always". Or you can use the buttons to auto restart in the UNRAID GUI. If this issue still persists after refreshing/reopening Grafana, try closing the browsers, clearing your cache/cookies, and reload. Report back. My next backup is Monday at 5AM.

-
Nice. Not sure why all your drives aren't showing up, all 33 of mine do. We can look more into this over the weekend. I have to get back to work. Later brother. EDIT: Thanks for finding that typo (from your DM). I'll get that fixed in version 1.4. Congrats, you are now an Official UUD CONTRIBUTOR (You are now listed as such on Post #1) 🤝🥳
-
👍
-
Click Right HERE (better yet, just click that diagonal arrow in the upper right)

-
Page 10. Look for the green code...
-
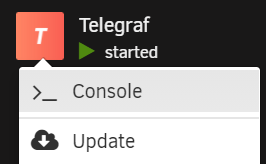
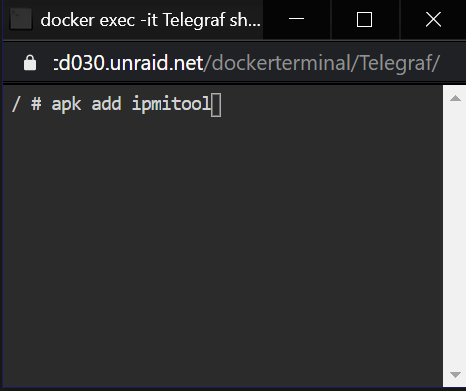
You can run that bash command via the UNRAID terminal, or right click the docker and click console and skip the front part of those commands, to initially install the addon plugins. Keep in mind, that unless the Post Arguments (matching all plugins you have added and updated) are in place, if you update the Telegraf docker, all that stuff will not persist. So it is really important. /bin/sh -c 'apk update && apk upgrade && apk add ipmitool && apk add smartmontools && telegraf' Glad drive life makes sense now.

-
HA HA. I just sit here watching this thread. I'm freakin addicted.😆
-
And now back to my day job (well now it's night, so yeah, gotta spend less time on UUD 🤣)
-
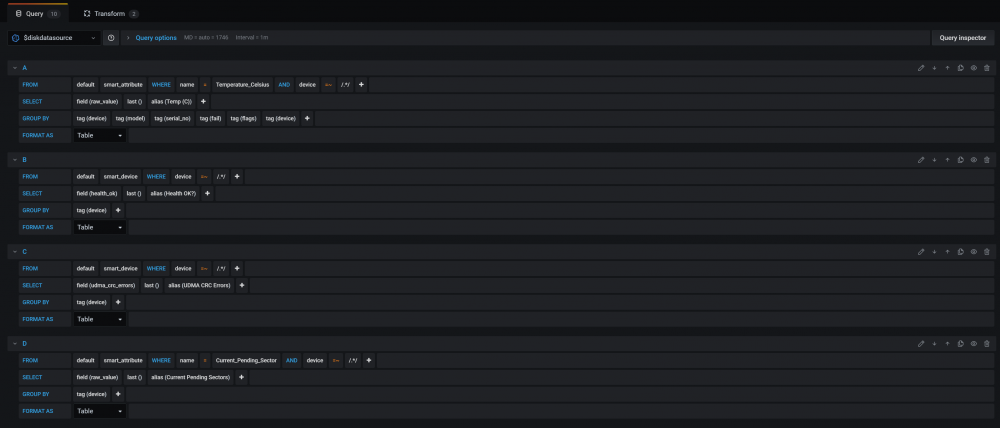
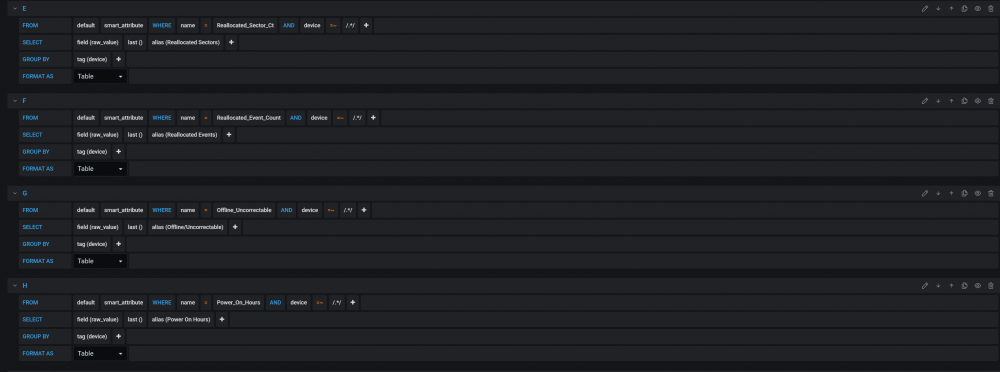
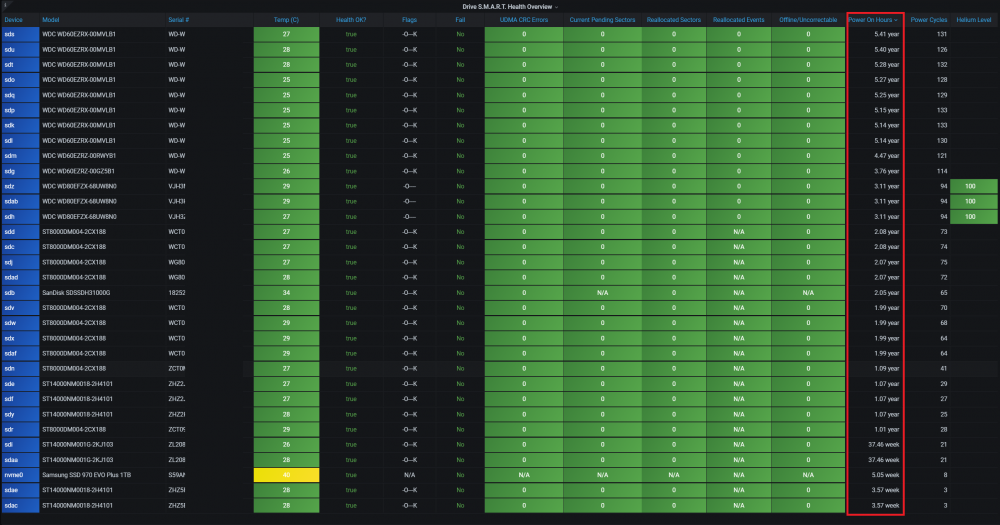
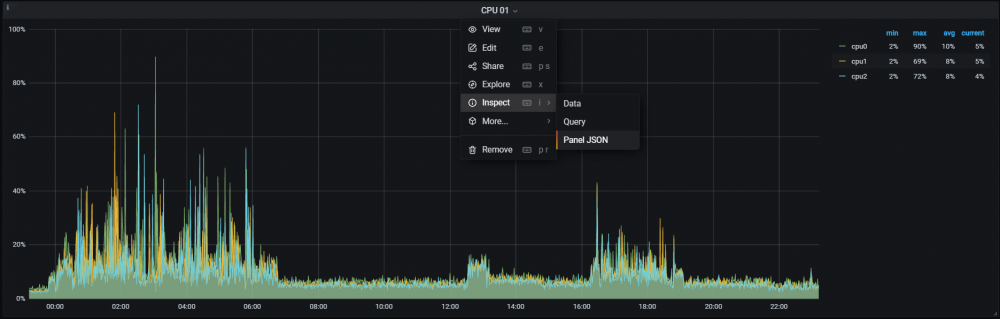
Let's unpack this real quick. One at a time. So did you add the plugin and configure the Docker Post Arguments (See Post #1). This is separate from the Telegraf Config. That would prevent S.M.A.R.T. from displaying correctly. BUT....My money says it's the query. Your query DOES NOT look anything like the one I released in Version 1.3. This is one of the most complex queries in the dashboard. See Below: So step one, get that fixed. If you need the JSON code just for that one panel, let me know. A few pages back I explained to someone else how to update JSON for a single panel so that will save you a bunch of time. I'd paste it here, but it is a few hundred lines (1,169).... OH what the heck, here it is in a txt file. You know what to do (if you read that previous post). Right Click the Panel > Inspect > Panel JSON 👍 Drive S.M.A.R.T. Health Overview The Drive Life is an Aggregate of the Power On Hours from the the S.M.A.R.T. panel above (which you can't see). Just a fun panel for stat junkies. So yes, this is by design. I like seeing the youngest/oldest drives and the fact that they have been running for a combined 80+ years in my case is hilarious. 😅 Report Back.


-
Ha ha. You're welcome. Are you using "Grafana Unraid Stack" (GUS) too? If so, that is the work of @testdasi. The UUD was created by me and inspired by @GilbN's original template. So really it is 3 people coming together randomly for the masses. @falconexe Primary UUD Developer (Me) @GilbN Co UUD Developer @testdasi Primary GUS Developer Recently testdasi incorporated the UUD into GUS (with my permission), so yeah, I guess it is all of us now in a way 😂. GUS wasn't even a thing when I first developed this a few weeks back, at least I didn't know about it until recently. The timing of this is crazy, because I was just focused on the actual UUD Dashboard. GUS was a separate effort to make the install process easier. Anywho, it is pretty cool that we all went nuts around he same time and the stars aligned for everyone. Yeah, this whole thing is awesome. I'll keep working to make UUD better. testdasi will need to keep updating GUS with my latest versions for this all to stay in sync! So UUDGUS or GUSUUD? 😆 Glad you are loving it. Makes the long nights worth it. 🤜🤛

-
Plex/Varken is coming... Possibly Planned For 1.5
-
Makes Sense. Done. This will be released in Version 1.4. Congrats, you are now an Official UUD CONTRIBUTOR (You are now listed as such on Post #1) 🤝🥳

-
Hey Everyone. Just wanted to let you know that I heavily updated the Dependencies section in Post #1 to be more detailed and easier to follow. If you are old or new, please have a look. In release 1.4, I will officially be adding support for the "Sensors" plugin as an alternate to IPMI for those that run on non server hardware. This will provide an alternate source for CPU/System/Auxiliary temps. Stay tuned...
-
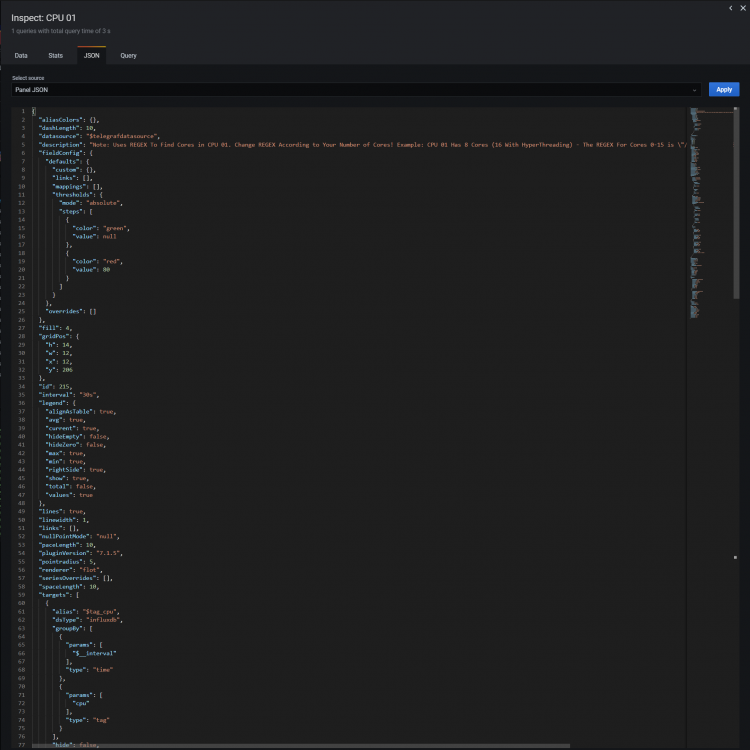
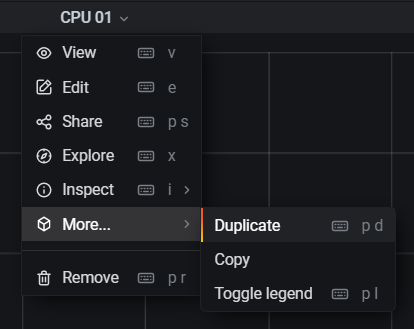
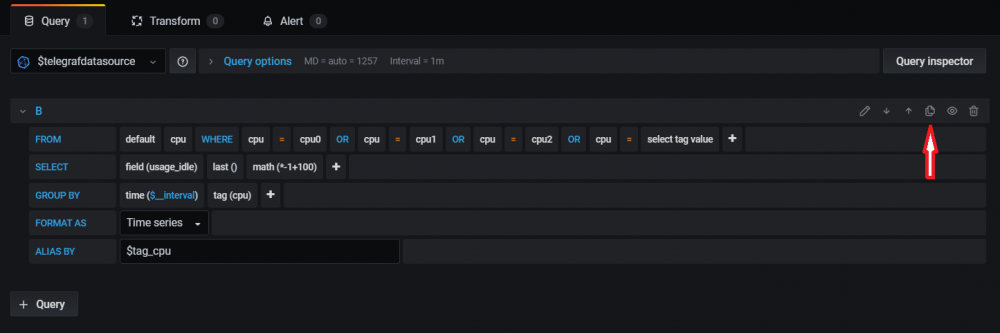
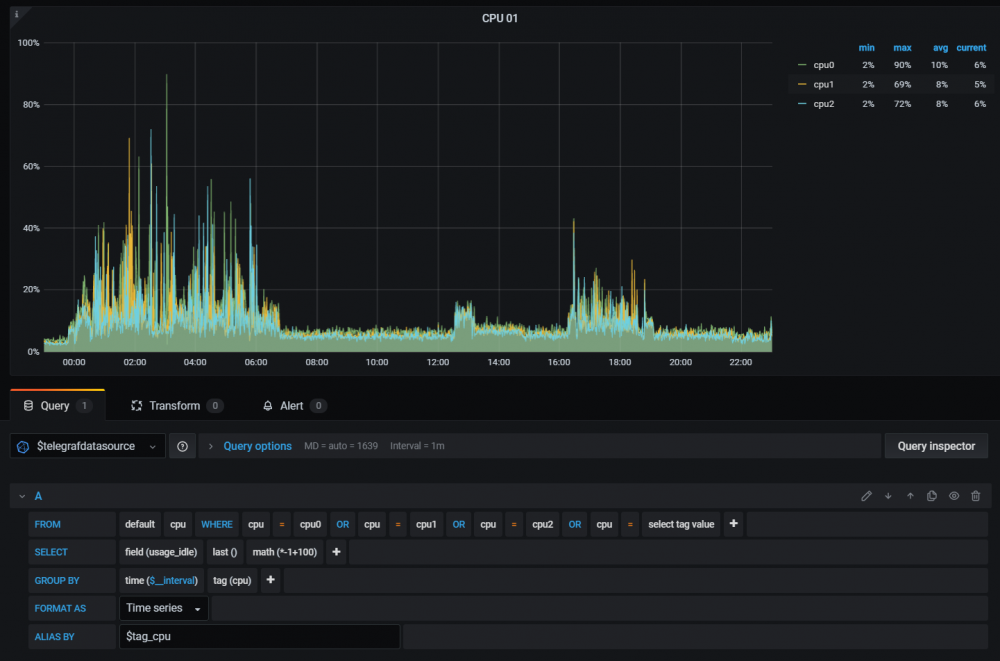
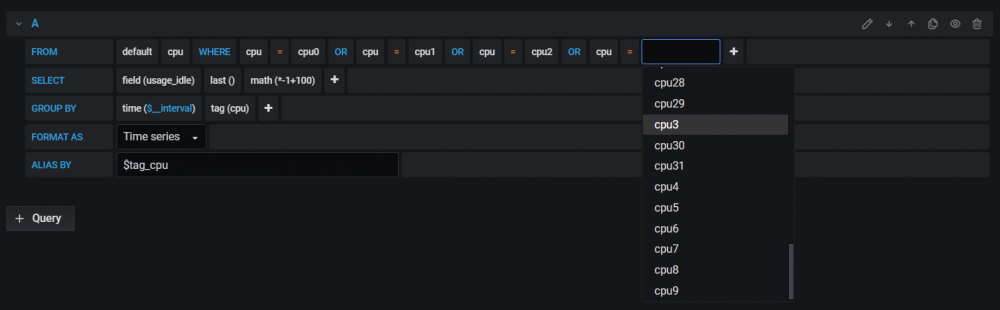
@shwa87 Just wanted to point out that if you want to get this done in a quick and dirty way, you can always go the manual route. Some users prefer that explicit control over their dashboard. I know I did when I made version 1.0 and even had stuff still hard coded in version 1.1. I didn't start adding REGEX until version 1.2 (at GilbN's suggestion). Using REGEX allows the UUD to be dynamic and work on almost any system. However, there is nothing wrong with taking this dashboard and modding the crap out of it to your liking and needs. I encourage it. That's how you learn! So, just do this if you want to take a hard pass on REGEX 😂 Edit the query as shown below, and Click on "Select Tag Value" to select your desired core in the drop down. Hit the + button to add new CPU cores. Always change the logic to OR as it defaults to AND. You want any of these cores (OR). You can't select ALL of these cores (AND) because no one core has ALL of those names. It has to do with database Boolean Operators/NAND logic. After clicking on "select tag value" If you want to just use this now, paste the following code into the Panel JSON and save. Copy the GREEN Code Below. Select All and Delete the Original JSON Code. Paste my JSON Code. Click Apply. And Viola! (Before you do this, save your dashboard so you can revert if something goes wrong). NON-REGEX CPU 01 Code Below: { "aliasColors": {}, "dashLength": 10, "datasource": "$telegrafdatasource", "description": "Note: This is a special CPU panel written especially for shwa87!", "fieldConfig": { "defaults": { "custom": {}, "links": [], "mappings": [], "thresholds": { "mode": "absolute", "steps": [ { "color": "green", "value": null }, { "color": "red", "value": 80 } ] } }, "overrides": [] }, "fill": 4, "gridPos": { "h": 14, "w": 12, "x": 12, "y": 206 }, "id": 215, "interval": "30s", "legend": { "alignAsTable": true, "avg": true, "current": true, "hideEmpty": false, "hideZero": false, "max": true, "min": true, "rightSide": true, "show": true, "total": false, "values": true }, "lines": true, "linewidth": 1, "links": [], "nullPointMode": "null", "paceLength": 10, "pluginVersion": "7.1.5", "pointradius": 5, "renderer": "flot", "seriesOverrides": [], "spaceLength": 10, "targets": [ { "alias": "$tag_cpu", "dsType": "influxdb", "groupBy": [ { "params": [ "$__interval" ], "type": "time" }, { "params": [ "cpu" ], "type": "tag" } ], "hide": false, "measurement": "cpu", "orderByTime": "ASC", "policy": "default", "refId": "A", "resultFormat": "time_series", "select": [ [ { "params": [ "usage_idle" ], "type": "field" }, { "params": [], "type": "last" }, { "params": [ "*-1+100" ], "type": "math" } ] ], "tags": [ { "key": "cpu", "operator": "=", "value": "cpu0" }, { "condition": "OR", "key": "cpu", "operator": "=", "value": "cpu1" }, { "condition": "OR", "key": "cpu", "operator": "=", "value": "cpu2" }, { "condition": "OR", "key": "cpu", "operator": "=", "value": "select tag value" } ] } ], "thresholds": [], "timeRegions": [], "title": "CPU 01", "tooltip": { "shared": true, "sort": 2, "value_type": "individual" }, "type": "graph", "xaxis": { "buckets": null, "mode": "time", "name": null, "show": true, "values": [] }, "yaxes": [ { "$$hashKey": "object:8009", "decimals": null, "format": "percent", "label": null, "logBase": 1, "max": "100", "min": null, "show": true }, { "$$hashKey": "object:8010", "format": "short", "label": null, "logBase": 1, "max": null, "min": null, "show": false } ], "yaxis": { "align": false, "alignLevel": null }, "bars": false, "dashes": false, "fillGradient": 0, "hiddenSeries": false, "percentage": false, "points": false, "stack": false, "steppedLine": false, "timeFrom": null, "timeShift": null } Once you have the CPU 01 panel dialed in, simply duplicate the panel, and then swap out the cores for CPU 02. Remember cores are listed in an array, so they start at 0 and end 1 less than the total number of cores you have. So my 16 core machine is 0-7, 8-15. Adjust to your 8 core machine (0-3, 4-7). To Duplicate An Entire Panel Click This: To Duplicate a Query Within a Panel Click This: That's all for today's lesson. 🤣
-
That will do it ha ha. Been there, done that (in my earlier UNRAID days). It happens. I always go rm -rfv (be careful...) the old appdata folder once I delete a docker for this very reason. Also helps if you want to use the same Docker name in the future. That way your not messing with the old folder. Really glad you finally got this to work. Happy for you man. My goal with creating the UUD was to empower the masses with an easy, sexy, and out of the box solution (as much as possible). We are getting a ton of great feedback across the world where people are finally getting back into Grafana, or just now realizing this is possible. It's a great feeling to know people actually like your work and are excited about it as much as we are! 😄
-
@shwa87 are you on the UNRAID Discord? We may need to get real time with this LOL. What exact make/model is your UPS? Please post a screenshot of your UNRAID GUI UPS screen. Did you add the POST ARGUMENTS to the Telegraf Docker, AND RESTART all 3 Dockers? @testdasi any thoughts as he is using your GUS?
-
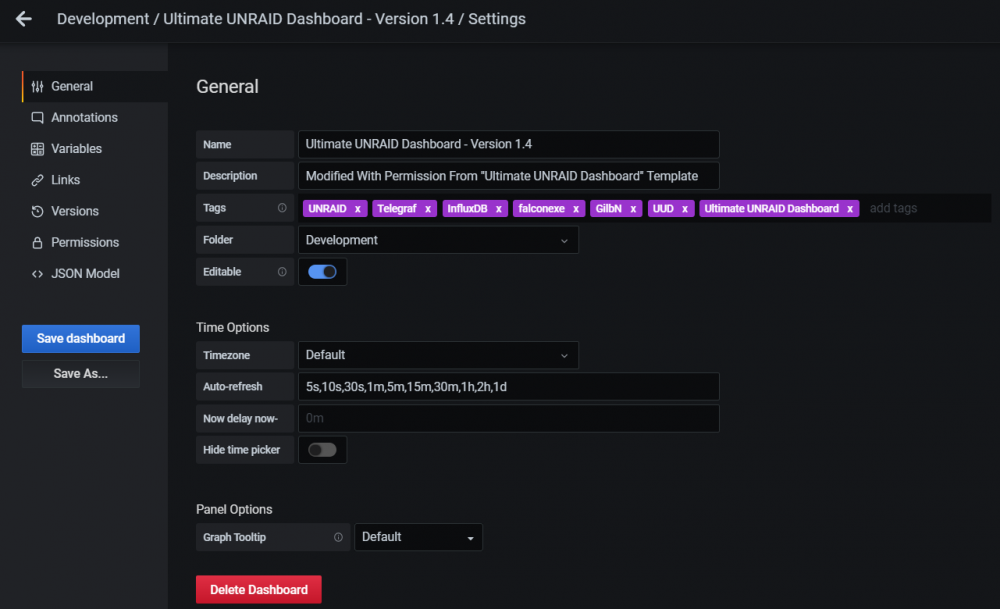
@mmag05 I'm cool with that as long as the following is done. And this goes for anyone who wants to republish our original work within or based on the Ultimate UNRAID Dashboard (UUD). Always REFERENCE and LINK This Official UNRAID Forum Topic: Within Your Modified Dashboard Under Dashboard Settings > General Add a Description of: Modified With Permission From "Ultimate UNRAID Dashboard" Template Tag "falconexe", "GilbN", UUD, & Ultimate UNRAID Dashboard Support: You Support the Modifications and Additions to the UUD (AKA Your Stuff). However, I am happy to support anyone having issues with original panels from the UUD within this forum, so feel free to send them here. Fair Enough? 👍
-
Not that I am aware of. There are some things that even us developers are waiting for the Grafana vendor to add as features to the tool. If you come across an update or a way to add this in via back end code, let me know and I will be happy to add this. One thought on Windows 10 is that you can run both instances in Kiosk mode by putting the tabs in 2 separate windows, and then just pin them with the Window + Up/Down/Left/Right key combo. Sometimes I run production and dev vertically stacked like this when I am actively developing. But I have a 43 inch monitor so it is big enough to not lose detail. You could also do side-by-side. Just a possible work around...
-
Since that should be a part of the default tutorial that GilbN created (his website), that I linked in the Resources section in Post #3, I did not add it. However, you make a good point, and I can see how others might miss that, so I will add those explicitly to the Dependencies section in Post #1. Congrats, you are now an Official UUD CONTRIBUTOR (You are now listed as such on Post #1) 🤝🥳
-
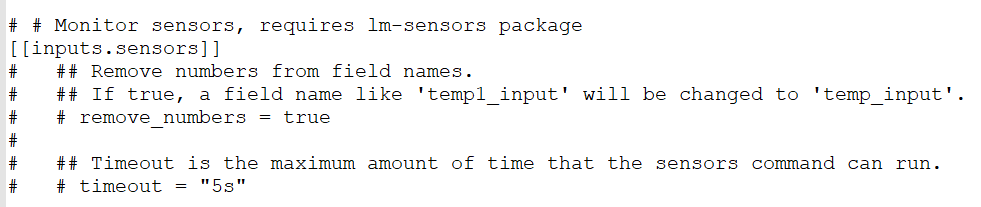
As an alternate to IPMI to monitor CPU/System/Aux Temps, you can try the Sensors Plugin. Enable [[inputs.sensors]] in the Telegraf Config (Uncomment It) Bash into the Telegraf Docker and Execute "apk add lm_sensors" Stop All 3 Dockers (Grafana > Telegraf > InfluxDB) If You Want to Keep This Plugin in Perpetuity, You Will Need to Modify Your Telegraf Docker Post Arguments To (Adding lm_sensors): "/bin/sh -c 'apk update && apk upgrade && apk add ipmitool && apk add smartmontools && apk add lm_sensors && telegraf'" Start All 3 Dockers (InfluxDB > Telegraf > Grafana) Let me know if that works for you.
-
I appreciate your work and analysis on this. I'm still not clear if this is something that @SpencerJ @limetech can improve in a future update. Per the tail end of my thread, you mentioned that it may be possible. I'm hoping they can officially shed some light on this SHFS overhead, and how it might be optimized for us that use 10GBe network cards to transfer large amounts of data on a regular basis.





