falconexe
Community Developer
-
Joined
Everything posted by falconexe
-
You may still need to enable plugins and settings in the Telegraf config that comes with GUS. Wether you make your own, or use the one that comes with GUS, you still need to verify/implement the correct configs. Just ensure everything in the dependencies section is done.
-
Nope. Just click the save button in the upper right any time you make a change.
-
@SPOautos I am merging your last comment from the other topic over here so you can pick up where you left off... Please continue from here with your questions as this is the official UUD support topic.
-
Hi again Stephen. I'm the developer of the UUD, and for support on UUD, you will want to post this back in the UUD topic where you just came from. Testdasi only supports the dockers and GUS. I support the actual Dashboard, which is what UUD is. Please post dashboard related questions to my topic below. Also include what hardware you are running on (are you on a server, or consumer hardware?). I'm heading to bed now, but I or another UUD user will assist soon enough.
-
And correct, you do not need to install the 3 dockers or the UUD version 1.3 since it is baked in. GUS is a one stop shop for the prerequisite apps you need. Your next step is the DEPENDENCIES section on Page 1 > Post 1. This is where you configure everything.
-
The UUD is ONLY a dashboard that can be imported into Grafana. You still need to configure Telegraf's Config File, download/install Telegraf Plugins, etc. Let us know if you get stuck anywhere. You got this!
-
@SPOautos I also STRONGLY suggest you read 👉THIS👈 ENTIRE forum topic as A LOT of tutorials, tips, tricks, guidance, and direction has been included with detailed screenshots. Finally, you should also check out GilbN's Tutorial here for a good foundational knowledge of what UUD is and how it works. https://technicalramblings.com/blog/how-to-setup-grafana-influxdb-and-telegraf-to-monitor-your-unraid-system/ The UUD family has been great! We're all here for you and will get you up and running!
-
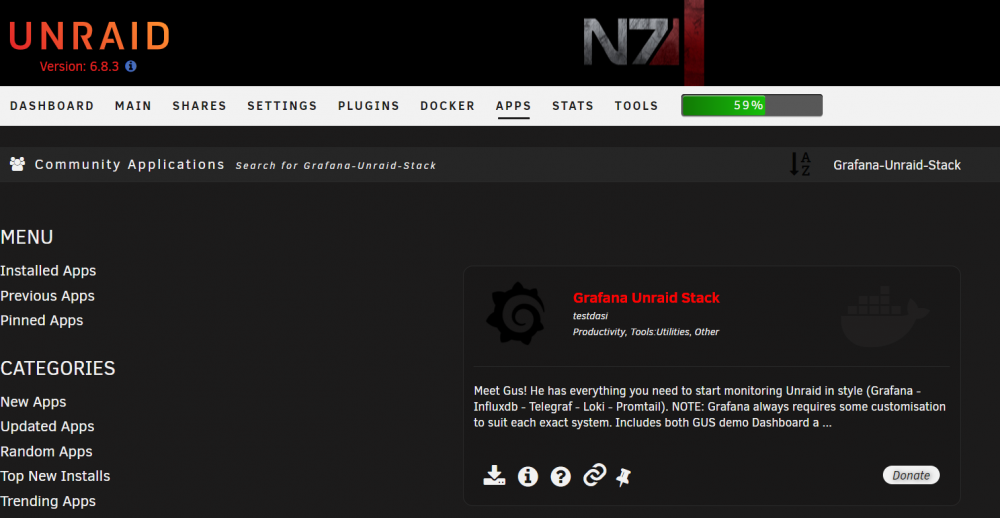
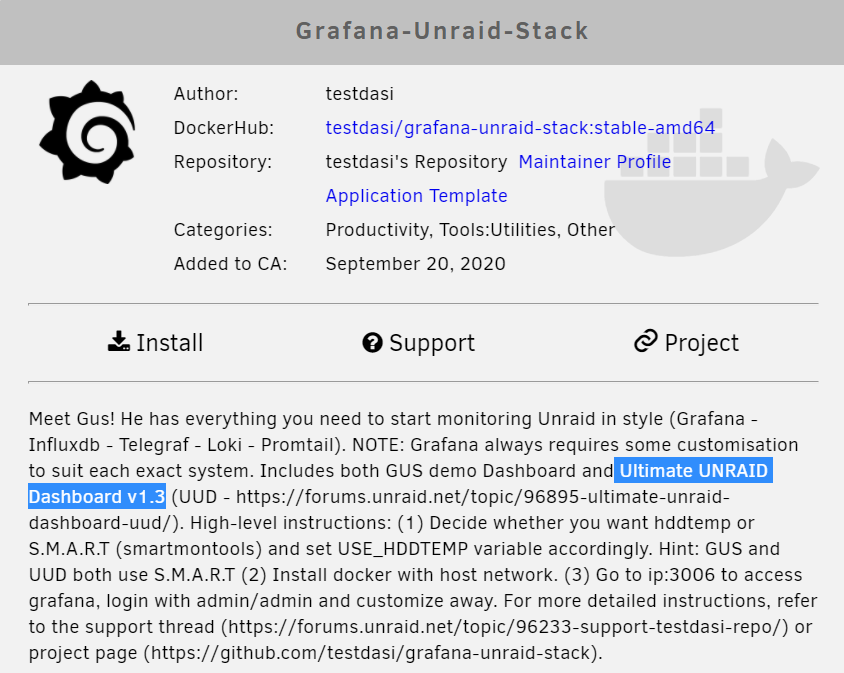
You can download GUS from the Apps section of the UNRAID GUI.
-
Thanks... @SPOautos You can also give the Grafana Unraid Stack (GUS) a try, which is a single docker that installs all 3. It also comes preinstalled with my UUD 1.3. You'll still need to perform the configurations on Page 1, but that would be a huge start for you. Check out Post 1 for the the link...
-
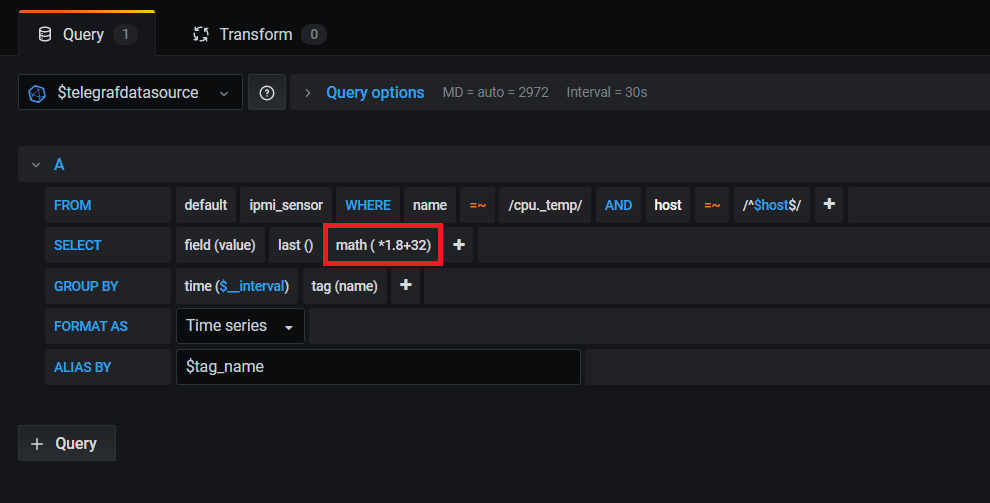
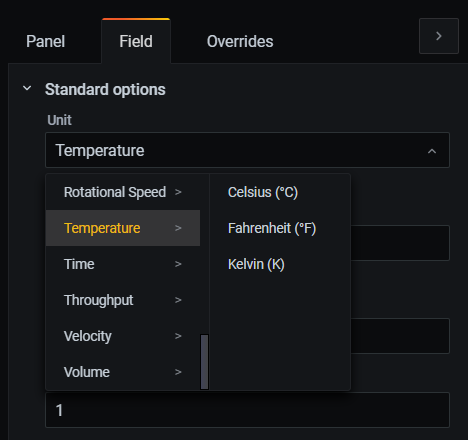
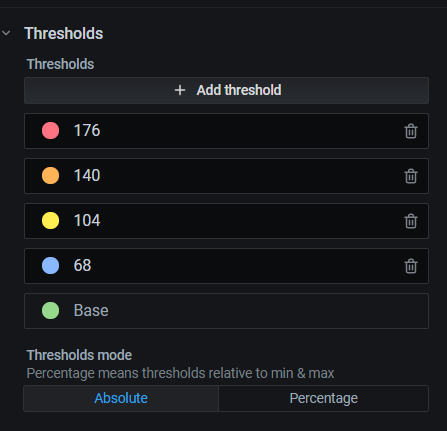
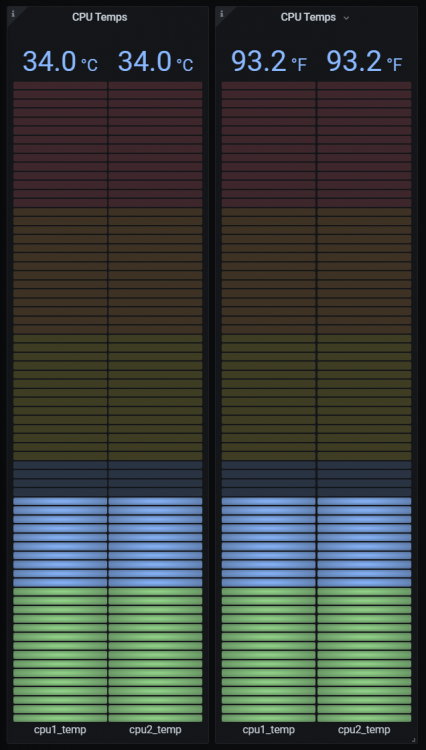
@danktankk Ah what the heck. I'm in a good mood. Here you go. Just add MATH to your select statement and punch in ( *1.8+32). Then go over to the right panel and set the UNIT to F. Then finally, adjust your Thresholds to F values (colors). Side By Side:
-
I haven't tried this yet, but you can always slap a MATH function (F = 1.8*C+32) on a Celsius query and then change the datatype to Fahrenheit with an Override. Once I get some time, I'll give this a shot. This is very easy to do though.
-
Once I explain/add support for sensors, you should be able to get this going. I am on Intel and have no AMD hardware to test on. However, a few people that I have see on multiple threads over the few past weeks have got it working. I won't be able to help write the query (because I can't see the plugin output for AMD hardware), but you should be able to take someone else's code and adapt it. There was even a guy in here a few pages back that explained how he accomplished this. First, we'll get 1.4 out, and then we can work on your use case. I'm sure we'll all come together to figure it out...
-
The plan is to have 1.4 be out by 10/10/2020. 1.5 is already built, but it is in it's own dashboard. I'm going to have to spend some time integrating it with 1.4 once that is done. There are also A LOT of specific dependencies and configurations for 1.5 that I will have to write extensive documentation on. Technically, these should be separate dashboards, but the "Ultimate" in UUD is no joke. I mean it. I'm trying to build the end all be all of dashboards, while also still making it easy for everyone, including people who are new to UNRAID and/or tech in general. The way I look at this is that each release from 1.4 on will add another layer of depth. If someone is happy with just UNRAID monitoring then they can stick with 1.4. If they want Plex/Varken, then they can get on 1.5 and so on. Or you can always download the latest version (netting you all future updates) and just remove the sections/panels you don't want. Now that 1.5 is built, I can go back and finish 1.4, which lays the foundation for the future. Exciting things are ahead. Stay tuned.
-
Glad you found it!
-
Thanks. Yes syslogs were planned for 1.6. I’ll be reaching out to you directly to regroup on this.
-
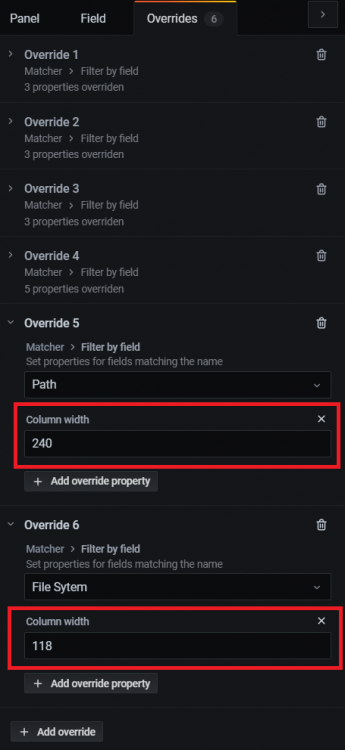
@FreeMan Here is a screenshot. Overrides are on the right side when you "Edit" the query.
-
Go into the query and place a column width override on each field as you see fit, then save.
-
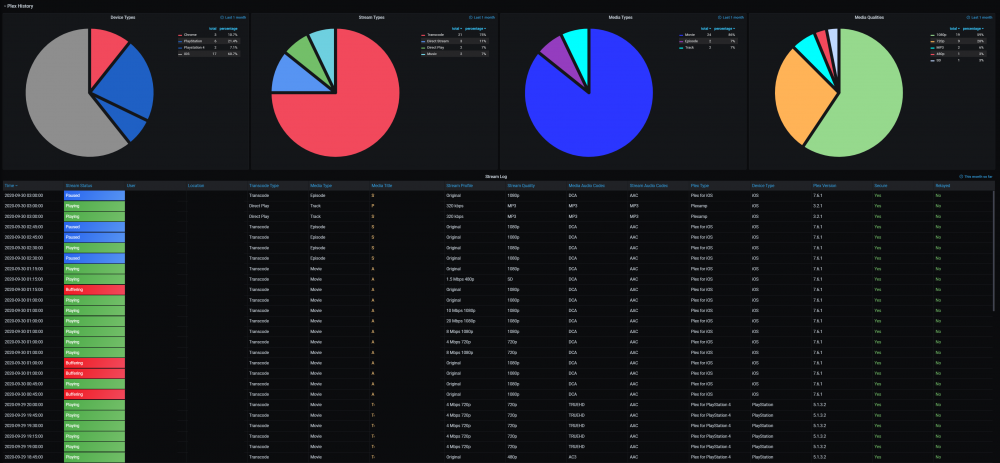
Ok, NOW I'm done. For Tonight... 😂
-
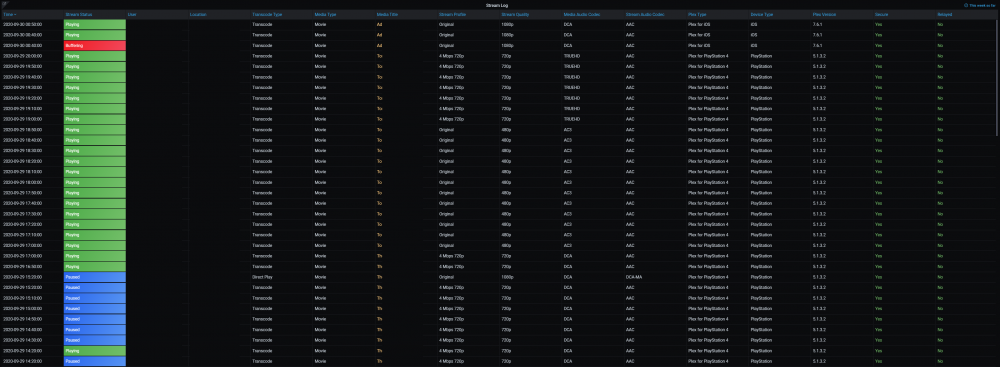
This is what I worked on tonight. Fully Custom table displaying Plex streaming log every 10 minutes going back 1 week. Custom overrides, dynamic colors based on stream metrics, and much more. Want Unsecure Streams highlighted? Done. Want Relayed Streams brought to your attention? Done. You won't find this in any other Varken Dashboard! All Available Timelines (Max Data-Points): 1 Day Every 30 Seconds 1 Week Every 1 Minutes 1 Month Every 15 Minutes 1 Year Every 2 Hours Click the pic for high resolution. People, Places, and Things Redacted...😜 I'll also be adapting this to the CURRENT STREAMS table up in the top. This provides much more information, and again, is fully dynamic. That one will be updated every 30 Seconds, and will show only the last records for the current interval of 30 Seconds. AKA, only real time streaming info.
-
Correlating Varken graphs showing network utilization and total streams. Very interesting...

-
If you use the UUD, then you already have InfluxDB. Varken creates a new database within InfluxDB. Varken is to Plex/Tautulli what Telegraf is to UNRAID. It is an engine (middleware) that integrates both pieces by ingesting data from the source app and then inserting data into the database. Grafana then reads these databases and spits out pretty data visualizations so long as you know how to code them. That’s where we and the UUD come in.
-
I’ll be including a tutorial on my UUD side as well. Users will be covered from all perspectives, even if GUS never has Varken, they’ll be able to do it manually. Just always nice to have multiple options.
-
Yeah once UUD version 1.5 is ready, I can share my Varken docker settings and appdata INI file. For this to all work, there are a number of other dependencies outside of Varken (Working PLEX and Tautulli Dockers), 2 additional Grafana plugins that need to be installed via CLI, and finally, users will have to register for a MaxMind (GeoMapping) API key. If I were you, I would just add the Varken docker with Default INI to GUS and possibly preinstall the 2 Grafana plugins, and have users configure PLEX/Tautulli/MaxMind separately. There would be no way to effectively include everything within GUS because there are just too many user specific needs/requirements/variables. I can assist users from the UUD side with the downstream dependencies and configurations.
-
Glad you like it. Click the pic for full rez. It is in 4K.
-
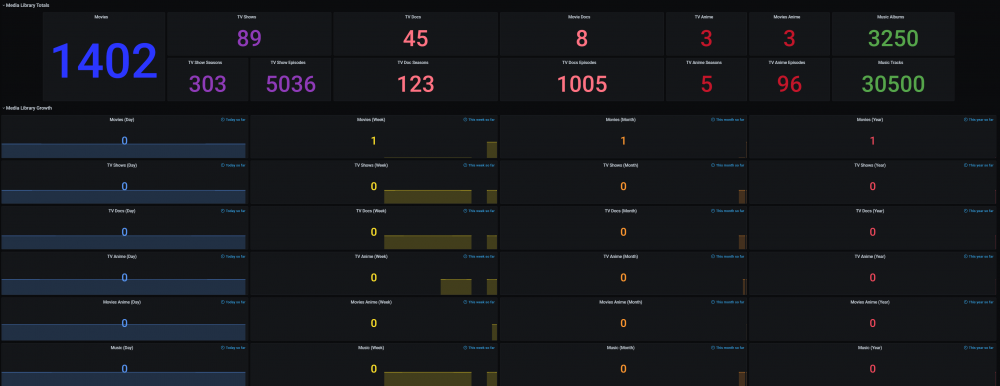
Here's the latest on that bottom section...