


falconexe
Community Developer
-
Joined
Everything posted by falconexe
-
Yeah I'm on 6.8.3 and will be staying put until 6.9.0 is stable. The UUD has only been tested on 6.83 and prior. Once we get the next release, I'll make sure the UUD is compatible.
-
Ha ha good catch. How about this. 2020-01-02 (YYYY-MM-DD which is developer format). I'll update my original post.
-
DEVLOPER UPDATE: I finally took some time off from work over the holidays, so I will be jumping back on this next week. Version 1.5 WILL BE RELEASED with a target date no later than 2021-01-02 (January 2nd, 2021 for ChatNoir 😂). As we head into the new year, I will begin work on version 1.6 which will ADD many new features, bug fixes, and will combine ALL requests/user developed panels thus far (where possible) into that release. From that point (1.7 onward), we can look to future use cases, features, and a roadmap from your suggestions. I will continue to add features/panels/customizations as needs arise for the foreseeable future. If I can get my hands on some new hardware, I'll look into NVIDIA GPU monitoring as well, but I may need to get a new motherboard since all of my PCIe slots are tied up. Thanks for all of your support everyone! Glad you are all getting some use out of the UUD and that you are all enjoying it as much as I do! Happy Holidays!
-
Just to be clear, the UUD does not have an "All In One" Package. You are referring to the "Grafana UNRAID Stack" (GUS), which I DID NOT develop. GUS was created by @testdasi, and I GAVE HIM PERMISSION to include the UUD as a built in Dashboard within GUS' default Grafana install. So any and all support for GUS, should be addressed in his forum post. However, I will always help where I can. As such, even with GUS, you DO have a Telegraf docker, as it is installed as a part of GUS, along with Grafana and Influx DB (appdata folder). You can made any modifications to Telegraf's configs, etc. the same way you do if you don't use GUS, and manually install those 3 dockers and then import the UUD into Grafana.
-
UNRAID 6.9.0 RC2
-
According to some, going to RC2 resolves this. I’ll be staying on stable for the foreseeable future. UUD is only tested/validated on 6.8.3 thus far.
-
Hi Stan464, welcome to the topic. Glad you are enjoying the UUD. Unfortunately, I don't have any time to support you personally right now, but I would suggest reading through the entire topic as a lot of this has been covered. If you don't run a cache drive, you can just remove that variable in the dashboard settings, and any references to it in each panel. Drive stats are covered by the inputs.smart plugin, so search the topic for that. For currency, you will need to change the UNITS on the UPS panels to reflect your currency of choice. Hope this helps!
-
Good point, but there is also the advantage of spreading the load across more drives to decrease the risk of data loss (less data on any single drive) in the event of disk/rebuild/backup restore failure. Assuming you are using an allocation method of “most free” or “high water”.
-
Nice work! I’ll check this out.
-
Ha ha. Actually, YES. I was able to upload 16TB so far and have had no issues. A bit complex to get all the settings just right, but once it is locked in, it’s fire and forget.
-
Man, I've got so many freaking ideas right now. I'm huge into KODI/LaunchBox/BigBox theming, so this is right up my alley. I love theme music playing on every movie/tvshow/game. Tell you what, I will UpRes some source material in 4K using Topaz Labs Gigapixel AI, and upload them here. I do this with all of my images and they always look insane in 4K. That software is really amazing... I have 3 Mass Effect Images in particular that I would LOVE to have as my log screens for each of my servers. Let me me know if that is something you can pull off for a new "Mass Effect" section in your GitHub.
-
YES. Source is unknown, but this is all over the net and wallpaper sites...
-
Another idea would be a Star Trek LCARS menu looking one. Are sound effects possible??


-
I'll pay you LOL...
-
Dude, freakin sweet! Can you make me a MassEffect/N7 one?
-
Check your units. They are usually in bytes. You should change it to GB or whatever you like. You may need to put a math function on and divide accordingly. Check my other panels and look for math if you need an example. Since I did not develop this particular panel (one of our fellow users did), and the fact that it is not currently included in the UUD, I will have to look into this when I have time. I will include this in version 1.6 if I can get it to work right and will credit the user who shared it.
-
You will send data from server 2 into the main InfluxDB. As long as you setup your telegraf config correctly for server 2, it will show up in the HOST variable drop down. Once setup, simply select which host you want by selecting this variable and the entire dashboard will dynamically change accordingly. I just got my backup server stood up, so I will be actually testing this myself soon. I know a few people on this forum have it working, and the UUD is designed to handle this automatically once the foundation is there.
-
Yes. UUD assumes you have a cache drive. You did the right thing by removing the 0 in the path for your use case.
-
I forgot to mention that once you remove the group by statement, you need to re-add the select statements. Like "LAST" and "MATH". If you touch the group by, it drops any customs on select. Have a look at your other panels and put that back in, and it should work again.
-
Try clicking the $. It will sometimes turn blue and auto populate. You can also try removing the group by, and then reapplying it. You can also set it to however many seconds you want, like "30s", so "time(30s)".

-
No you are not hallucinating. That is controlled by the Group By "Interval" option within the query itself. Grouping by time will curve the edges. It is a nice feature to curve 0 values (nulls) into a graph without having a gap. You can add that group by to all, or remove it from all. I would definitely match them all up one way or the other though.

-
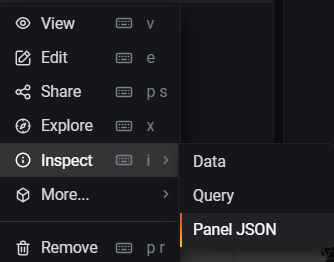
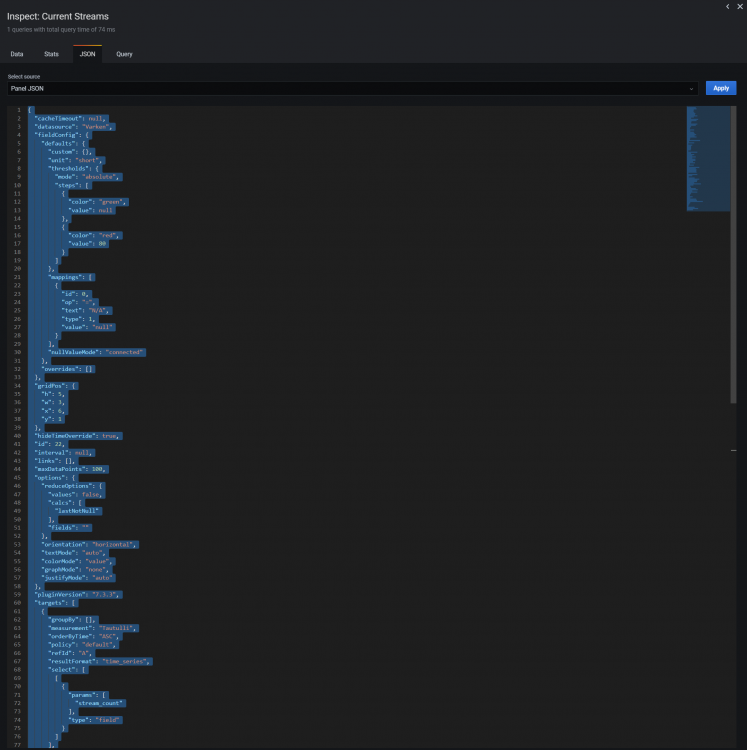
Right click any panel and select... Post the JSON. To import the JSON, click any panel, and select the same option. Copy the new JSON code (Control + C), Delete all existing JSON code from the original panel (Control + A), and then Paste in the new JSON (Control + V) to make it the new version. Click Apply. This creates the new Panel. Then to keep it, SAVE YOUR DASHBOARD.
-
Hey guys. We had a Corona virus scare over here (been super sick), so we've been dealing with that. I was hoping to have this out by tonight, but I am still working on it. I have the code written and the JSON is independently completed, but I have yet to integrate it into the UUD. And the the largest task of all is documentation and release notes (and that takes a LONG time). I've been going back and forth debating whether or not to release this independently as the Ultimate Plex Dashboard (UPD), or just integrate it into the UUD as version 1.5. I've decided to incorporate it into UUD, but for those of you who want a dedicated Plex Dashboard, I can release a standalone version of this as well, if there is enough demand. I'll post updates next week on a potential release date. I hope you all have a fantastic Thanksgiving!
-
Thanks @Hoopster and @MrLondon for helping out. Here is my Telegraf config. telegraf.conf If you import this into your appdata folder for Telegraf (mine is \\MassEffect\appdata\Telegraf), it should get that part running. You may still need to tweak things for your setup/liking including your server IP address (LINE 112). You also need to set ALL of your variables up top in the dashboard OR IT WILL NOT WORK. Finally, you will want to verify your Docker Configs for Telegraf/Grafana/InfluxDB. Everyone in here has been able to get the UUD at least up and running at a baseline. I suggest you carefully read page 1 of this topic (especially the DEPENDENCIES section), and then re-read @GilbN's fantastic tutorial website. Everything you need is in this forum or within that link. That is exactly how I got started knowing absolutely zero... Our UUD community is very helpful as you can see, so we'll get you sorted out one way or another. Good luck and report back.
-
Once more thing. Since UUD version 1.5 will be using Varken to source Plex stats (via Tautulli), GUS will no longer provide all functionality out of the box (unless @testdasi adds Varken support). You will still need to install and configure Plex/Tautuilli/Varken if you want to see Plex stats. If Plex is of no interest to you, then you can just remove those panels and just get the 1.5 code updates everywhere else.


