falconexe
Community Developer
-
Joined
Everything posted by falconexe
-
GUS includes UUD 1.3 with my permission. I am not sure if @testdasi has included my latest release UUD 1.4. However, as Hoopster said, you can manually import version 1.4, and soon 1.5, right into Grafana once GUS is installed.
-
I can post my Telegraf Config later today. What SPECIFICALLY are you stuck on? If you read my instructions on page 1, you just need to enable certain features by removing the comment “#” in front.
-
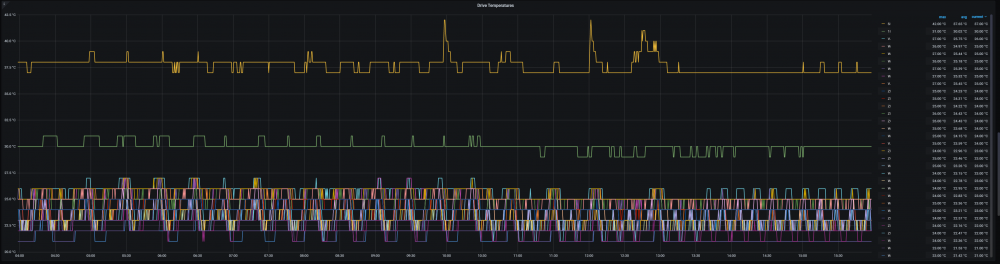
Just hit 270TB total in a single server with 240 Usable. I also just moved to a new house with a dedicated server room with built in cooling. I have had drives idle as low as 19C, and my array drives stay in the mid 20's under load. The yellow is my NVMe cache drive, and the green is another Unassigned Device. The array is always cool and the room is regulated at a constant 66F. This Storinator chassis continues to impress, and does even better when you give it some help with HVAC.

-
Just hit 270TB total in a single server with 240 Usable.

-
Almost spit out my water when I read this. That is hilarious. Glad you are loving it! I'll add your suggestion and add you as a contributor once it is LIVE.
-
Or that. Ha ha. Whatever you guys want... LOL
-
I don't have time right now to deep dive, but I would suggest following the link on Page 1 > Post 3 where I linked GilbN's great tutorial website for getting started. Here it is again below. Also have a good look at my instructions in post 1. If anyone else wants to take a crack at supporting Vaggeto, it would be much appreciated. I'm still unpacking and dealing with house related activities. Good luck! https://technicalramblings.com/blog/how-to-setup-grafana-influxdb-and-telegraf-to-monitor-your-unraid-system/
-
Yeah that is freakin sweet. If you want to DM me the code/documentation, I'll add that to version 1.6 (maybe 1.5), credit you, and add you as a contributor. This is what I love about this community. Keep stuff like this coming... 👍
-
Our move was successful, bit I'm still unpacking over here. Finally got my servers setup into my new dedicated sever room. I'll circle back on the previous posts (questions and bug fixes) and start working on the UUD again soon. My current plan is to release version 1.5 by Thanksgiving. Thanks for your continued patience and support everyone. Hope you guys are good and staying safe out there...
-
This is all adjustable in the right panels/overrides. I’ll take a look once we finish our move into our new house. I’ll be MIA until next weekend.
-
Hi all. LIFE happened. I'll be posting version 1.5 in a few weeks when I get some actual time to work on it. In the meantime, I'll be here to support you all for 1-off questions/issues.
-
Got it. Thanks!
-
Agreed. I’ll add them. You mind DMing me your 2 panel JSONs (or posting them here) as a reference?
-
Yep that’s what I was talking about. Nice job! 👍🏻
-
I have a Cache I/O graph in version 1.4, but I’ll add this type of graph to version 1.5, as I can see the value in it. High volume cache writes have been a hot topic for the last few months, especially for people like myself who have invested in expensive NVMe drives and/or large pools. I’ll add you as an official contributor once this is done.
-
You can use the right side panels to adjust the transparency and how the bars stack on each other. The lower number one should sit inside (fill the lower portion) of the larger one (just going off memory I know this works with line graphs...)
-
Copy query A with the copy button and change the drive in query B. Or add multiple drives to query A with an OR statement.
-
The same concepts I applied to the UUD with regards to array growth can be applied to any metric. What type of graph are you looking for? Just a number for each interval over time (day/week/month/year) or do you want to see it on a single chart like a line/bar graph? I’m finishing up the work on version 1.5 and hope to have that done this weekend. I can work on this after that.
-
No worries. It might me something I add if I end up getting a GPU. My chassis (45 Drives Storinator Q30 Turbo) is geared towards mass storage, and CPU/RAM performance, but not necessarily GPUs. I'd have to upgrade the PSU and drop some PCIe expansion stuff to do it. Maybe I'll use my old gaming rig to run a test bed UNRAID build with my old GTX 2080Ti (once I get my hands on a RTX 3080).
-
If you are down, please post your Queries/JSON/screenshots of your NVIDIA GPU monitoring panels. It may help people like ptchernegovski.
-
I've covered this before. If you want to add NVIDIA GPU monitoring, check out the following: https://github.com/influxdata/telegraf/tree/release-1.15/plugins/inputs/nvidia_smi Once you install the plugin in Telegraf and enable it in the config, it should show up in the query window and you can start messing with it. IF, I ever end up putting a GPU into my UNRAID box, I'll bake it in. I just don't have any spare GPUs currently, and no more PCIe slots left that aren't filled with HBAs, 10Gig NICs, and PCIe NVMe adapters LOL.
-
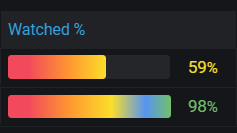
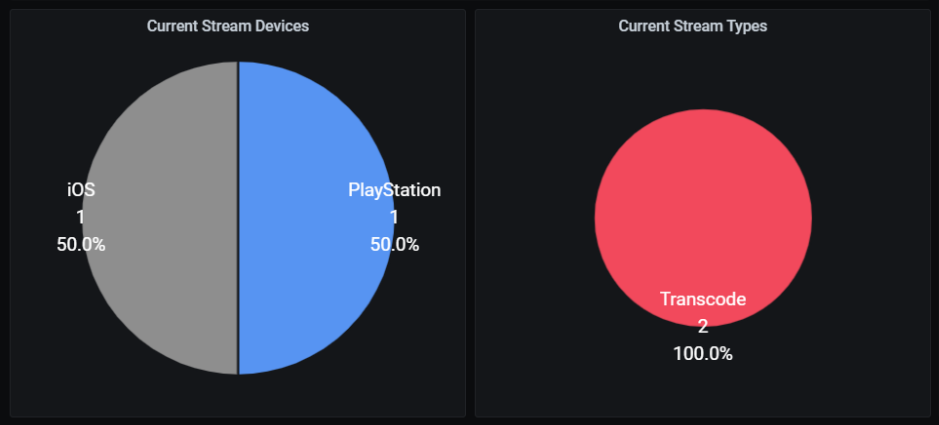
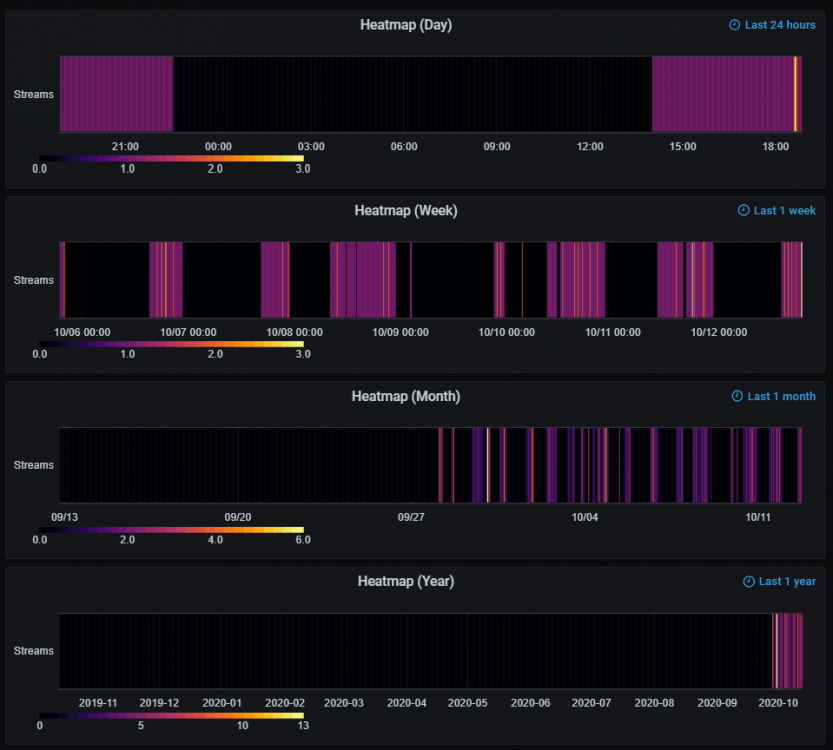
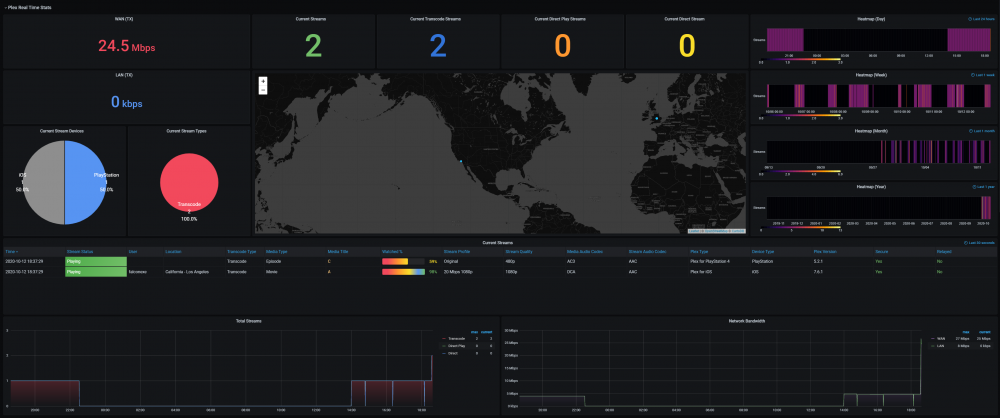
Alright everyone. I have made some MAJOR updates/changes/additions to the Plex/Varken panels coming to the UUD version 1.5. Starting with the upper panel, I turned this into a REAL TIME stream monitor that watches for activity every 30 seconds. I think it looks freakin sweet. The heat maps add a nice touch and give a 10,000 foot view of activity, and I really like the way the real time monitoring table came out with custom triggers, overrides, and formatting. Everything you would want to know about what and where exactly activity is coming from on your Plex server. I used 2 VPNs on this screenshot, and left my user account status mostly intact so you could see a full record. Other people, places and things are redacted where applicable. Let me know your thoughts. New Dynamic Watched Percent (Really like the way this turned out!): Current Stream Pie Charts: Heat Map with Relative Dynamic Timeframes (Skew As Time Passes): Full Top Panel (Plex Real Time Stats): I'll preview/discuss the second row of panels in my next post!
-
I don’t drink beer but I do enjoy a good root beer. Henry Weinhard's is my go to. How many are there of us green shirts anyway?
-
You can always right click on the Grafana docker and view the log there from the UNRAID GUI. One difference is that I DO NOT use GUS, and manually installed all 3 dockers. I cannot attest to which version of Grafana is included in GUS, but you may want to confirm with Testdasi on that. Glad you found some breadcrumbs to follow at least. Let us know if you get it resolved.
-
Something really cool happened. I woke up this morning and my profile had this green wording on it. I just officially became the newest UNRAID "Community Developer". I just wanted to say thanks to UNRAID and @SpencerJ for bestowing this honor. I am pleased to be able to add to the community overall. You guys rock! Honestly, I have been a part of many forums over the years, and I have never seen a community so eager to help, never condescending, always maintaining professional decorum, and overall just a great place to be. I'm proud to be a part of it!