falconexe
Community Developer
-
Joined
Everything posted by falconexe
-
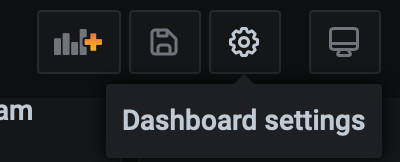
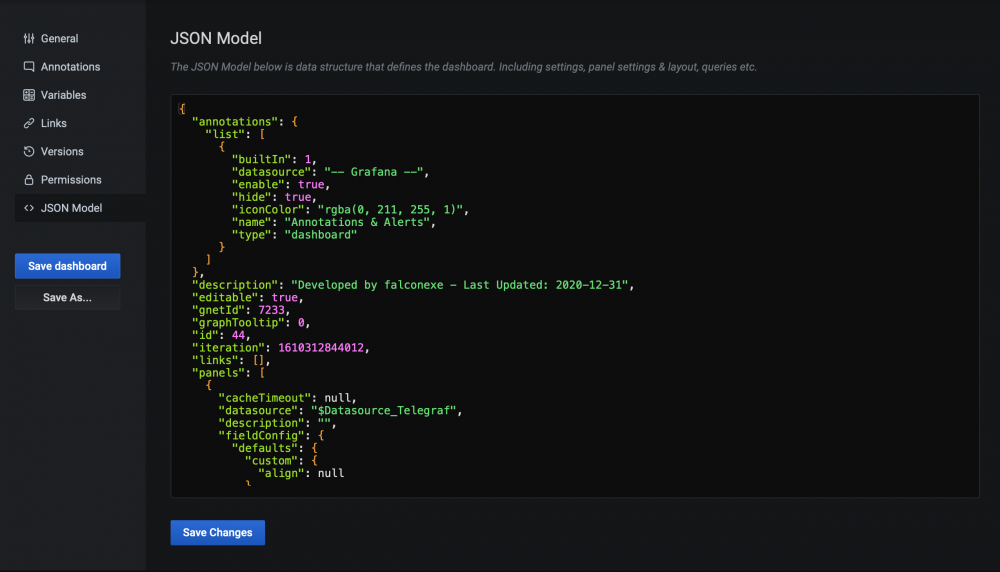
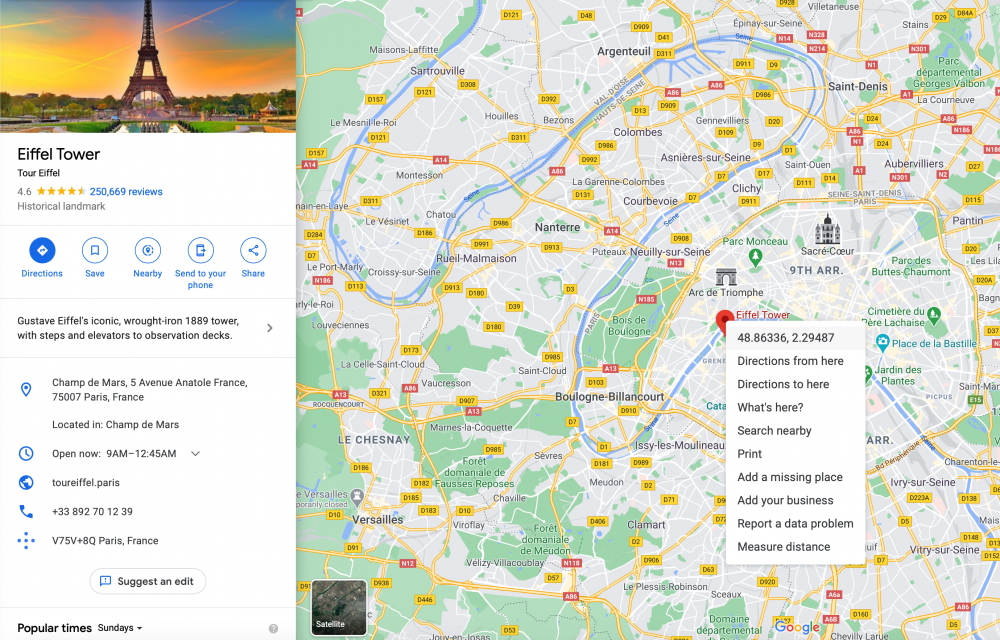
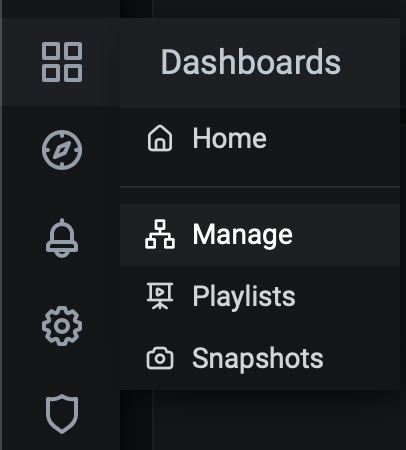
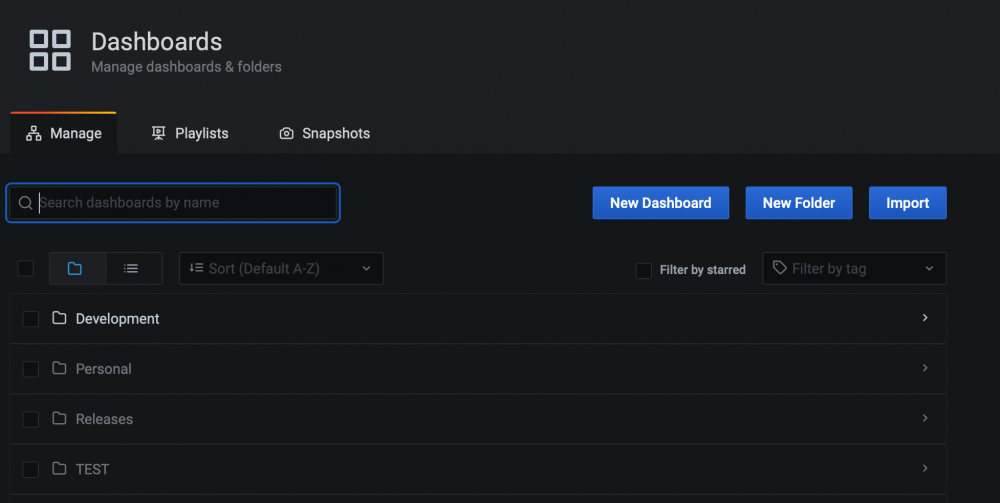
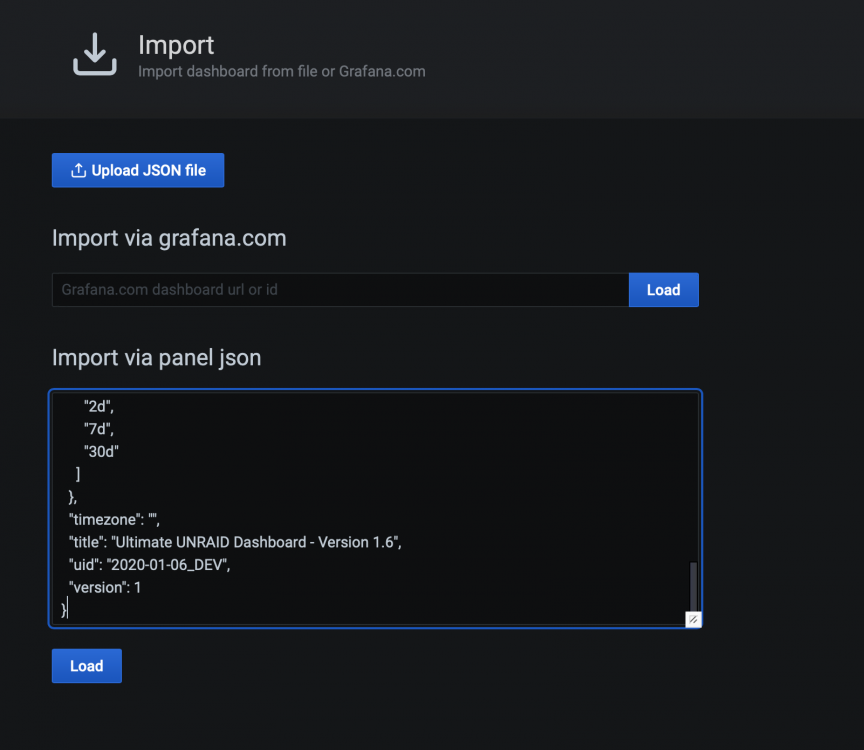
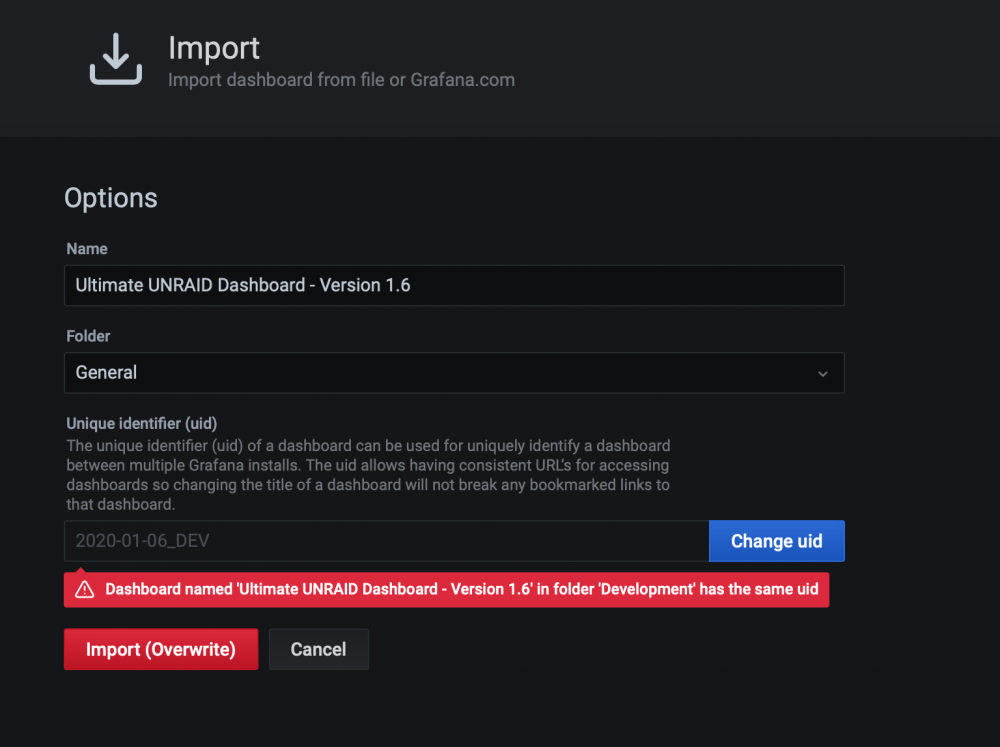
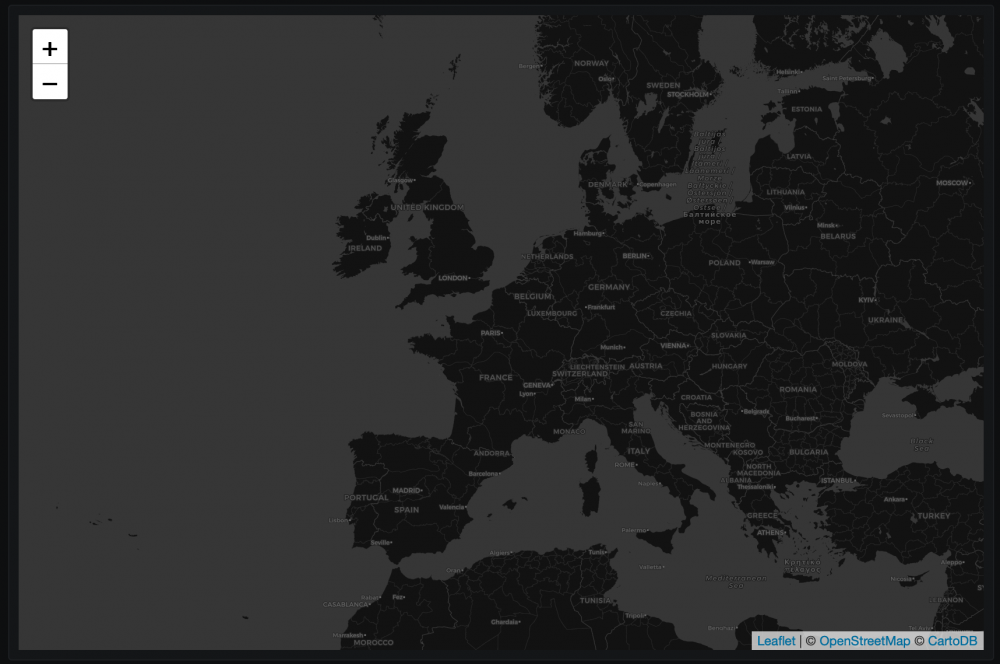
@abb0r Ok, so here's how to change the default CENTER of the GeoLocation Map. First click on Dashboard Settings (Gear Button) in the upper right of your dash. Next Click on JSON Model to see the code. Select All and Copy the Code into a Text/Code Editor. I am using "TextMate" on OSX in this example. Search for the variable "mapCenterLatitude". Once found, delete the coordinates (between the quotes). Then on the very next line in the JSON code, find the "mapCenterLongitude" variable, and again delete the coordinates (between the quotes). BEFORE: "mapCenterLatitude": "37.9", "mapCenterLongitude": "-94.9", AFTER: "mapCenterLatitude": "", "mapCenterLongitude": "", Next head on over to Google Maps. Set a Pin to where you want your new center to be. Right click the pin to see the coordinates. In this example I am using the Eiffel Tower. Click the coordinates and Google Maps will send them to your clipboard. Put the new coordinates into the mapCenterLatitude (Left Coordinate) and mapCenterLongitude (Right Coordinate) variables. Now SELECT ALL and COPY ALL of the JSON code from your text/code editor. Next go back into Grafana, click the arrow in the upper left to back out of the previous JSON Model screen, and then click the Dashboards button (4 squares). Then select Manage. Next, you are going click the Import button. Then paste your modified JSON code into the following screen. Finally, hit Load and give it a NAME, and a NEW UID by clicking the Change uid button, and save it in the folder of your choosing. Now open your new modified dashboard and you will see that the map is now centered on the location of your choosing! Note: We are making a second dashboard altogether. In case something goes wrong, you can always fallback on your original one. I am teaching it to you this way so that you get familiar with these steps and to instill best practices. NEVER globally modify (direct JSON code) your dashboard without making a backup copy first (by exporting your original JSON), or by importing your changes into a new dashboard entirely, thereby preserving your old one. This process is ONLY for dashboard wide global type changes AND NOT for panel modifications. You should always save your dash BEFORE AND AFTER making panel modifications, so that you can rollback to a previous save if your panel blows up. Let me know if you have any questions. Good luck!

-
Remove those 2 fan features, then add a new feature from scratch by clicking feature. Use trial and error to find the feature(s) that are your fans. Each system architecture is different, but they’re in there somewhere. After trying this, let me know if you find them. Check page 16 for another user who solved this. You can look at his query as a reference.
-
Yes, but it is a tad complex. You have to go into the JSON code of the entire dash directly, find the geo location code, and change the default GPS coordinates. In version 1.6, I am going to try and make this a real panel where this can be done easier. When I get some time, I’ll provide the line numbers you need to change.
-
@grtgbln One note from your final vid. When downloading the UUD JSON, you can just upload it directly into Grafana by clicking the upload file button. There is no need to open the UUD JSON and paste the code, although that does work. The easiest way is to just import the JSON file directly.
-
@grtgbln Thanks man. Just watched. Great work. I appreciate you taking the time to do this for our community! Here are the links to the video series. Intro: Part 1: Part 2: Part 3:
-
Alright, just got off the phone with him. He's going to remake the videos. I'm excited to see what he comes up with!
-
Page 16.
-
For sensors, please see PAGE 16 of this topic for some panel and code examples.
-
@grtgbln just set his vids to private until we can get the content corrected. I appreciate him protecting the integrity of the UUD and what it is. Hopefully his new and/or corrected vids will be back up soon and I'll be the first to endorse them.
-
You'll need to modify the panel and change the query to use the new plugin. If you are trying to use it for fans, then search the topic for "AMD", "fan", or "Ryzen" and you will find a few examples with this code. Let me know if you can't find it.
-
Are you on AMD buy chance? Search the topic for "fan" or "AMD" or "Ryzen" and you should find multiple posts with code to resolve this. If you can't find it, let me know.
-
@SpencerJ Thanks for letting me know there was some media created. I reached out to the content creator @grtgbln. Unfortunately, what he is showing in the 3 videos IS NOT the Ultimate UNRAID Dashboard. He does a good job of explaining the process to install the dependencies, but he never actually installed the UUD JSON and is just showing the default Varken dash and Gilbns personal dash. I am going to work with him to make sure the correct info is getting out there in the wild. I really appreciate him taking time to create some vids on the UUD. Hopefully we can get this all corrected. The UUD is an ALL IN ONE dash.
-
Thanks man. Yep those commands are included in the Varken github install guide that I linked in the release notes. Thanks for sharing! Glad you are loving 1.5.
-
This is also found in the tutorials section on POST #3 of this topic.
-
I instruct them to call it “Varken”. We’ll see if everyone follows directions. I suppose that makes sense if someone already has a datasource for Varken that is not called “Varken”. I’ll look into it. Thx.
-
Sweet! Now I just have to update like a 100 panels for version 1.6 😂 Thanks for testing.
-
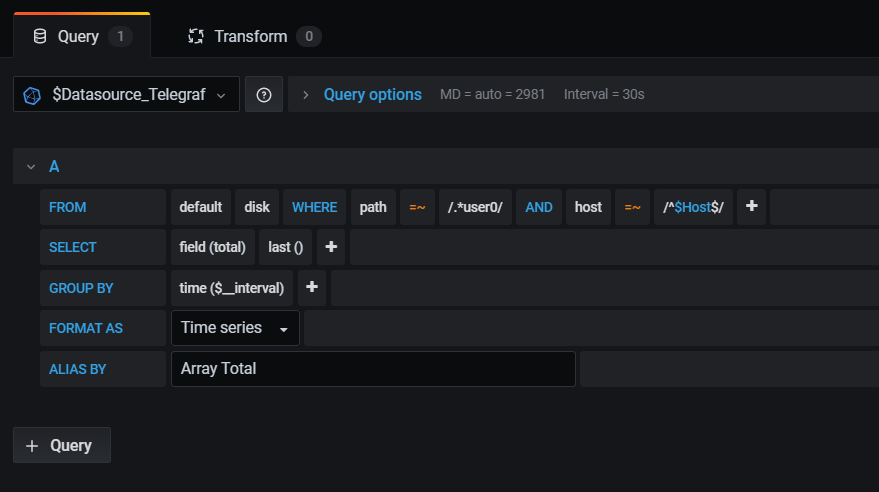
Did you create and place the Telegraf config in the appdata folder?Here you go. Please test this with the Grafana UNRAID Stack (GUS). This is confirmed working with the manual docker install setup on my end. Create a new panel and post the following JSON into it. Then apply. { "datasource": "$Datasource_Telegraf", "description": "Note: Change Path to \"mnt/user\" if Cache Drive is Not Present", "fieldConfig": { "defaults": { "custom": { "align": null }, "unit": "decbytes", "thresholds": { "mode": "absolute", "steps": [ { "color": "rgb(64, 138, 255)", "value": null } ] }, "mappings": [] }, "overrides": [] }, "gridPos": { "h": 6, "w": 3, "x": 3, "y": 5 }, "id": 173, "links": [], "options": { "reduceOptions": { "values": false, "calcs": [ "lastNotNull" ], "fields": "" }, "orientation": "auto", "textMode": "auto", "colorMode": "value", "graphMode": "area", "justifyMode": "auto" }, "pluginVersion": "7.3.3", "targets": [ { "alias": "Array Total", "dsType": "influxdb", "groupBy": [ { "params": [ "$__interval" ], "type": "time" } ], "measurement": "disk", "orderByTime": "ASC", "policy": "default", "query": "SELECT last(\"used\") AS \"Used\", last(\"free\") AS \"Free\", last(\"total\") AS \"Total\" FROM \"disk\" WHERE (\"path\" = '/rootfs/mnt/user0' AND \"host\" =~ /^$host$/) AND $timeFilter GROUP BY \"path\"", "rawQuery": false, "refId": "A", "resultFormat": "time_series", "select": [ [ { "params": [ "total" ], "type": "field" }, { "params": [], "type": "last" } ] ], "tags": [ { "key": "path", "operator": "=~", "value": "/.*user0/" }, { "condition": "AND", "key": "host", "operator": "=~", "value": "/^$Host$/" } ] } ], "title": "Array Total", "type": "stat", "hideTimeOverride": false, "interval": "", "timeFrom": null, "timeShift": null }
 If your a DB person then you'll love Grafana. I'm a SQL/DBA guy professionally, among other IT things. I'd say follow Gilbn's website for starters, but don't hold off on my account. I knew absolute zero when I first started and here we are... I have a second server that I will start from the ground up on and document each and every install step, It will take me some time, but I'll post it on page 1 once ready. I would say stick with installing the 3 main dockers (Grafana/Telegraf/InfluxDB) manually. Good luck!Thanks. I'll get that updated. I'm mulling over creating a FULL tutorial. Yeah, I'll just do it ha ha. Let me know if you need any help! Welcome to the community.I sure hope he's OK. That would be a shame! I'll let you know if I hear from him at all via a DM.Another really cool thing happened today. @SpencerJ has featured the UUD as the very FIRST recipient of the "Best of the Forum" blog.🥇 I wanted to personally thank him for writing up this article and for his continued support of our work. You can check out the blog post here. ☺️ https://unraid.net/blog/ultimate-unraid-dashboard
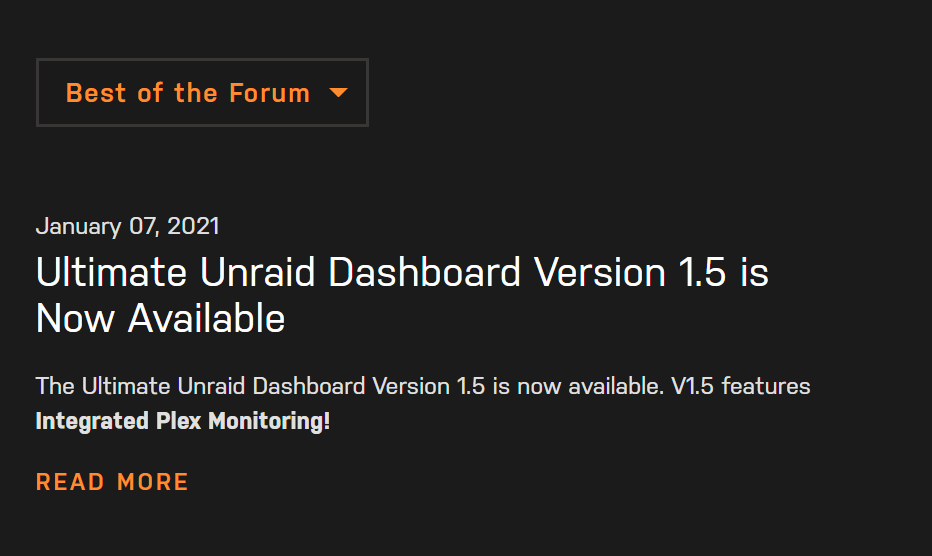 Fantastic man. I’ll dive into this and see if I can natively and easily incorporate this into the UUD version 1.6. Thanks for sharing your knowledge!Hi everyone. I am pleased how far the Ultimate UNRAID Dashboard has come since version 1.0 Since I started developing this thing, one of the most frequent questions I still get is "Do you have a way I can support you and the UUD? Do you have a donations page?" Even UNRAID themselves have asked this question when posting the UUD across social media platforms and the official newsletter. Up until now, I have not engaged in this kind of support because this was just a fun hobby I did in my spare time. Now that we are at version 1.5, supporting the UUD & assisting users with questions/issues/custom panels/1-on-1 virtual meetings, has become very time consuming. My Wife has even asked me "are you even getting paid for this?" ha ha. I blush and say no, it's not that kind of thing... However, I very much appreciate every single one of you and your positive feedback. And if you would like to officially support the UUD and my work, I have finally set up something for you. Click the link below to show your LOVE. There is still much more to come in future versions of the UUD, and I am already hard at work on version 1.6. Thanks again guys for your enthusiasm and support of this thing. It's been a fantastic experience!