


falconexe
Community Developer
-
Joined
Everything posted by falconexe
-
Not sure what is going on with your SSDs. I am not on 6.9+ so can't speak to how cache pools mess with the UUD. Regarding the Currency variable, that is something I adopted from @GilbN's unrelated dashboard in UUD 1.0 when I was first starting out with development. I just looked at my code and I am actually not using this anywhere that I can see, so I will remove that variable in UUD 1.7. From what I can tell, there is no way to dynamically set a unit from a variable. Since it is Legacy and does not apply to the UUD, I'll deprecate it. Thanks for pointing that out.
-
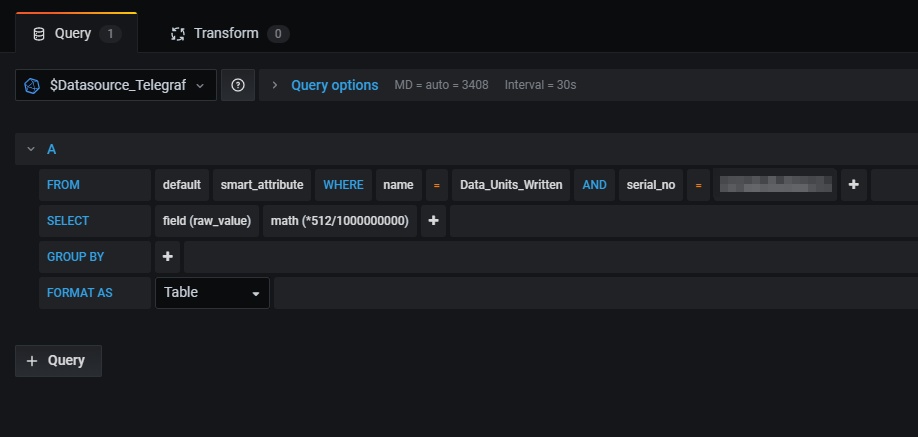
Here is the query for my "SSD Lifetime Writes". Not sure what is going on with yours, but the math function looks different and check your data source in the upper left. Also, follow the instructions here. You need to multiple by the LBA size and then divide to get TB. You are doing a LOT more in your math function.
-
Select the correct serial number in the FROM clause. The variables so not drive these panels (as I noted in the release post).
-
Nice, glad you are getting some use out of it. SAVAGE!
-
Set your dashboard to the last 5 minutes and see if it goes away. Keep in mind that device IDs get used/reused/swapped upon reboot. If you go back a year for instance, you *may* see duplicates depending on a number of factors.
-
For all those having issues with the images, please see the post right after the release post. You need to adjust the IP address in the query (server) and the Base URL in the plugin. For those who are having issues with the UNRAID API even showing data (on its own web page), please ensure you log in with "root" and that password. Please also pay attention to the HTTPS checkbox. If you get this wrong, it will not work! Give it a few minutes. If you are still not having success, try stopping and restarting the docker. If that does not work, completely blow away the docker AND APP DATA folder for the docker, and try again with "root" and the correct level of security (checkbox). If all else fails, please report the NON UUD issue to the topic forum that handles that Docker.
-
Nice!
-
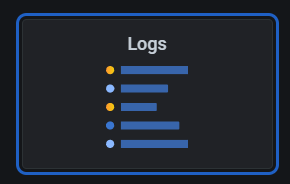
DEVELOPER UPDATE - UUD 1.7 Alrighty. Here's what I'm thinking is going to be the main focus of UUD 1.7. I personally would like to get a rolling LOG panel that directly reflects the UNRAID real time log. I've read some stuff in passing about an external log server, or even logging on the same server to flat files via the same method. The purpose being, if your server hard crashed, you'd have a record of what caused it before the logs got wiped on reboot. So, I need some help here and need to be pointed in the right direction to make this happen. It may not be possible, but I want to give it a shot. Here are a few requests: 1. Has anyone ever setup a "log server" for their UNRAID box. If so, how did you accomplish this? What dockers, plugins, etc. did you use? 2. Has anyone ever messed with the "Logs" panel in Grafana. I suspect this is how I would present that data. 3. Does anyone already have this as a working solution and would like to share?
-
This did not work for me. SSL seriously breaks the auto grabbing of the images. No worries. At least we have the authentication workaround. I banged my head off a wall for hours when I was first messing with this. It should just work I was thinking, and finally discovered the authentication loop that fixed it. 🙄 😂
-
And just for the record, since so many have posted my IP address (because I left it in the code to help you), I'm not even going to try and mask that any more LMAO. 😆
-
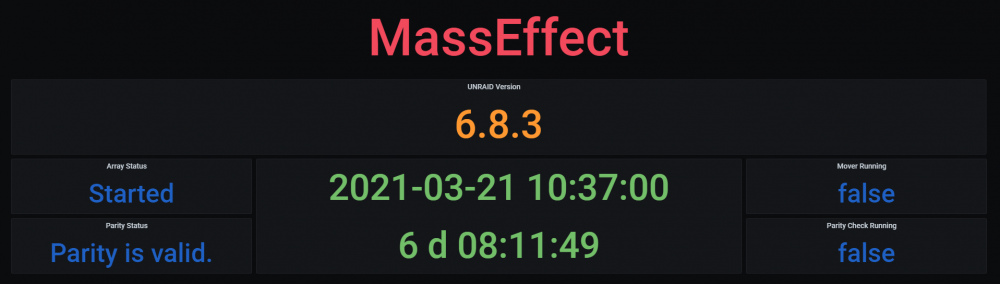
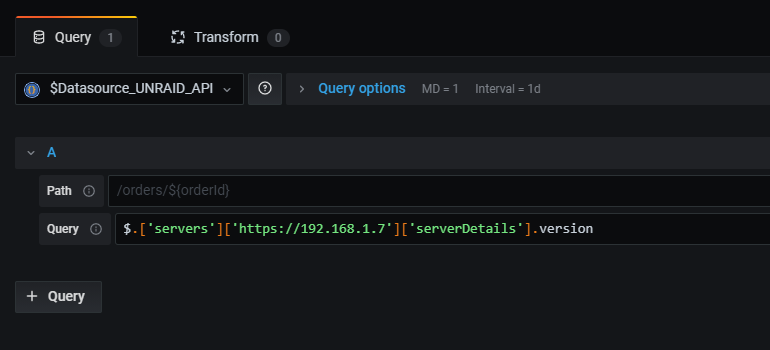
Hey guys. I'm playing around the UUD 1.7 development and I just added something that many will find useful to the UUD header. You'll noticed the UNRAID version is available from the API. Here is query and JSON if you want to add it now. 😊 { "datasource": "$Datasource_UNRAID_API", "fieldConfig": { "defaults": { "custom": { "align": null, "filterable": false }, "unit": "decbytes", "color": { "mode": "fixed", "fixedColor": "orange" }, "thresholds": { "mode": "absolute", "steps": [ { "color": "blue", "value": null } ] }, "mappings": [] }, "overrides": [] }, "gridPos": { "h": 4, "w": 12, "x": 6, "y": 4 }, "id": 320, "links": [], "maxDataPoints": 1, "options": { "reduceOptions": { "values": false, "calcs": [ "last" ], "fields": "/.*/" }, "orientation": "auto", "textMode": "auto", "colorMode": "value", "graphMode": "none", "justifyMode": "center" }, "pluginVersion": "7.3.7", "targets": [ { "cacheDurationSeconds": 300, "fields": [ { "jsonPath": "$.['servers']['https://192.168.1.7']['serverDetails'].version", "name": "" } ], "queryParams": "", "refId": "A", "urlPath": "" } ], "title": "UNRAID Version", "type": "stat", "cacheTimeout": null, "description": "", "hideTimeOverride": false, "interval": "", "timeFrom": null, "timeShift": null }
-
Yep it sure was. LAYERS upon layers...
-
@helvete Read the post right after the UUD 1.6 release post. I also posted a MEMORANDUM a few posts back about "CRITICAL INFORMATION". Please read that.
-
@ElectricBrainUK Just wanted to say thanks for the UNRAID API docker! Great work and UUD 1.6 would not have been possible without you and your work! I sincerely appreciate it!
-
Thanks. I'll give this a shot with my SSL setup. Adding the port may fix it. Stay tuned...
-
You don't need the home assistant addon. Just install the docker from CA. Load the webpage, enter your server IP and credentials. Wait about 2 minutes, refresh, and you should see info on the API webpage. Once you see it there, you should see it in Grafana provided you have your datasource and queries correct.
-
Yeah, good point. Was just trying to get the info out the door quickly. Once I post the release info, I have to scramble to update post #1 and actually release the code before someone asks “where’s the download”. @SpencerJ Just glad our forum platform can handle MEGA POSTS in memory with tons of screenshots without crashing. I would have been devastated yesterday. I spent 4 hours putting these posts together while cross referencing development notes, testing, validation, screenshots, and screenshots editing. It’s a massive job. I appreciate the help!
-
Nice. Can you screenshot your base URL with this fix for everyone to see? You can sensor your IP. Everyone know’s mine LOL.
-
DEVELOPER UPDATE: Hey everyone. I hope you are enjoying UUD 1.6 so far. I just wanted to let you know that I added some CRITICAL INFORMATION to the post right below the actual 1.6 release post. Please READ IT or you will end up with some "fun" stuff occurring. Let me know if you have any questions. By the way, because I know someone will ask, because they always do.... For the link I posted above, click the arrow in the UPPER RIGHT CORNER of the picture to go the actual post I am referencing. If you click the link/pic itself, it will just take you to the main UUD page/post 1.

-
You can modify the SSD variable to allow for a multi selection. However, the panels are currently designed for just a single SSD. You can adapt my code as needed. Furthermore, you could potentially even get this to work with CACHE POOLS (Added in UNRAID 6.9+).
-
For Docker/VM Images, see this post: For the SSD health panels, you will need to select your SSD Serial Number in the query by editing the panel.
-
Check the post right below the release post. Here is the link:
-
Check the post right after the release post. Here is the a link:
-
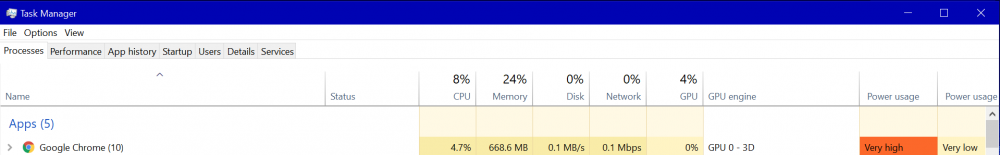
That really depends on a LOT of factors including how many panels you have, how far back the data is being queried for, what kind of browser you use, and how good your CPU is. Here is a snapshot of my average load going back 24 hours: On refresh it peaks at about 1GB of RAM and 25% CPU for about 10 seconds. Download it and give it a shot.
-
@SpencerJ Feel Free to launch the social media and web campaigns LOL.


