


falconexe
Community Developer
-
Joined
Everything posted by falconexe
-
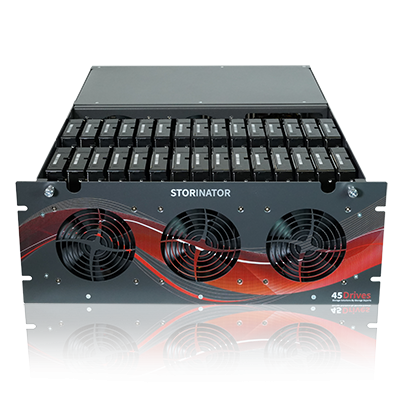
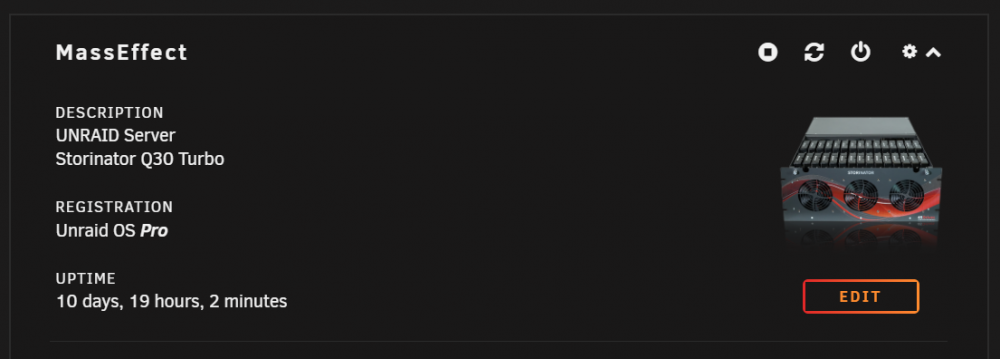
Thanks. I appreciate the info. I have a Storinator Q30 Turbo as my primary server, and want to move an old NORCO 4224 (my backup server) to their much nicer chassis for heat flow, but use the same guts. I was also looking to drop a RTX 3080 into one, once I upgrade my main gaming rig to the RTX 4000 series later this year (or next). Let me know if you figure out how to drop in a full size Nvidia video card. I'd love to see pics and the complete component breakdown.
-
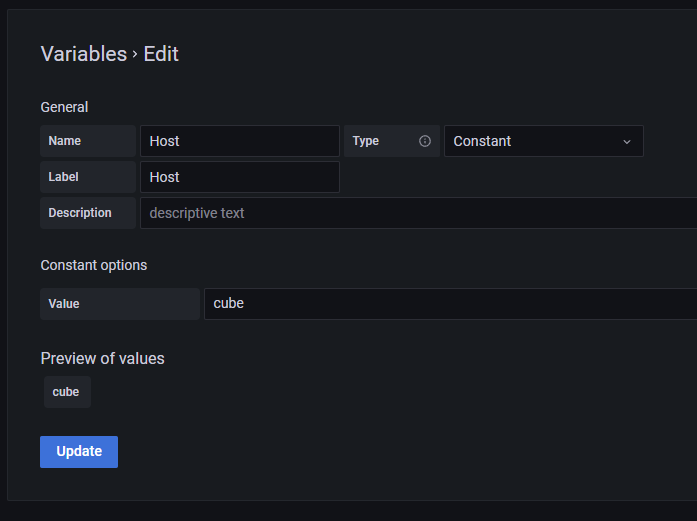
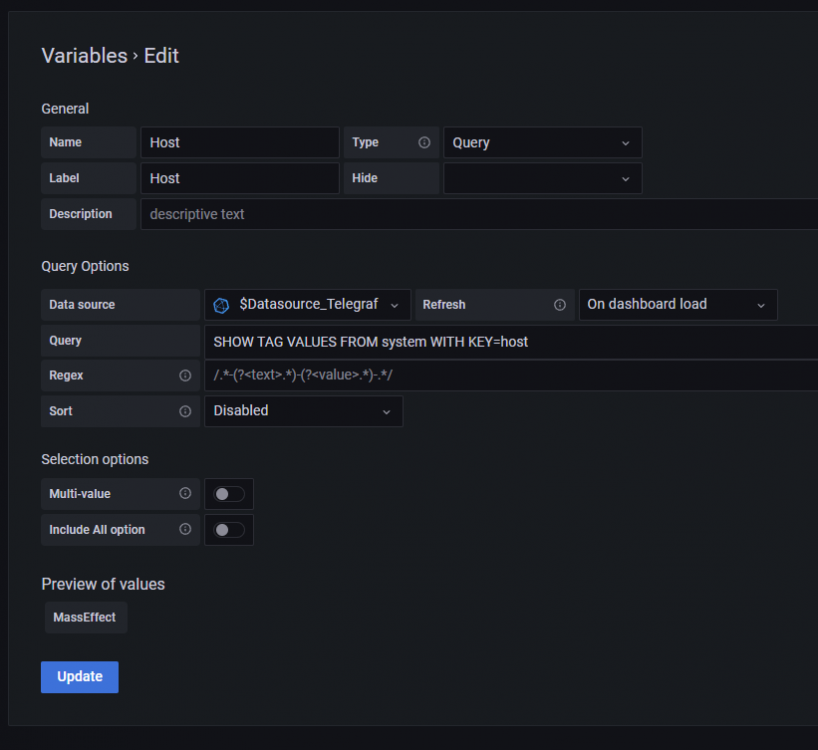
Try setting your host variable manually to a constant and see if that changes anything. If you are only running 1 UNRAID server, then you can safely do this. Not sure what is going on, but the below work around should fix it.
-
Check your "Host" variable in the dashboard by clicking the gear icon in the upper right. You should see the following and your host name at the bottom in the Preview area.
-
Glad you figured it out. I would have answered sooner, but was buy with life. This was addressed numerous times within this post. Next time, try searching "This Post" and you will usually find the answer right here.
-
@skaterpunk0187 Congrats 🎉:

-
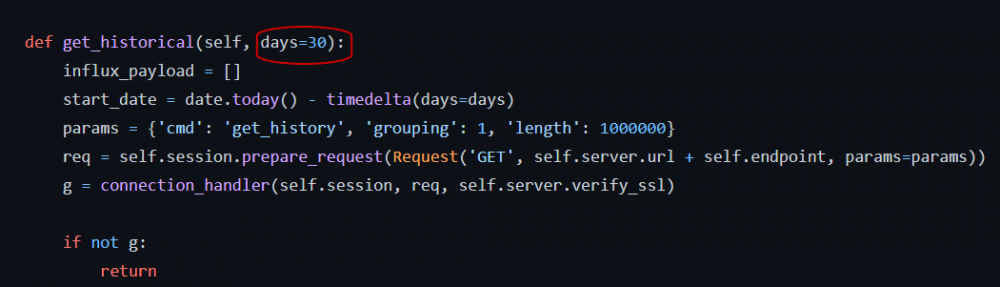
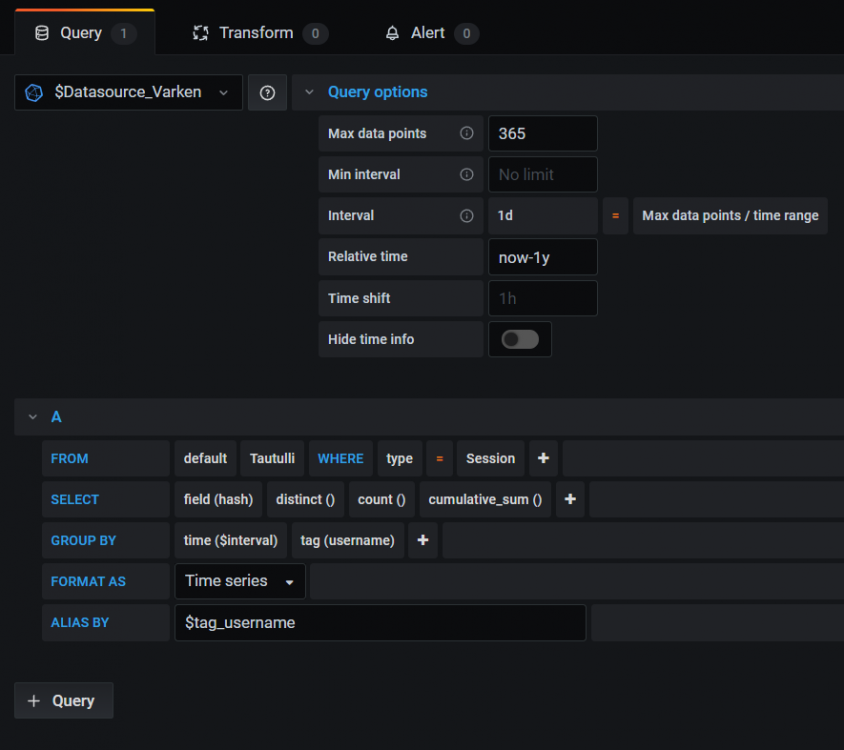
Thanks for the tip. I just setup a GitHub for the UUD. Never done this before, but I am a programmer, so I should be able to figure it out. Anyone know if the creator of Varken "Boerderij" is on the forums here? I just need an option to pull in ALL historical Tautulli data upon installing Varken, or pass some kind of parameter to the docker to choose the earliest load/retention date for an existing install. Or better yet, run a command in InfluxDB to ingest everything from Tautulli via Varken going back to day one (brute force the database). I assume all of this is possible. Maybe I can fork the entire thing and just modify this single "tautulli.py" file as @skaterpunk0187 suggested... https://github.com/Boerderij/Varken/blob/master/varken/tautulli.py Heck, I'm even considering making my own UUD docker! I've never done that either, but I installed GUS a couple days ago and learned a lot from the way @testdasi did it. Not sure if he is still around, as he's been silent for over a year on this stuff. @SpencerJ, do you know anyone or any good documentation that can assist me getting started with making a docker for the UUD and incorporating everything into it (other dockers/settings), so I can make this easier for everyone to install out of the box? It would be really awesome of I could release the UUD 1.7 in it's own docker with native Grafana 8.4.X support, and then people would only have to modify their Grafana panels and never mess with a config file again. I think this would bring the UUD to the masses and it would sure make updating it much easier with different docker builds for past versions. Anyone down with this? Anyone want to help and guide me through the docker build process? DM me if you want to collaborate and take me to school ha ha. Otherwise, I'll try to learn this new stuff in my spare time. But this is the vision I see for the future. One click install of the UUD and then just customize for your UNRAID server.
-
Does anyone know of a way to backload ALL Historical Data from Tautulli into InfluxDB via Varken (or another API/plugin)? I have data going back years in Tautulli, and I would love to access it all through the UUD. I did some research and everything I have seen is no this is not possible. If you have seen this as a viable option, please let me know and I will add it.
-
Thanks for confirming guys!
-
Yeah right now I am focusing UUD 1.7 on native Grafana 8.4 support. I still do not see a compelling reason to go to InfluxDB 2.0 yet. Thanks for your reply!
-
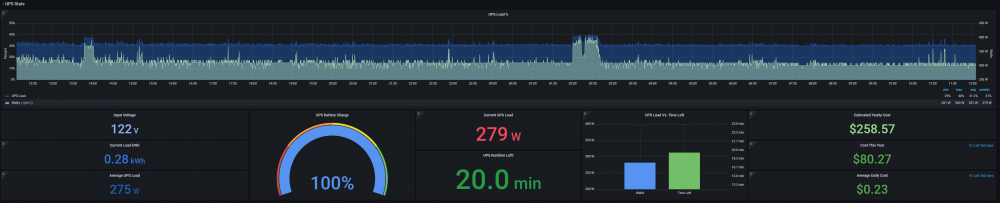
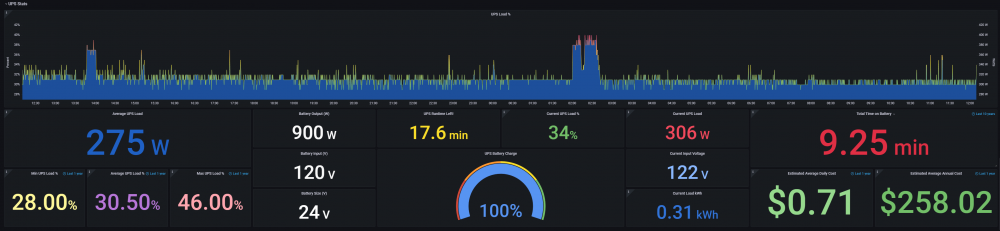
Giving the UPS Stats some Grafana 8.4 love. Did did some house cleaning, added new panels, updated/fixed existing panels, and added a new fresh style. New: Old:
-
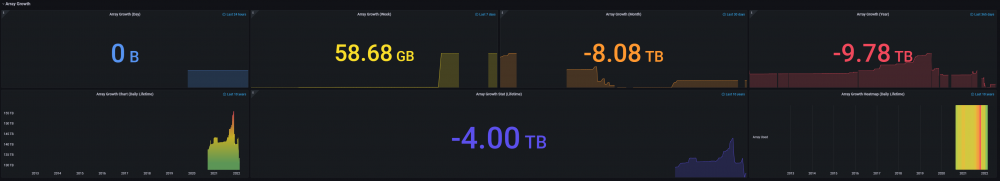
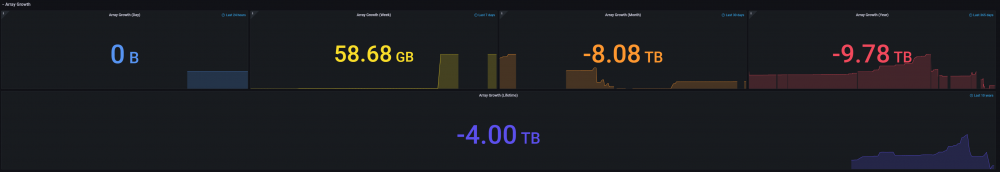
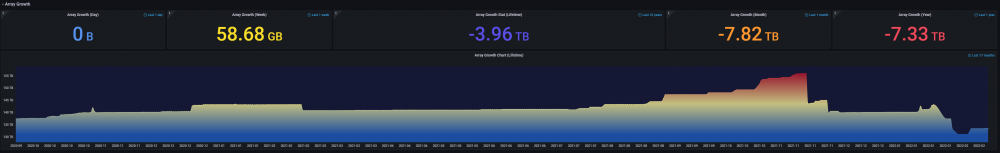
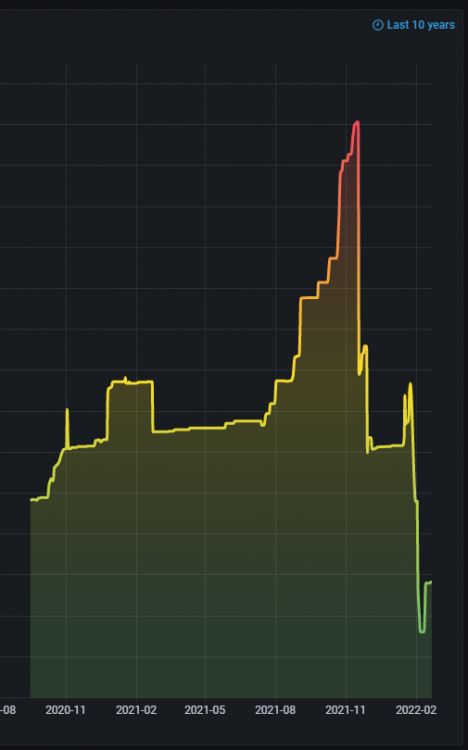
I ended up settling on this for array growth. I was tired of the data gaps in the Stat Panel Spark Lines. This is super clean and Grafana 8.4 brings A LOT more customization options.
-
I'm coming in HOT 🎶 🔥😂

-
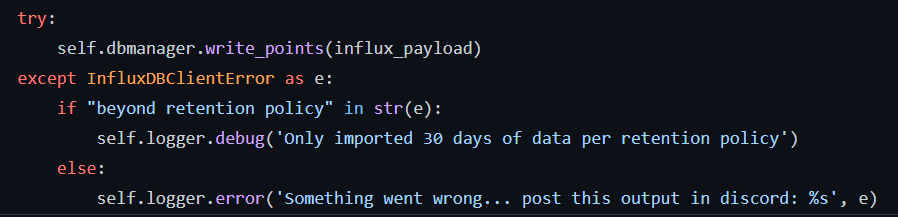
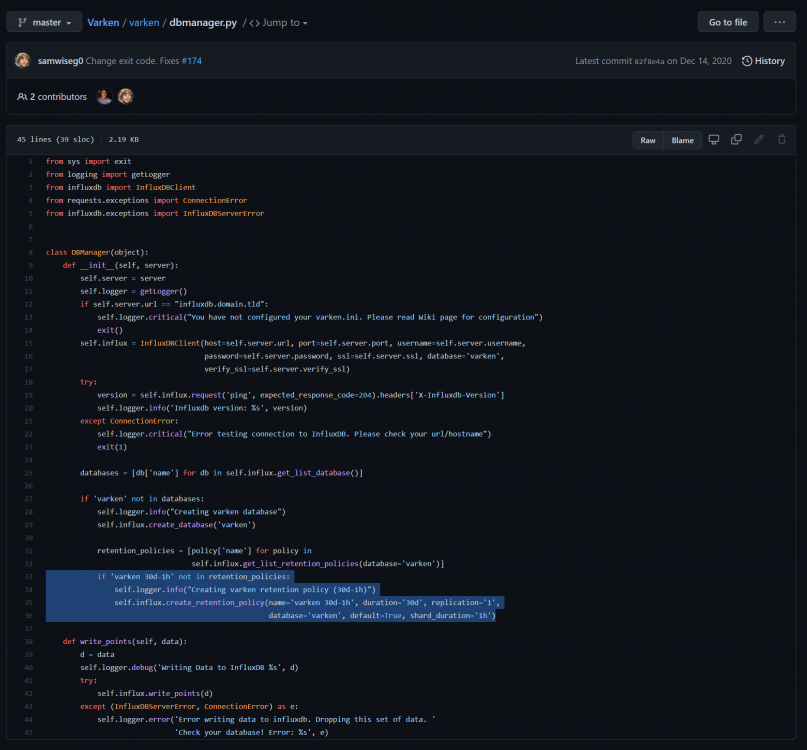
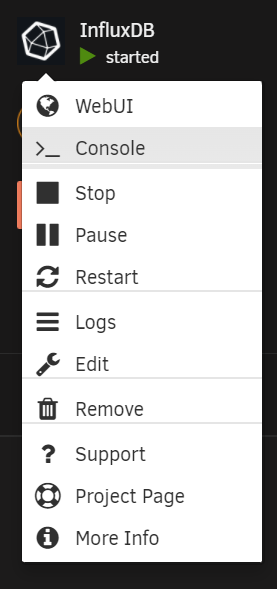
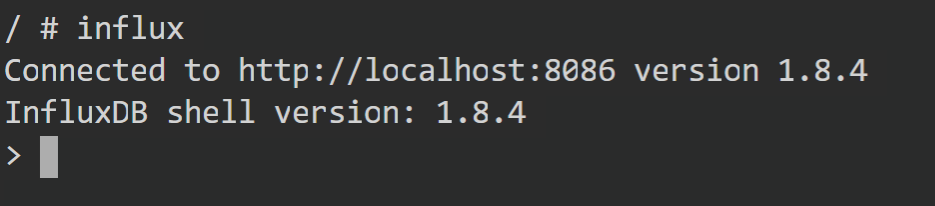
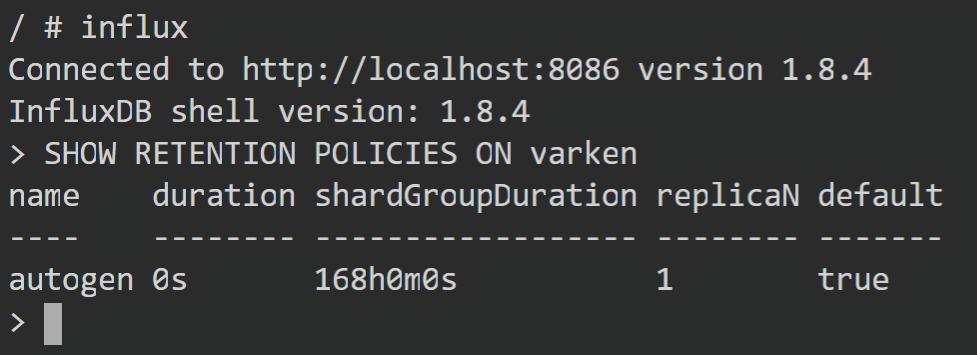
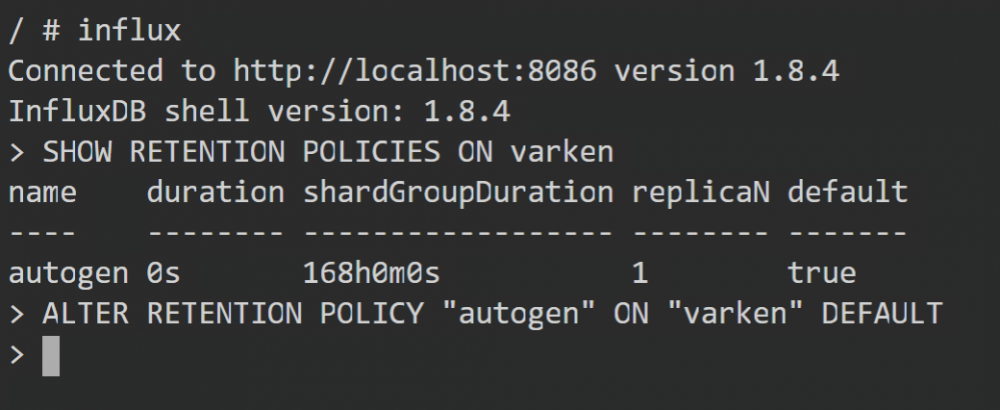
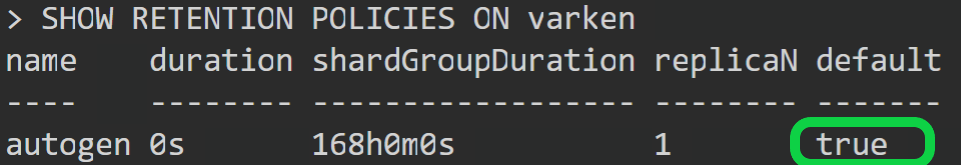
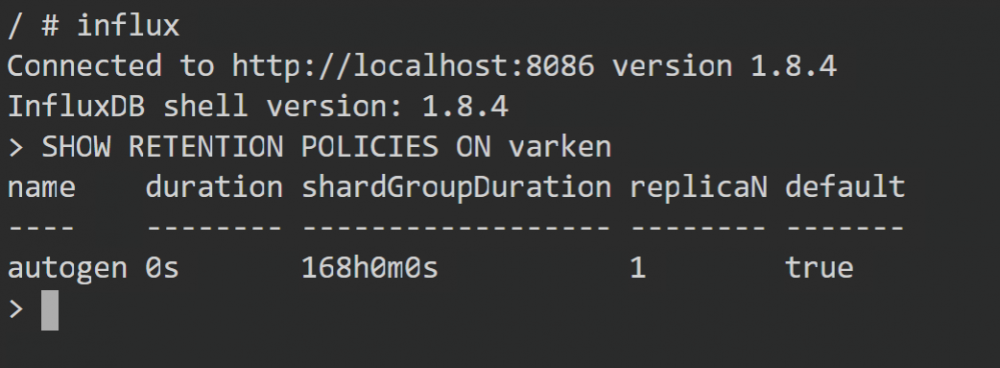
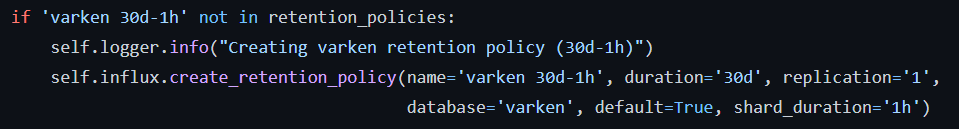
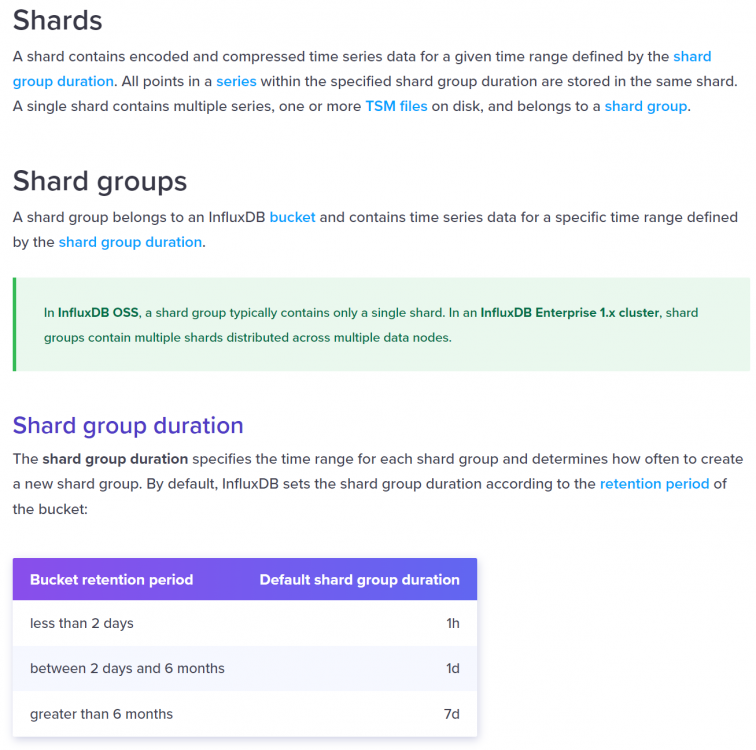
DEVELOPER UPDATE - VARKEN DATA RETENTION Something else I wanted to bring to your attention in VARKEN... For the life of me, I could not figure out why my Plex data was only going back 30 days. It has been bothering me for a while, but I did not have a ton of time to look into it. Yesterday, I found out the issue, and it really stinks I did not find this sooner, but the sooner the better to tell you ha ha. While looking into the InfluxDB logs, I found the following oddity: All queries were being passed a retention policy of .\"varken 30d-1h\". in the background! So apparently when Varken gets installed, it sets a DEFAULT RETENTION Policy of 30 days with 1 Hour Shards (Data File Chunks) when it creates the "varken" database within InfuxDB. This can be found in the Varken Docker "dbmanager.py" Python install script here: https://github.com/Boerderij/Varken/blob/master/varken/dbmanager.py InfluxDB Shards: https://docs.influxdata.com/influxdb/v2.1/reference/internals/shards/ What this means is InfluxDB will delete any Tautulli (Plex) data on a rolling 30 days basis. I can't believe I didn't see this before, but for my UUD, I want EVERYTHING going back to the Big Bang. I'm all about historical data analytics and data preservation. So, I researched how to fix this and it was VERY SIMPLE, but came with a cost. IF YOU RUN THE FOLLOWING COMMANDS, IT WILL PURGE YOUR PLEX DATA FROM UUD AND YOU WILL START FRESH BUT IT SHOULD NOT BE PURGED MOVING FORWARD (AND NOTHING WILL BE REMOVED FROM TAUTULLI - ONLY UUD/InfluxDB) You have a few different options, such as modifying the existing retention policy, making a new one, or defaulting back to the auto-generated one, which by default, seems to keep all ingested data indefinitely. Since this is what we want, here are the steps to set it to "autogen" and delete the pre-installed Varken retention policy of "varken 30d-1h". STEP 1: Bash Into the InfluxDB Docker by Right Clicking the Docker Image on the UNRAID Dashboard and Select Console STEP 2: Run the InfluxDB Command to Access the Database Backend Command: influx STEP 3: Run the Show Retention Policies Command Command: SHOW RETENTION POLICIES ON varken You should see "varken 30d-1h" listed and it will be set to default "true". STEP 4: Set the autogen Retention Policy As the Default Command: ALTER RETENTION POLICY "autogen" ON "varken" DEFAULT STEP 5: Verify "autogen" is Now the Default Retention Policy Command: SHOW RETENTION POLICIES ON varken "autogen" Should Now Say default "true" "varken 30d-1h" should now say "false" STEP 6: Remove the Varken Retention Policy Command: DROP RETENTION POLICY "varken 30d-1h" ON "varken" STEP 7: Verify That Only the "autogen" Retention Policy Remains Command: SHOW RETENTION POLICIES ON varken Once you do this, your UUD Plex data will start from that point forward and it should grow forever so long as you have the space in your appdata folder for the InfluxDB docker (cache drive). Let me know if you have any questions! Sources: https://community.grafana.com/t/how-to-configure-data-retention-expiry/26498 https://stackoverflow.com/questions/41620595/how-to-set-default-retention-policy-and-duration-for-influxdb-via-configuration#58992621 https://docs.influxdata.com/influxdb/v2.1/reference/cli/influx/ @SpencerJ @GilbN


-
Lots of changes in Grafana 8.4, but so far here are the comparisons and new features I'm delivering. You'll notice some new heatmap/gradient graphs for lifetime array growth 🔥 Header Now: Header Before: Array Growth Now: Array Growth Before:
-
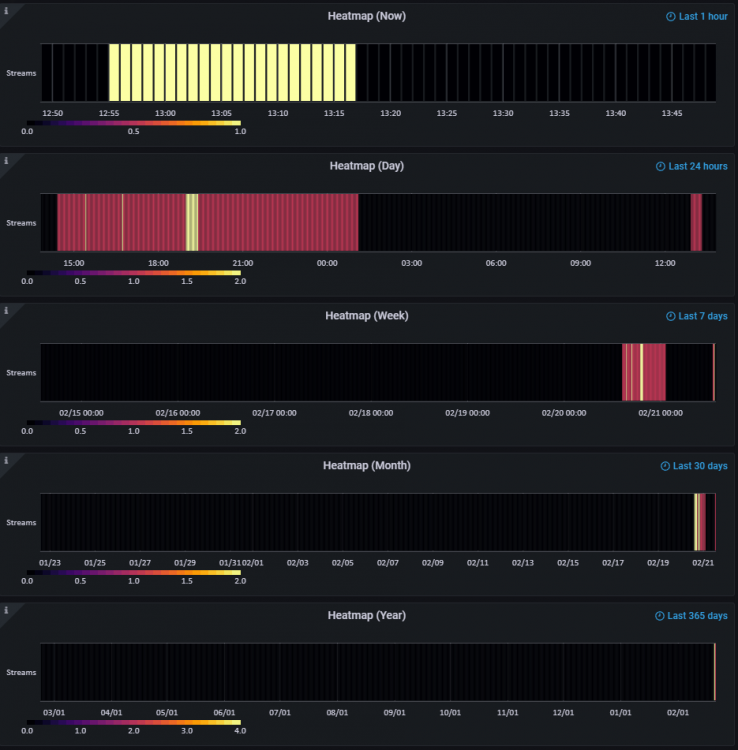
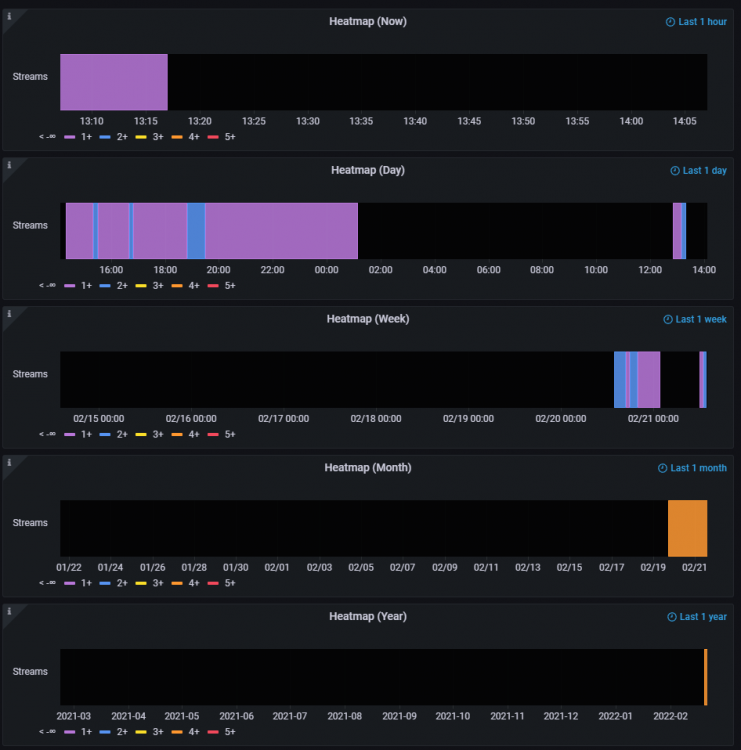
New Plex Stream Heatmaps: New: Old:
-
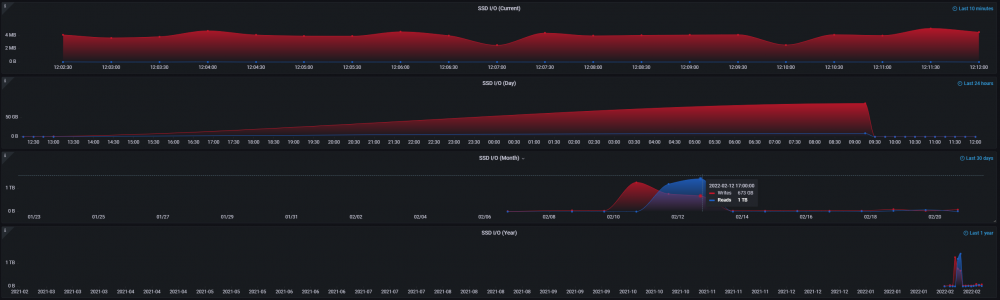
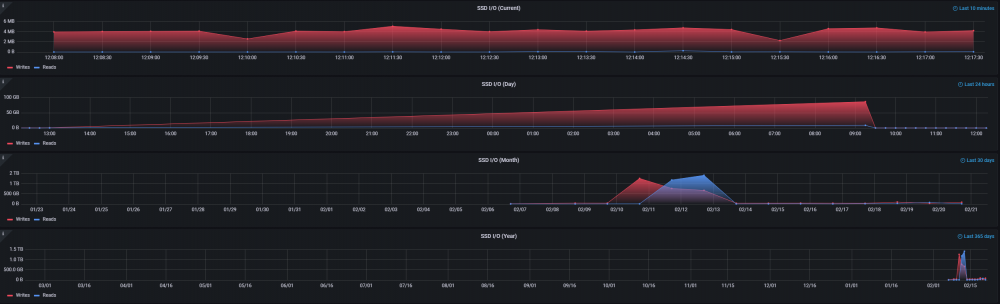
Here are the "Migrated" curved Cache graphs without Gridlines or Legends (now mouse-over tooltips). This look is a pretty clean design. I like it... New: Old:
-
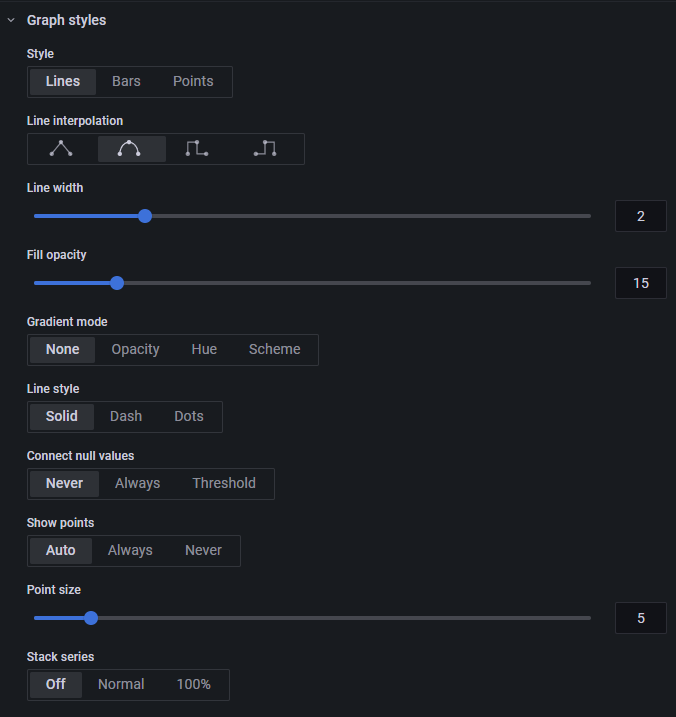
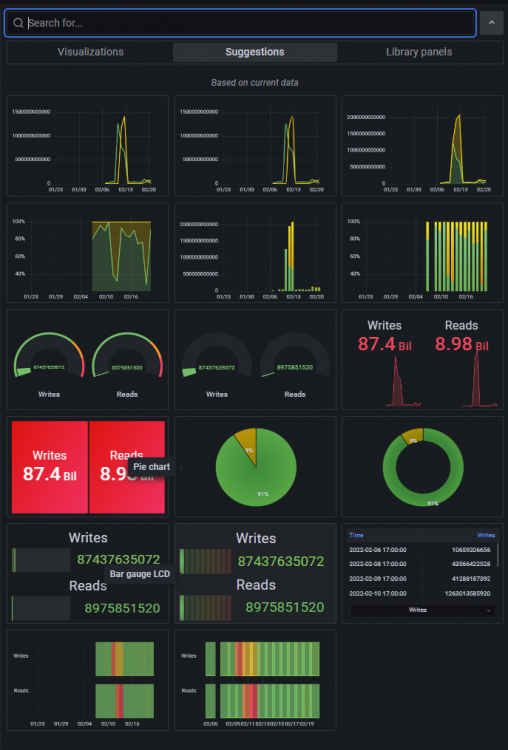
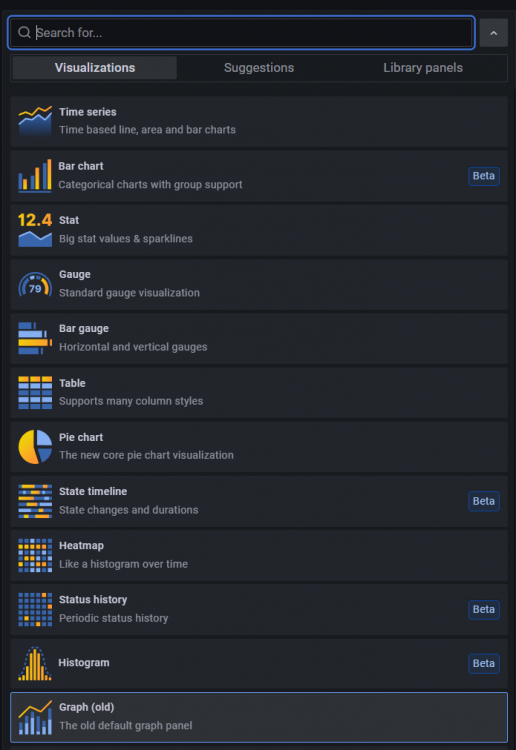
I will say this about Grafana 8.4. There are some really slick features in it with A LOT more variety. They will even suggest new styles of panels based on the current data. Pretty cool so far. I am making good progress on fixing what broke. Not too bad so far... some panels even have a migration assistant. Panel Migration: New Curved Line Graph (Among Other Line Interpolation Options): New Gradient Line Graph: New Panel Suggestions Based on Current Data:
-
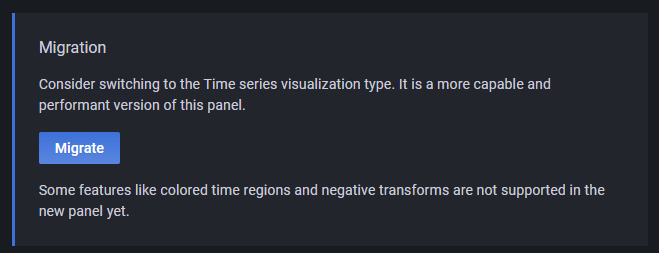
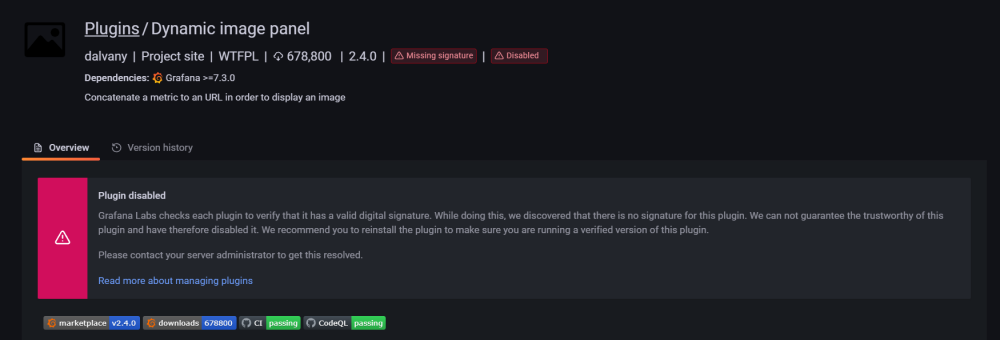
DEVELOPER UPDATE: The recent Grafana Docker update is causing a number of issues with the UUD. Some Panels are entirely broken, and Plugins that the UUD utilizes have been disabled due to security concerns. Furthermore, Grafana has deprecated entire panel types in favor of new versions of the same panel types. Example: "Graph" (OLD) is Now "Time Series" The Grafana 8.4 press release can be found here: https://grafana.com/blog/2022/02/17/grafana-8.4-release-new-panels-better-query-caching-increased-security-accessibility-features-and-more/?utm_source=grafana_news&utm_medium=rss If you choose to update to Grafana 8.4, be prepared to make some adjustments. Sadly, it looks like this will be the end of the UNRAID API/Dynamic Image Panel functionality (unless the plugin developer gets it signed by Grafana and they update it.) If/When I release UUD 1.7, it will be based on Grafana 8.4+. @SpencerJ @GilbN
-
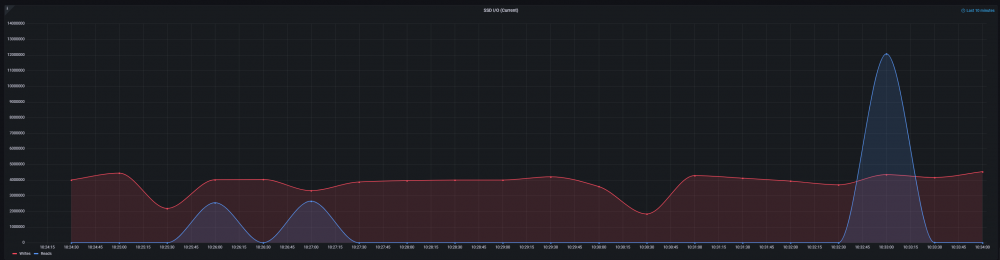
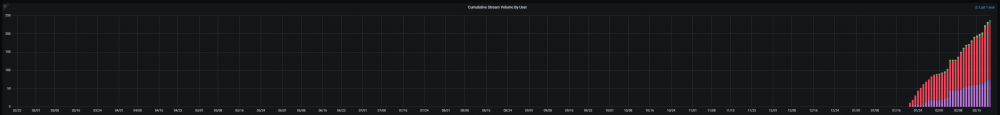
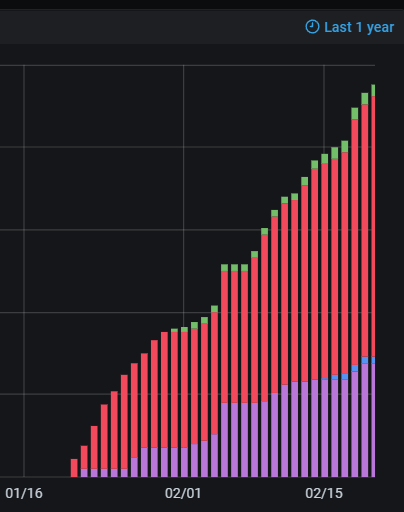
New Plex Panel: Stacked Bar Graph - Cumulative Stream Volume By User (Last Year):
-
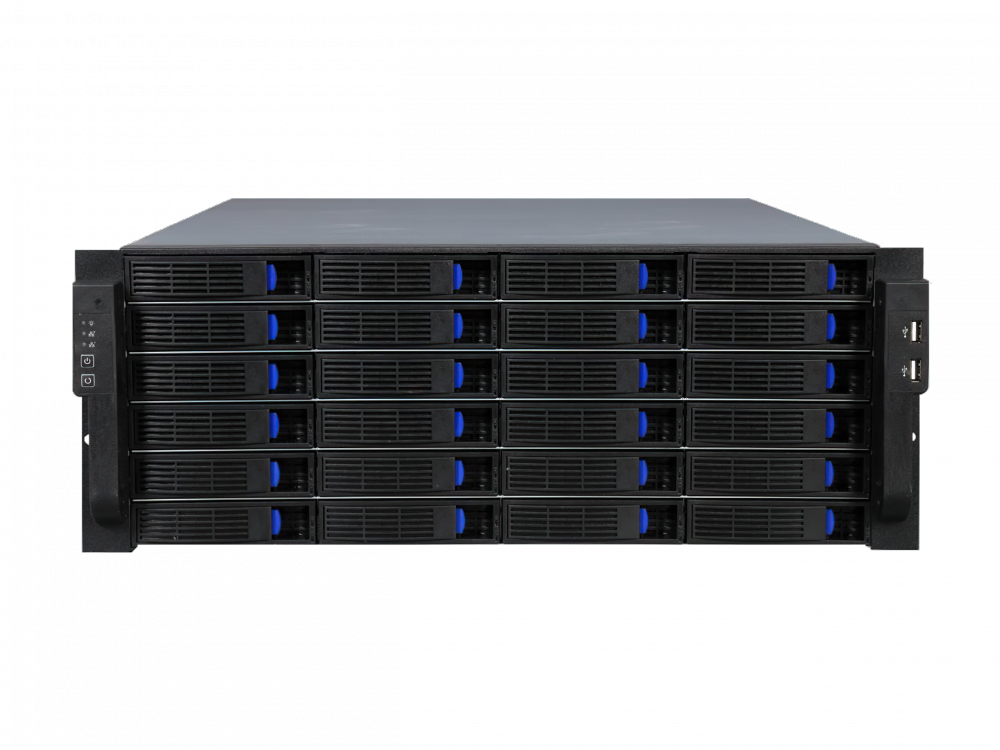
45 Drives - Q30 Storinator (30 Bay) Norco 4224 (24 Bay)
-
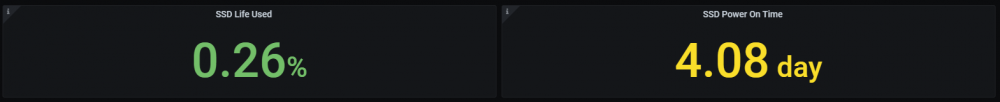
So I had a thought about a new Stat Panel that would be REALLY COOL. Unfortunately, it seems that it may not be possible with InfluxDB 1.X using InfluxQL, but it MAY be possible using FLUX on InfluxDB 2.X. I will lay it out for you here, as I think it is a VERY USELFUL STAT that people would want to know. Basically it involves math concepts that are NOT SUPPORTED (from what I have researched) by the technology the UUD runs on currently, but I'll show you how to calculate this manually. I'm hoping eventually I can add this specific stat to the UUD. Starting Metrics: Math Calculation: 100% / 0.26% = 384.62 Slices of 100% 384.62 Slices * 4.08 Power On Days = 1,569 Days 1,569 Days / 365.25 (1 Year) = FINAL METRIC = SSD Life Left (Time) 4.295 Years of SSD Life Left! So at any given time, you can dynamically calculate WHEN your drive will EXCEED the Manufacturer's TBW limit from the 2 above stats (the total current TBW is already calculated in the "SSD Life Used Panel"). Of course this date will change greatly, and in real time, depending on how your drive is utilized. Dump 100TB in a week and the estimated replacement date will be much sooner. Only use it for Cache appdata, then it will likely trend upward and you'll get longer life with a date far in the future. Theoretically, this future date is when you should start looking to replace the drive. I suspect once it gets within days, it will be VERY ACCURATE. Even though this calculation is pretty straight forward, such things are not permitted in InfluxQL. If I ever figure this out natively in a Stat Panel, I will definitely add this to the UUD! Let me know your thoughts! @SpencerJ @GilbN
-
Nice! Thanks for sharing. I have a beast of a server, so I am not surprised I am higher than you. My UUD is also stacked with panels and I have made some personal modifications to mine that suck even more data in. I hope you are enjoying the UUD man.
-
Interesting tidbit... Without writing to Cache in any way (array operations) for 24 hours, I seem to be hitting 300-400 MB of writes per hour, and roughly 40GB per day, with just my running dockers. I suspect most, if not all of this, is Telegraph/InfluxDB/Grafana. For anyone else using the UUD, are you seeing similar metrics? For my SSD, I have a manufacturer's suggested lifespan of 1200 TBW. If I did nothing but run appdata stuff (and never used the Cache for array activities), my drive would last roughly 82 years at this rate. Even if I wrote 1TB a day with array activity, it would still last 3.28 years. So I guess this puts to rest the fear of wearing out an expensive SSD Cache drive because of something cool like the UUD.

-
Welcome and thanks. You will need to adjust each panel by editing it and selecting the appropriate sensor for each panel. Assuming you have everything setup correctly in the config file, and have loaded the sensors package, everything you need to adjust is in Grafana within the UUD dashboard panels. Please search this forum topic for "Sensors" or "AMD" for many previous examples of how to accomplish this. Good luck!
-
This is the new header of UUD 1.7. It is sleeker with more info laid out in a balanced design with everything pertinent to UNRAID server health at a glance. If something bad is going down, you will see it here first. 😁


