


falconexe
Community Developer
-
Joined
Everything posted by falconexe
-
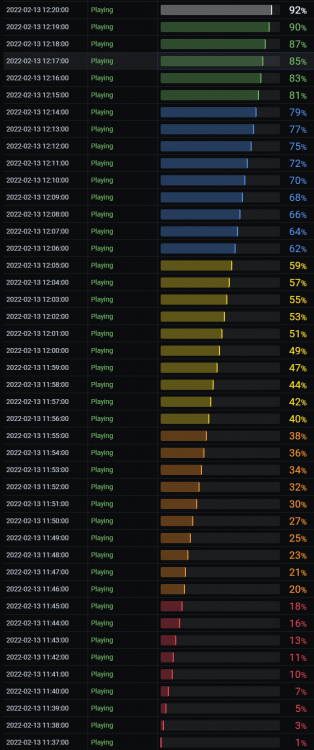
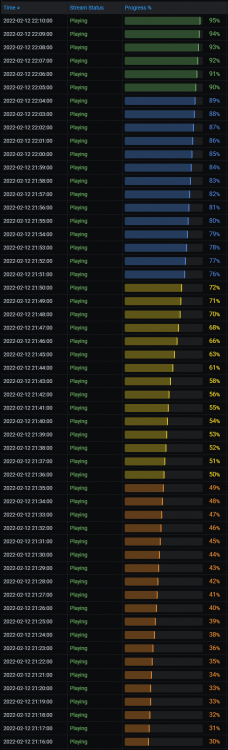
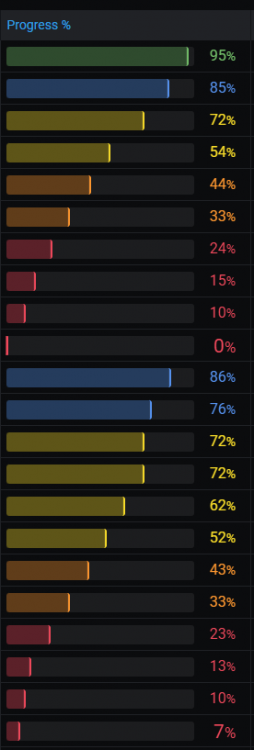
Alright, after reviewing historical data, I have determined that 92% completed is considered "watched" and is about where people decide to bail on the credits. This seems to hold true for all types of media. So, in order to get this granularity, I did go back to 1 minute intervals and adjusted the thresholds accordingly. You end up with all of the colors on a clean stream which looks like this. Now that I have this dialed in, I am moving on to something else.
-
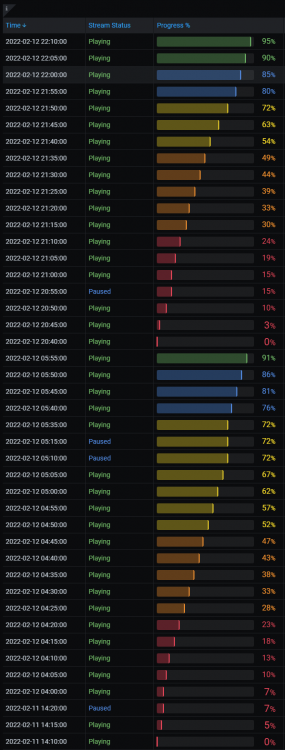
And if you really want to get detailed, here it is at every 1 minute, and 5 minutes. For me, it looks like every 5 minutes is the sweet spot. Every Minute: Every 5 Minutes:
-
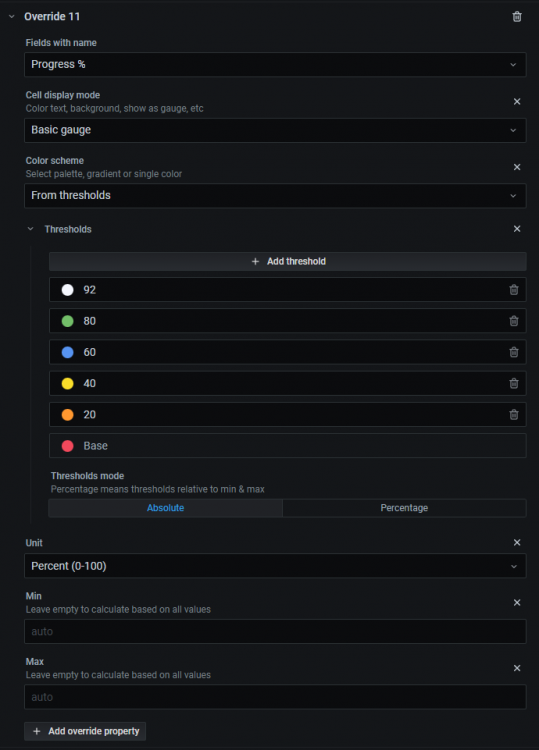
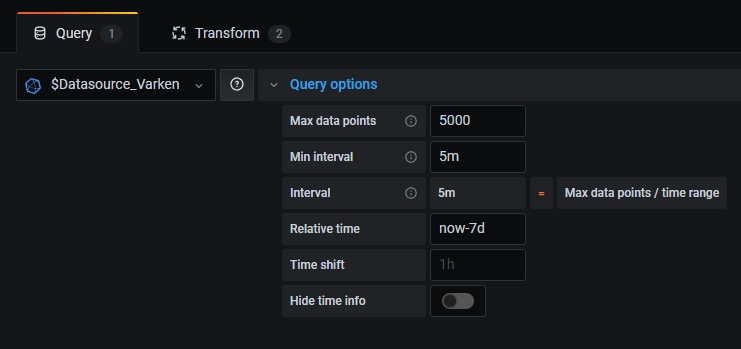
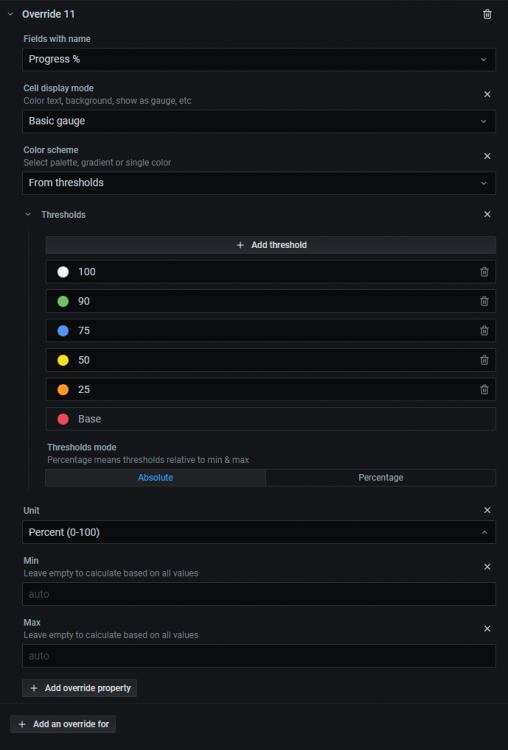
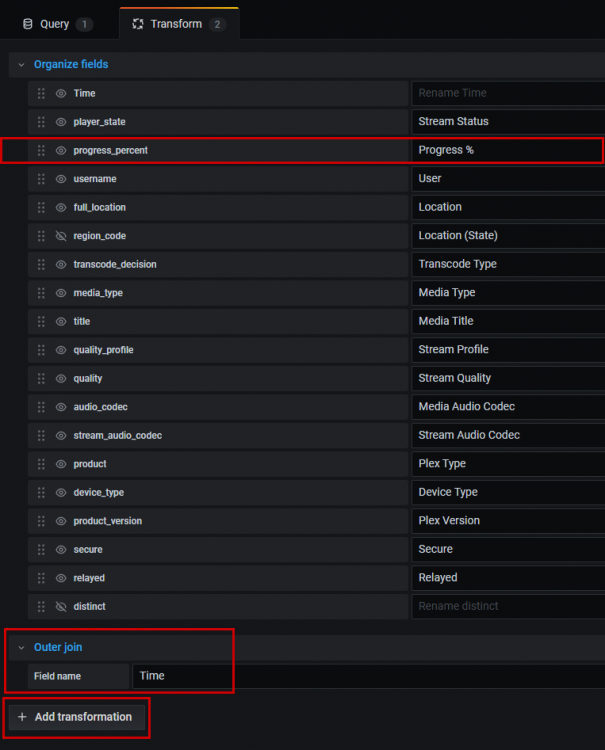
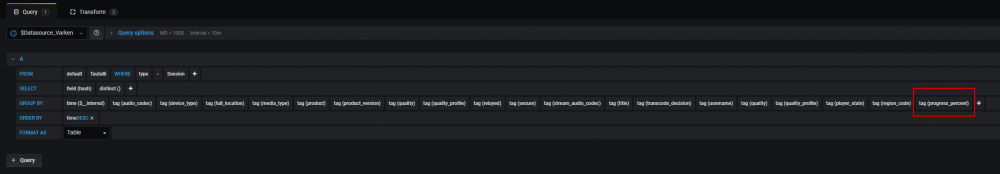
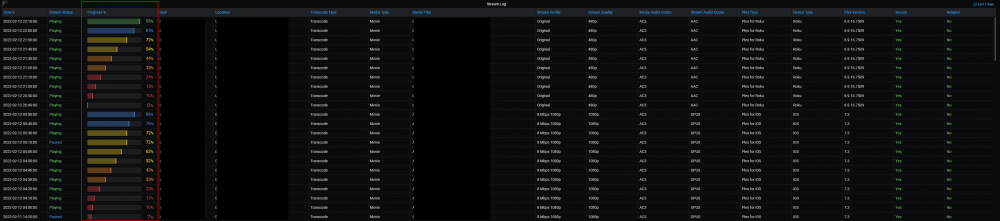
Dude, I'm really freaking pumped!!! I FINALLY figured this thing out that has been bugging me for over a year. Remember how I added a Plex Log with real time statistics of streams? Well I suppressed the % Viewed because I could never get it to work right. The issue was that over the 10 minute timeframe (each single data point = 10 minutes), there would be multiple values for % Viewed. For instance, if 1% equals 1 minute, you would have 10 different percent viewed data points (rows in the table) for that single time data point like 12:10 (X10 Percent Viewed rows between 12:00 - 12:10). Needles to say, this was freaking ugly because it would 10X the data for each data point. So instead of 6 rows for an hour, I would end up with 60 (per user)! Tonight, I bring you the FINISHED PLEX Log with TRUE gradient gauge coloring based on ACTUAL % Viewed, and only 1 Data Point for Each 10 Minute timeframe per user. Viola! Here is what you need to do in order for this to work correctly. To Get the Progress % to Show Up Only Once For Each 10 Minute Period: Add the "tag_progress_percent" Field to the Table: Add a Table Transformation of OUTER JOIN By "Time" Which Reduces Multiple Data Points That Equal the Same Time in a Series, and Instead Shows Only the Last Value at that Time. To Get the Sweet Dynamic Color Gauges Based on Actual Percent Viewed: Add a Field Override to the Field "Progress %" with the Following Settings: @SpencerJ
-
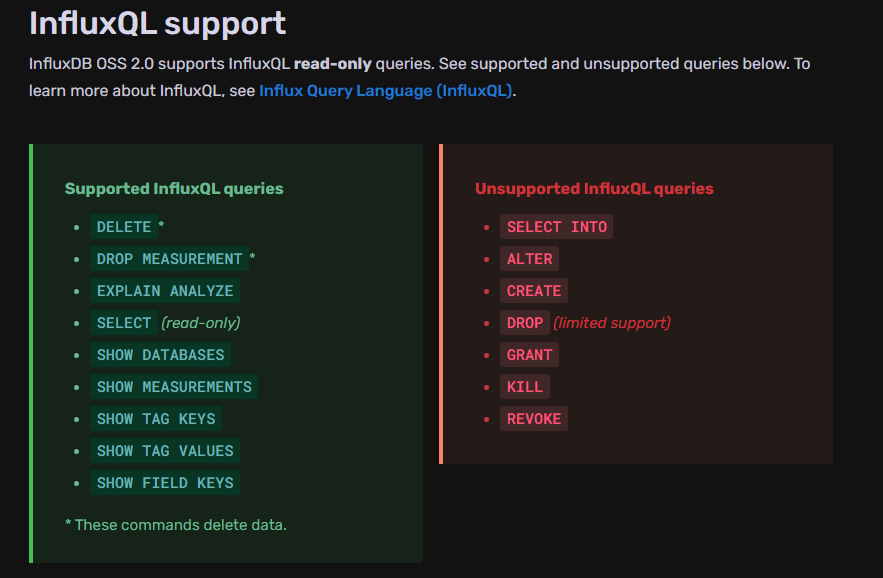
So I looked into InfluxDB 2.0 and it uses a new query language called "Flux". So far, I have not seen any advantages over the InfluxDB 1.X "InfluxQL", with regards to the UUD. If fact, it poses some limitations as seen below: For a while, InfluxDB 2.0 did not even support InfluxQL, which the UUD is written in. Now it does, but only supports read only queries. Sources: https://github.com/VictorRobellini/pfSense-Dashboard/issues/33#issuecomment-803437229 https://github.com/grafana/grafana/issues/32183 So, does any one know WHY I would re-develop UUD 1.7 into "Flux" for InfluxDB 2.0? What would be the benefit? What are the opportunities with InfluxDB 2.0 and the "Flux" query language (QL)? I have not deep dived into it yet, but for the needs and requirements of the UUD, I don't see this as a must have, YET. Unless of course "InfluxQL" becomes unsupported. In that case, I will have no choice. Let me know your thoughts.
-
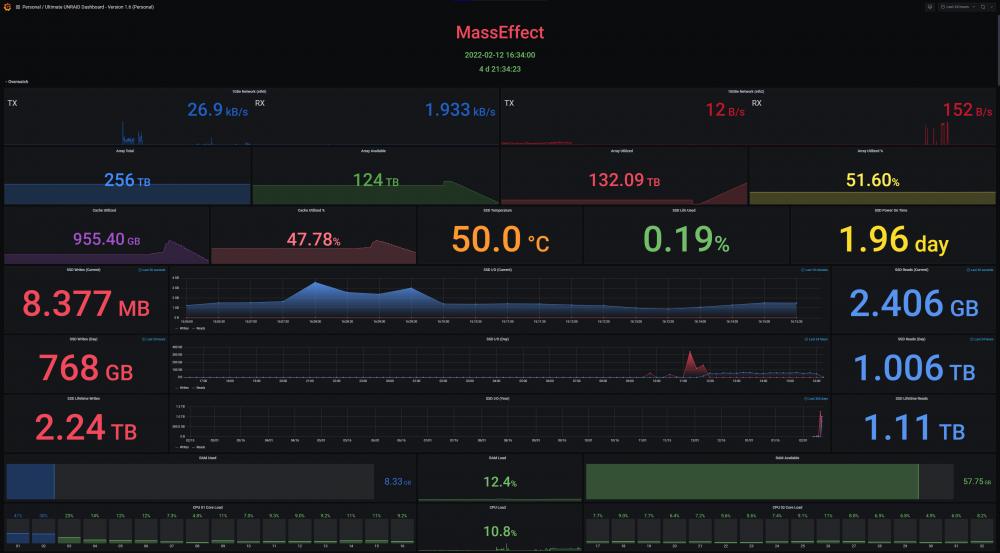
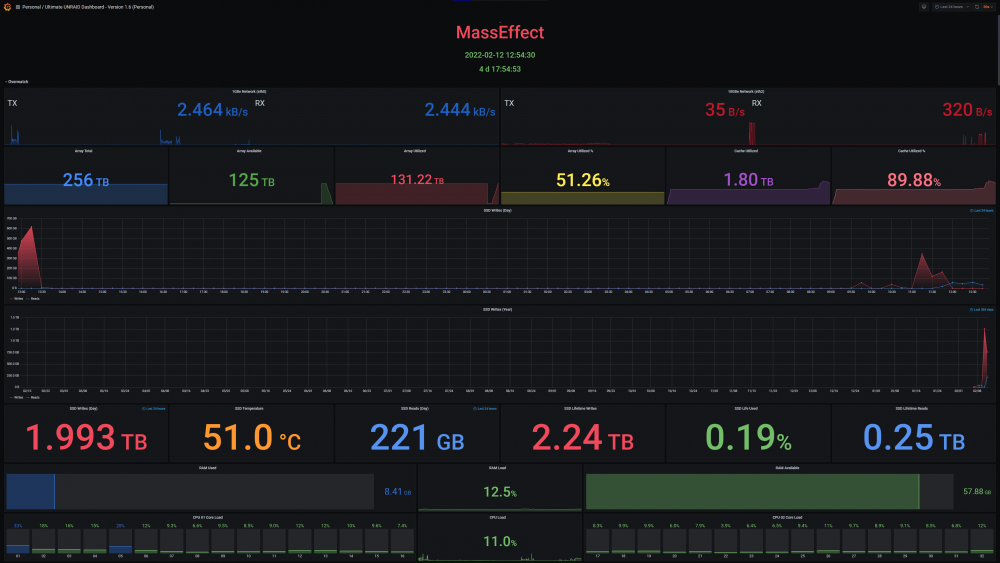
What the heck. I am kind of a Cache nerd, so I added a CURENT I/O graph to round it as well. I also added Write/Read stat panels to each of the 3 durations (Current, Day, & Year). Finally, I moved the Cache storage metrics to the Cache area, and then put a Lifetime Power On Time stat panel to round it out. I like it, and it suites my needs and focus on Cache health. @SpencerJ
-
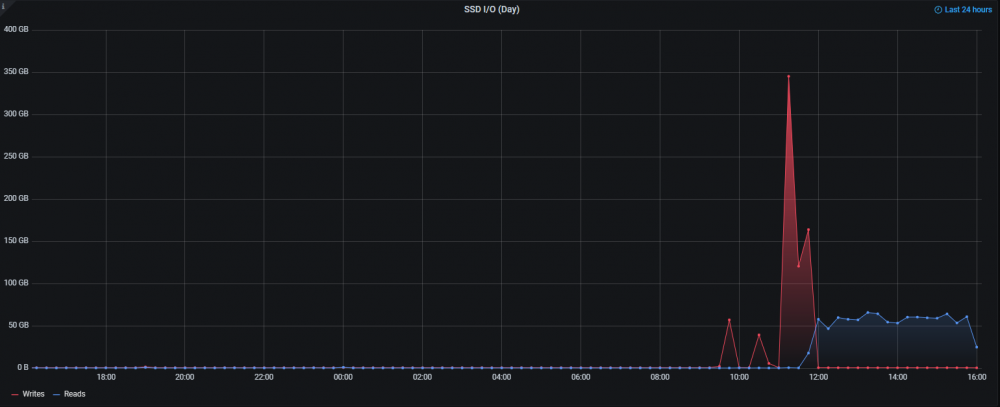
I added Read values to the Daily SSD Writes (Last 24 Hours). This is what it looks like when the MOVER offloads 2TB from Cache to the array. My new 2TB Samsung 970 Evo Plus is solid. Pretty Sweet graph.
-
DEVELOPER UPDATE: @SpencerJ Hey everyone. It's been a while since I actually messed with the UUD. I got remarried, and she's down with the UUD, so... we'll see if I get back into this. Today I am messing around with some new SSD Cache panels within a new style of header up top being more WIDE and CACHE focused. I just installed a new 2TB cache NVMe drive, so now was a great time to dive back in. I'm aware of Influx DB 2.0 and a number of changes that have occurred since UUD 1.6 was released. Perhaps when I get some time, I will see if upgrading the UUD to support Influx DB 2.0 is even possible. I also still had a few more ideas up my sleeves for UUD 1.7, IF I decide to proceed with it. UUD 1.7 Ideas: Nvidia GPU Panels Realtime Log Panels Using an UNRAID Log Server Actual Working Buttons to Control UNRAID via the UUD Let me know your thoughts. In the meantime, I'll be getting back to dabbling in this stuff. Cheers!
-
Welcome! I answered this in the release notes. Try right clicking any broken picture and open that link in a new tab. UNRAID should then prompt you to log in. Once you are logged into this secondary tab, go back to the UUD and refresh the dashboard “F5” or use the browser controls. Then simply close that other tab you used to authenticate (you don’t need to keep it open). As long as you don’t clear your browser cookies, you should be good to go. Glad you are making progress and enjoying the UUD. Happy New Year everyone!!!
-
You need to change the sections in the UUD to your sections in your Plex. Nothing needs to change in Plex for anyone. I just provided samples of different options from my own personal library. So if movies are just in 1 folder, you can easily do that. It’s completely customizable. I do not believe you can do it by Plex Genre. You are limited to what Varken can see in Tautulli.
-
Thanks for pointing out my thread. This is THE ONLY thing that I am disappointed in with UNRAID since 2014. This still plagues me today, unless I use the crazy work around that I discussed in that thread. Without it, I never break 400MB/s, which is particularly sad when you have all the necessary hardware in place to hit 10Gb/s.
-
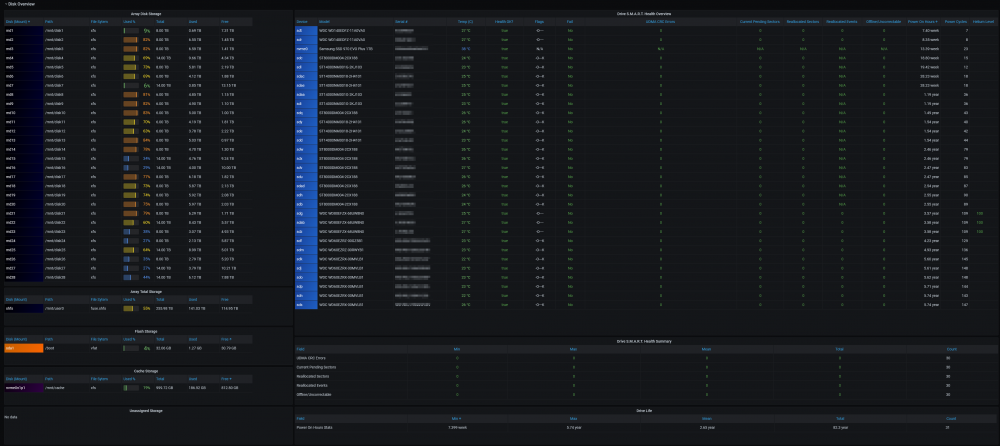
The Ultimate UNRAID Dashboard that I developed has all of this S.M.A.R.T disk info, but uses Telegraf. It’s nice to have both options. The UUD displays this in a “pretty” format. Let me know if you need a link to it. ich777 can also point you to it as he is aware of my work. Edit: Here is the link:
-
Hey everyone. I just wanted to shout out @ich777 and his great work on some Prometheus plugins for Grafana. These will most likely be included in the UUD 1.7 someday… @SpencerJ
-
This has been covered many times in the forum posts after the release of UUD 1.6. Please check that out and let us know if you are still stuck.
-
Great work man! Thanks for DMing me about your projects. I know what I’m adding to the Ultimate UNRAID Dashboard (UUD) Version 1.7! 😂 @SpencerJ You see this yet? This might just be juicy enough to pull me out of retirement/hiatus and get the UUD 1.7 out. I’ll look into this in August. I’m getting married this month!
-
Check Your timeframe in the upper right. Set it to the last hour and see if it changes. When is your mover running? Note: If you are using cache pools, then you’ll need to explicitly modify the query to account for all cache drives in the pool that makes up that instance of “Cache”. Also, to remove the second image on your post, you need to delete the second (or all) of the attachments in the post of that image. If not, it will stick the dupe on the end… Once they are all deleted, save your post. They should now be gone. Edit it again, upload the single photo, stick it where you want it, then save.
-
These are averages over specific timeframes.
-
Glad you figured everything out! This will surely help a lot of people that run custom network/bridge configs. Thanks for sharing.
-
Nope. Good luck.
-
I’m the developer. As long as you can get the data into an InfluxDB (or alternate) data source, Grafana will it will handle it dynamically, and therefore you could add it into your UUD dash. You need some middleware or an API (like how we use Telegraph and Varkin now) to send the data from your app into a valid datasource. It could even be a SQL database. It just needs to be one of the approved Grafana data sources, and it should slice and dice.
-
Yeah I figured, just wanted to be sure. Try removing each element in the query until you are at the base, then try to build it again from that. Sometimes Grafana gets messed up in the JSON and does not display elements as it should. Sometimes the select statement can act as a filter for the items in the from statement (possibly a Grafana bug). You can also just try making a new panel from scratch and see if these elements show up.
-
Is your API key masked on purpose for privacy or is it actually missing?
-
I've had no issues with Duplicacy. I did test some extensive restores and all worked out and checksummed correctly. However, for such a small amount of data, I would just RClone the differentials. That way you have direct file access (even though they are encrypted). Another thought is that I REALLY love TRESORIT. It's pricey but it is THE ABSOLUTE BEST box type sync with high quality encryption out there. It blows DropBox out of the Water. If you are under 2TB, I'd go TRESORIT and use a Windows Machine with a program called SyncFoldersPro. This is how I backup my NFO files and metadata for Kodi, etc.. I use SyncFoldersPro to simultaneously backup (with advanced filters) to my onsite backup server and Tresorit online backup. Works like a charm!
-
Yes, of course. Just download the UUD 1.6 JSON file from post #1, and then import it to Grafana manually. The new dashboard will appear and you can modify as needed. This has been detailed in this forum topic a few times. Please keep in mind that you will have many new dependencies and plugins that will be required when migrating from 1.3 to 1.6. Good luck!
-
And what the heck, I will be the 1,000th reply to my own thread ha ha. Thanks for everyone's interest and support for the UUD!
-
That's sweet man. Thanks for all of your work in this area. When I come back, I'll add this to UUD 1.7 and consolidate the Running/Non-Running panels!


