


falconexe
Community Developer
-
Joined
Everything posted by falconexe
-
Ha ha LOVE IT! Thanks very much.
-
Collaborator Thanks 🤝🎉 I promised I would call out all those who helped with UUD 1.6. A big thanks to anyone and everyone who helped with bug fixes, new ideas, supplied example code, collaborated, etc... If I missed anyone, I apologize. Feel free to let me know so I can add you. @caplam SSD Heath Panel Inspiration (Page 18) @corgan UNRAID API Idea, Documentation and Examples (Page 19) @ChatNoir Docker RAM Graph Starting at 1 Instead of 0 (Page 19) & Drive Query Fix (Page 19) @jbartlett CPU Graph Wasn't Capped at 100% (Page 19) @RockDawg Bugfixes Page 21 @GilbN RootFS Wildcard Fix @LTM It's a surprise that will be announced soon! @ElectricBrainUK For Creating the UNRAID API Docker! Could not have done it without him!
-
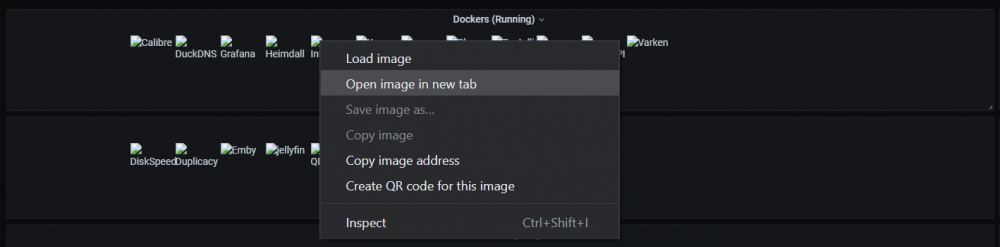
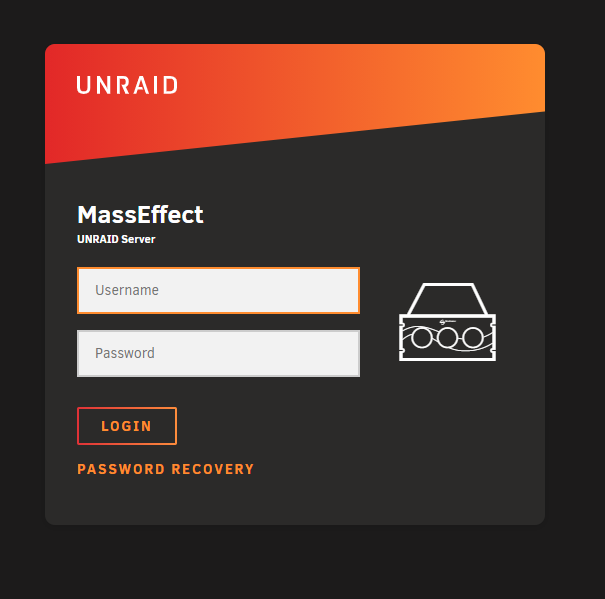
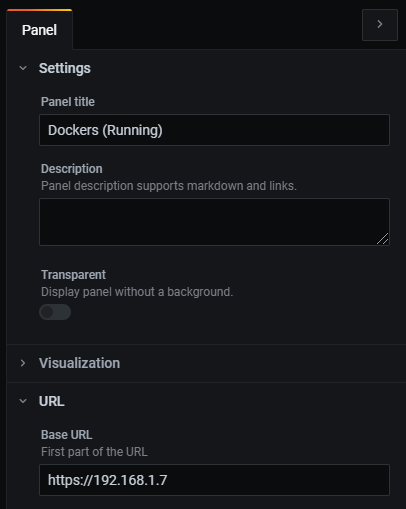
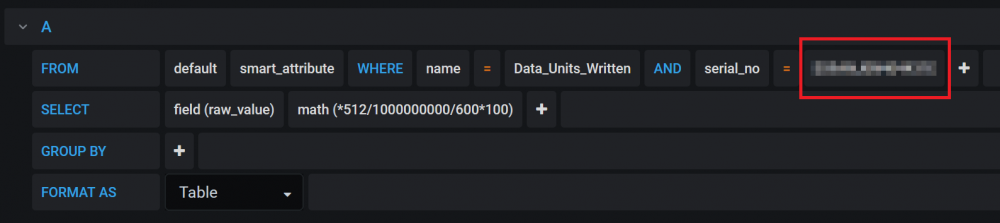
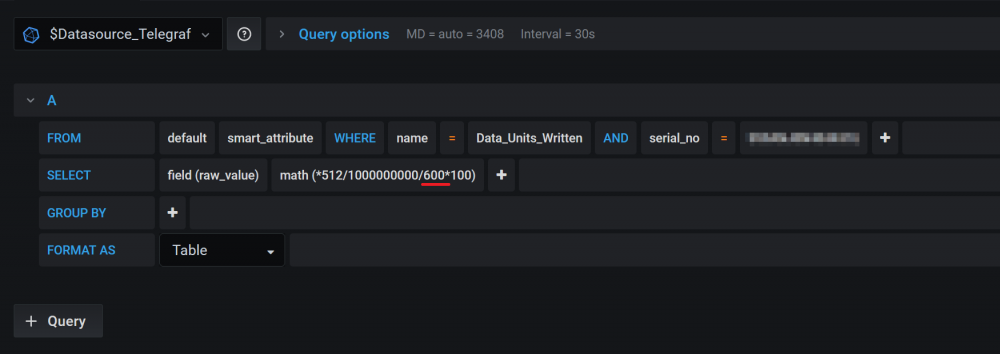
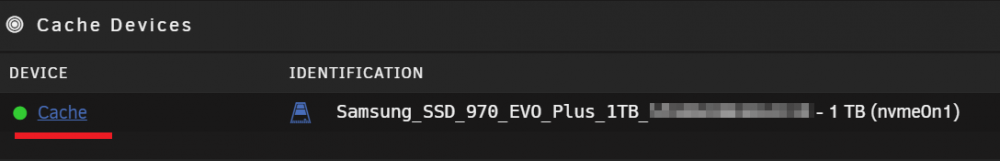
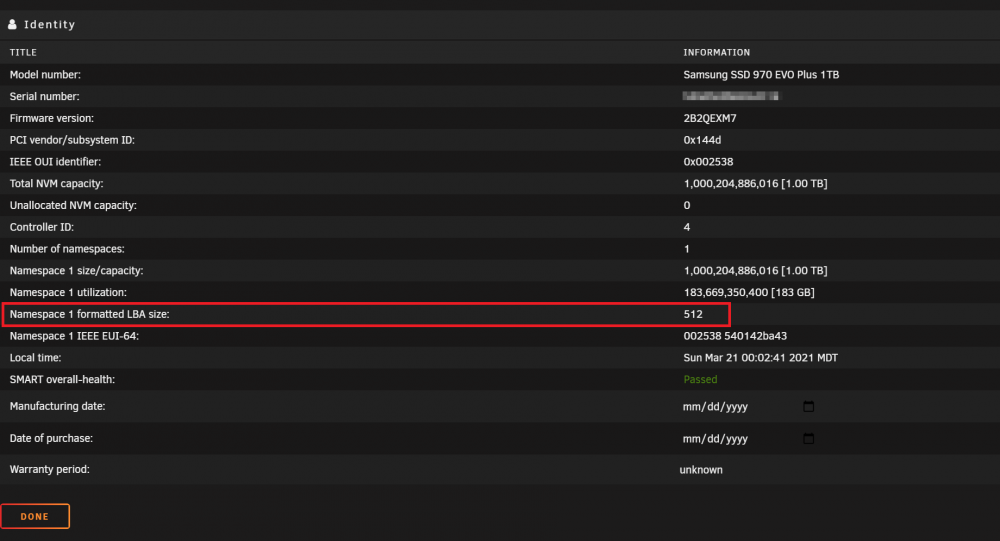
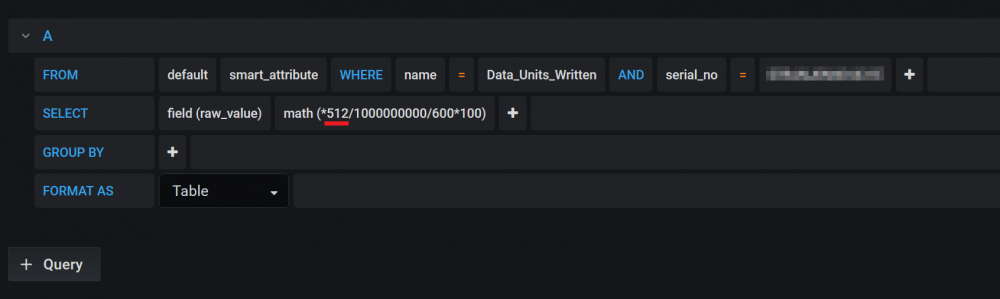
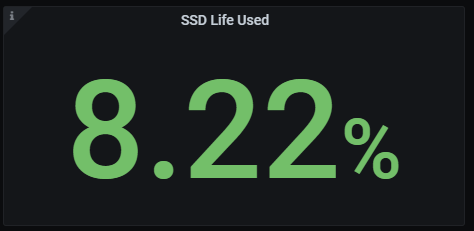
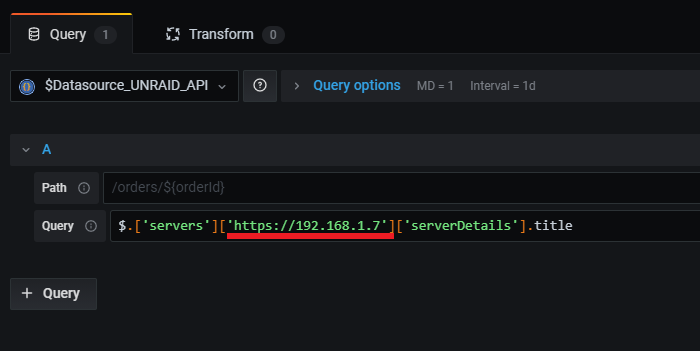
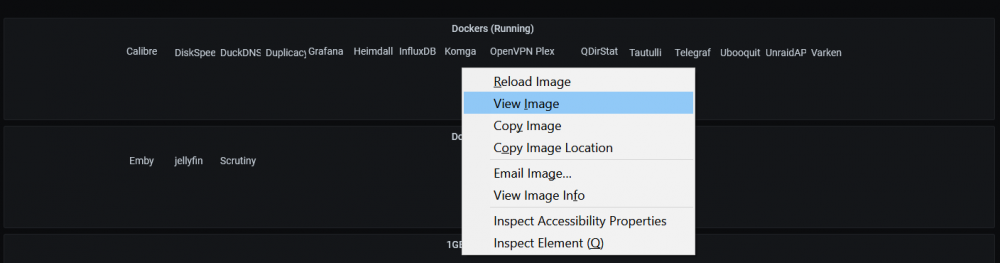
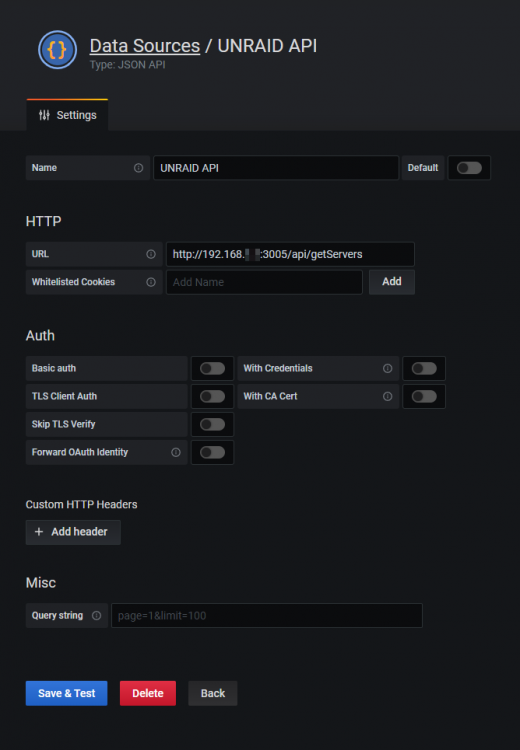
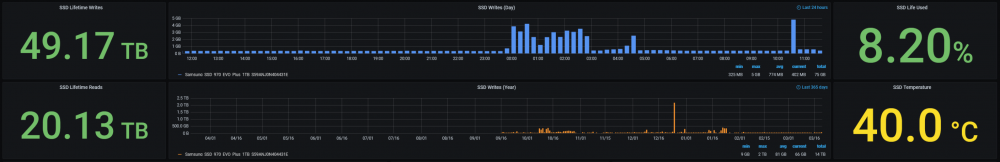
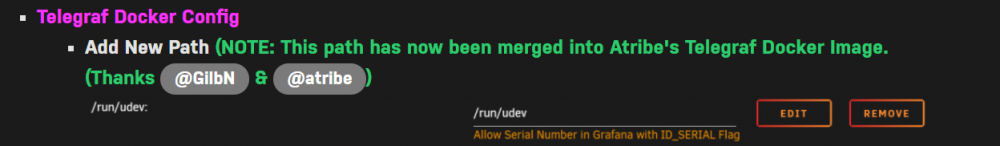
DEVELOPER UPDATE: UUD 1.6 Instructions UNRAID API Panels: You will need to adjust the UNRAID API related queries to get them to work for your server. Once you have the UNRAID API docker up and running, please amend any panels that use this docker (see release notes for a list) to include YOUR SERVER IP and Level of Security (HTTP Vs. HTTPS) where applicable. Do this for all of these panels that use the IP address (not all do...) and you should see data. Docker/VM Images and the Grafana Dynamic Image Panel Plugin Issues: There are a couple of things I noticed during development that are some quirks regarding the third party dependencies and plugins that we have to use to show all of this pretty data. One of the biggest issues I immediately found had to do with browser certificate security and the Image Panel Plugin. Many of you may have run into an issue by now where the Docker/VM images do not show up and only the item words do. It will look something like this: This is due to the plugin not recognizing the authentication to the UNRAID web front end where these images live. We need to help it out the first time around. This fix will last until the browser cookies get wiped or you delete your web history. In order to fix this (this example is Chrome, but this workflow will also work on FireFox and other browsers), you need to right click any one of the items, and open the image/link in a new window. Chrome Example: Firefox Example: Next, you will be presented with the UNRAID login page. Enter your credentials and you will land on your UNRAID web GUI homepage. Now go back to the Grafana UUD 1.6 dashboard tab and refresh it. The Docker/VM images should magically appear. You can now close that second UNRAID tab you opened. From what I can tell, this has something to do with the SSL certificate and the dynamic autogenerated URL that the UNRAID web GUI uses (if you chose to secure it). The image plugin just can't handle it natively. If anyone has a better fix for this, please let me know and I will incorporate it into the UUD. Regarding how these image panels actually work, YOU WILL NEED TO ENTER YOUR SERVER IP into each of the image panels. You can do this by editing the panel and going to the right side settings area. Finally, modify the URL > Base URL IP address. If you are using SSL with your UNRAID Web GUI, stick with "https://", if you are not, then use "http://". Calculating TBW For the SSD Health Panels In order for the SSD health panels to work correctly, there is some manual configuration that must be performed for YOUR SSD. If you do not do this, the numbers WILL NOT BE ACCURATE if you have a different SSD Make/Model/Size. First, you must manually edit the panels and select the Serial Number for your SSD. This IS NOT driven by the SSD variable due to the way these queries work. To Calculate Your TBW (Terabytes Written) You will need to do the following: 1. Identify your SSD Manufacturer, Make, and Model 2. Go to Your SSD Manufacturer's website and find the TBW value for for your drive in Terabytes 3. Change the MATH functions on the SSD drive health panels to match your TBW and Data Units (LBA Size) Example: My Cache Drive is a 1TB Samsung 970 EVO. https://www.samsung.com/semiconductor/minisite/ssd/product/consumer/970evo/ On the specification page, you will find a stat called TBW. For my particular drive, you will see 600 TBW. This means that you can write up to 600 Terabytes for the life of the drive before the manufacturer expects you to possibly run into problems. The rule of thumb is that if you approach that TBW threshold, you may want to start thinking about replacing that drive. This 600 TBW number (Yours may vary) needs to be entered into the following MATH function on the "SSD Life Used" panel in order for this to work for your drive. Another part of this formula uses something called Data Units Written. My SSD uses 512. You can find that number by looking at the properties of the drive within the UNRAID GUI. First go to the UNRAID Main Page and click on the Cache (or drive) Link: Next, go down to the Identity section at the bottom and look for the following property: Finally, ensure the following part of the MATH formula reflects this LBA Size (How Data Units Are Calculated Internally). In the end, the panel will spit out this nice number in %. This is the percent of drive life you have used thus far out of the total drive health (TBW). You will also need to adjust the Data Units number (512 in the example above) in the math sections of the "SSD Lifetime Writes" and "SSD Lifetime Reads" panels. Once you are done, To check your math, look at your SSD Lifetime Writes and divide it by the TBW number provided by the manufacturer. You should end up exactly correct! 49.31 TB Divided by 600 TB (TBW) = 8.22% Life Used Or in Other Words, I have 91.78% of my SSD drive life remaining.


-
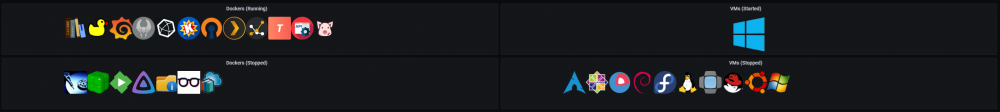
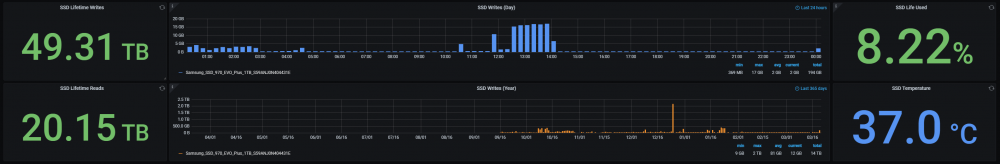
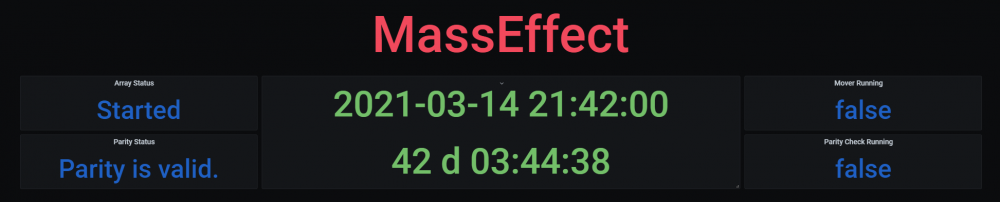
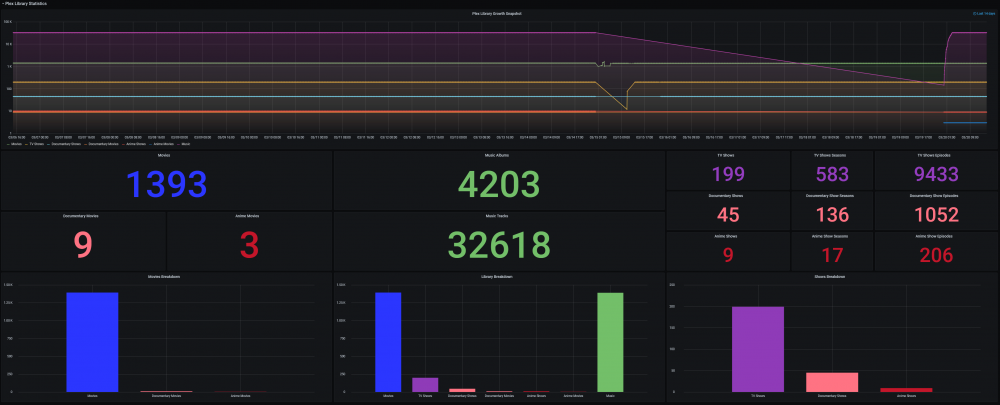
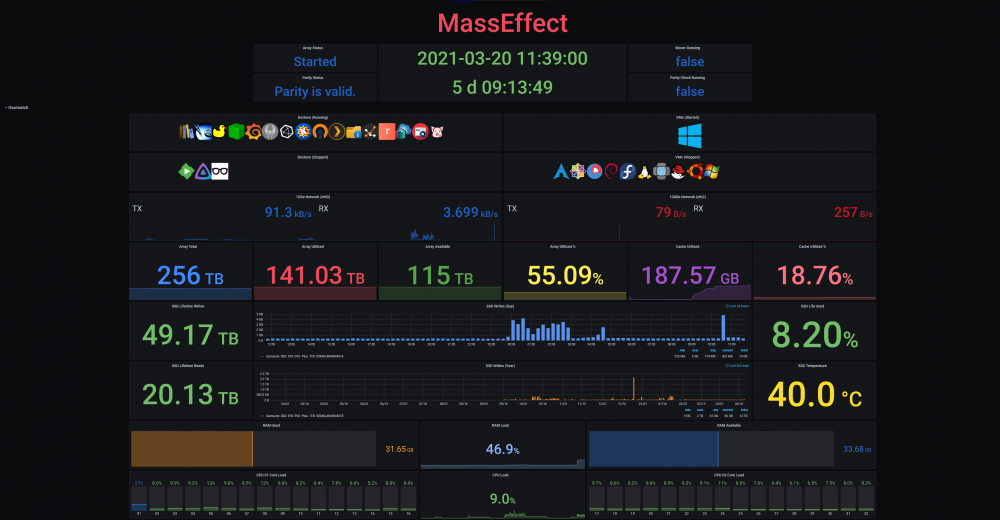
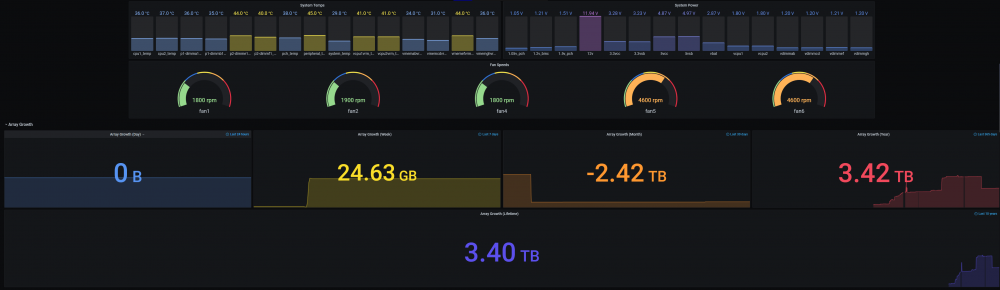
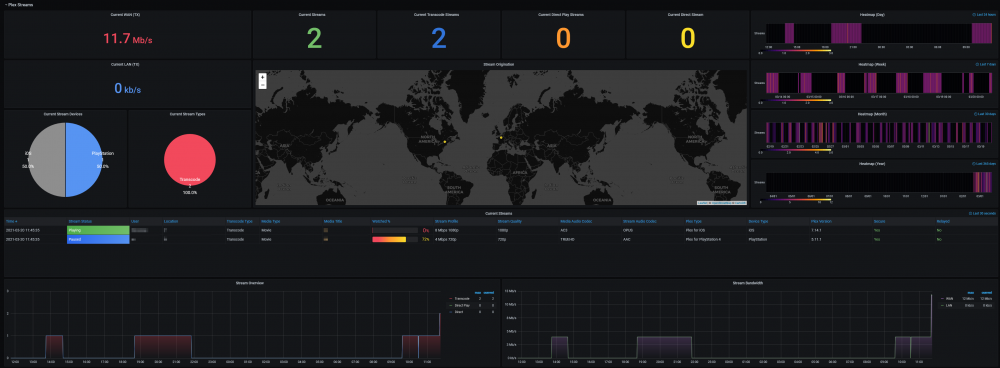
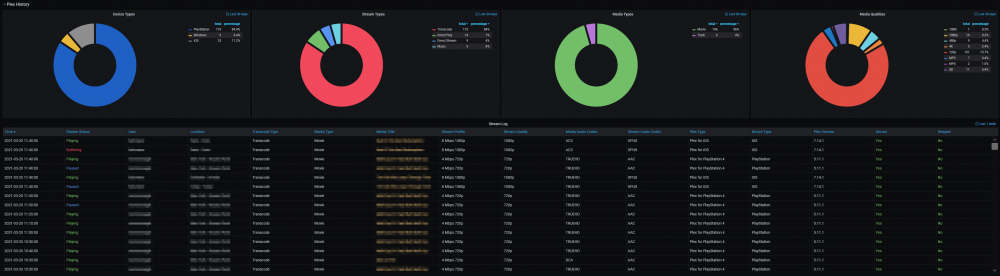
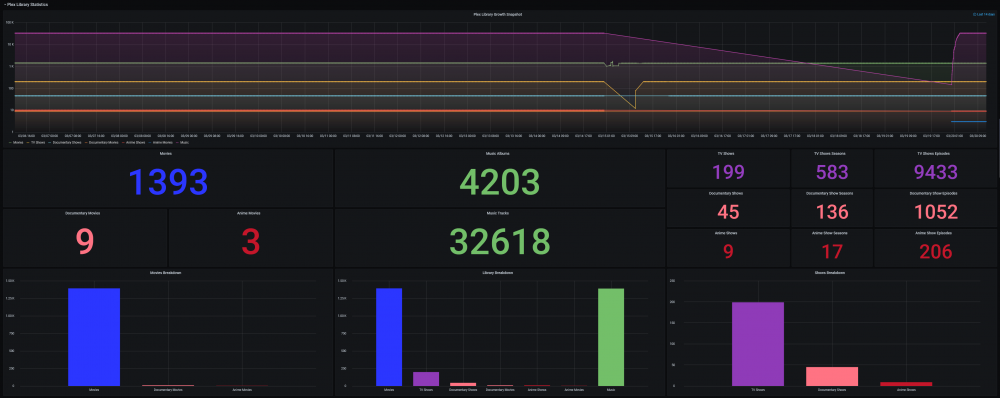
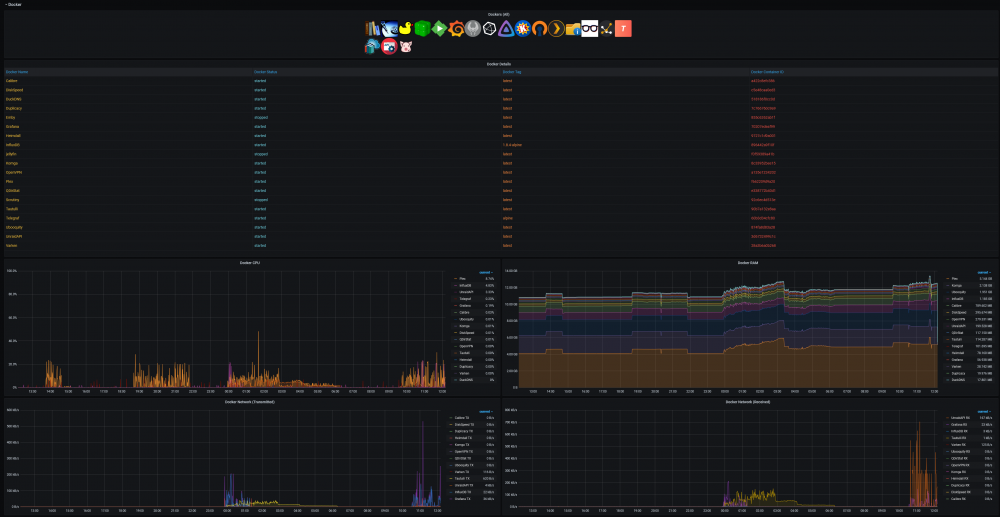
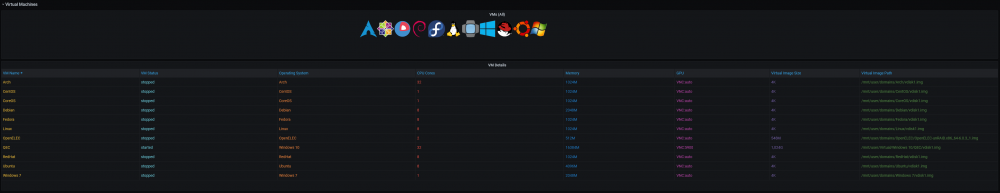
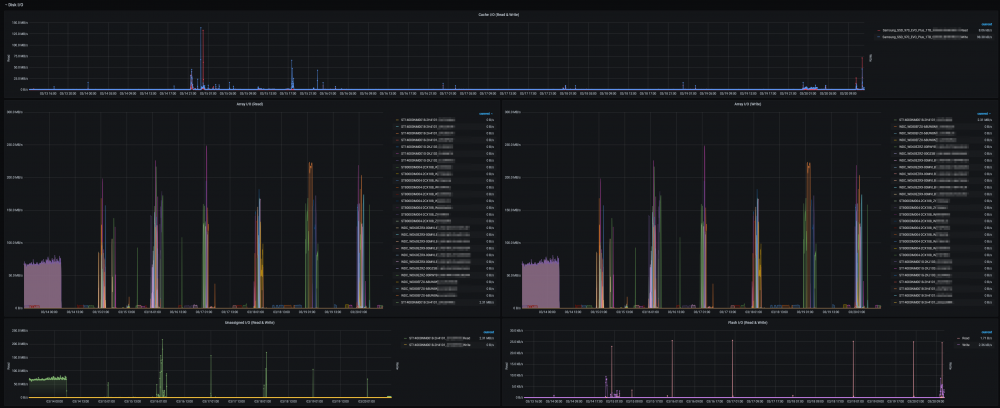
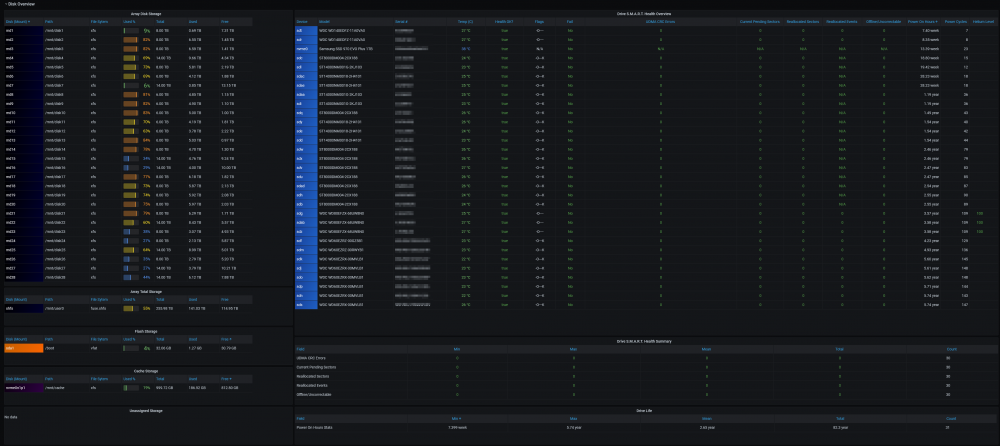
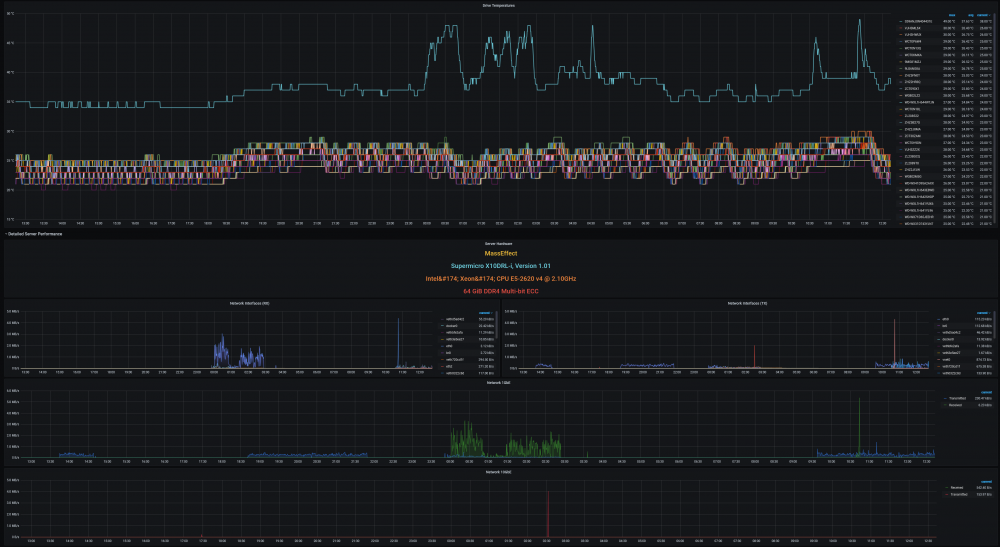
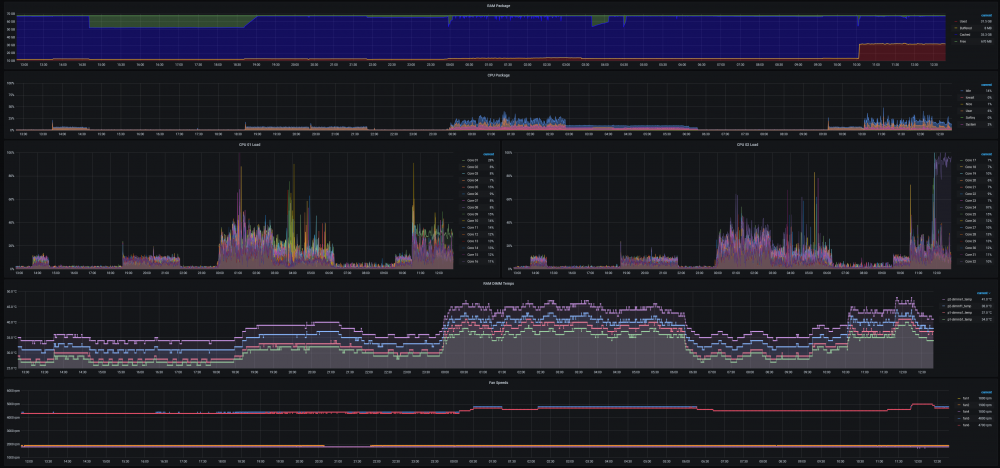
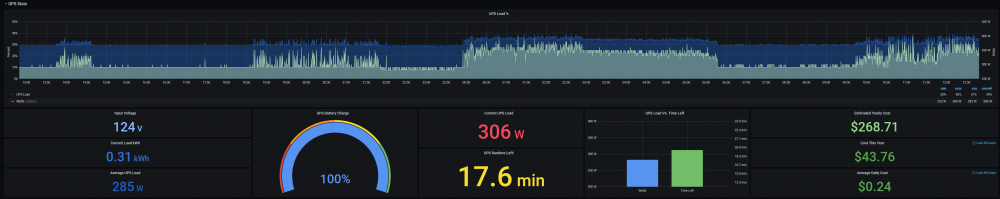
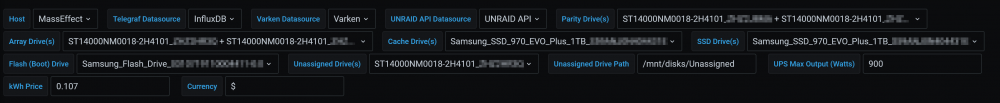
@SpencerJ @limetech The Ultimate UNRAID Dashboard Version 1.6 is here! This is the largest release yet 😁. Leveraging the power of the UNRAID API I bring you Array, VM, and Docker Monitoring. This new version also adds a dedicated SSD (Cache or otherwise) monitoring section complete with TBW monitoring to show SSD % of drive life used. There are a ton of other features, enhancements, bug fixes, improvements and continued refinement of the UI and color scheme. In total, UUD Version 1.6 adds 25 new Panels across 7 sections. Enjoy! 😉 New Dependencies: Dockers: UNRAID API (Install With Default Setup / Follow Current Project Install Guide) Download from Community Apps https://github.com/ElectricBrainUK/UnraidAPI New Grafana Plugins JSON API https://grafana.com/grafana/plugins/marcusolsson-json-datasource/?pg=plugins&plcmt=featured-undefined&src=grafana_footer Run Following Command in Docker: grafana-cli plugins install marcusolsson-json-datasource Dynamic Image Panel https://grafana.com/grafana/plugins/dalvany-image-panel/?pg=plugins&plcmt=featured-undefined&src=grafana_footer Run Following Command in Docker: grafana-cli plugins install dalvany-image-panel New Grafana Data Source: "UNRAID API" Dashboard Variables Please Note: This release is an example tailored to MY UNRAID Server. The intent here is that you will take this and modify it for your Setup. You have everything you require to template new panels and tailor it to your own needs. Highlights: New UNRAID API Related Panels Dynamic Header Host Name Array Status Parity Status Mover Running (True/False) Parity Check Running (True/False) Overwatch Docker Monitoring with Real Time Dynamic Images/Statuses Dockers (Running) Dockers (Stopped) VM Monitoring with Real Time Dynamic Images/Statuses VMs (Started) VMs (Stopped) Docker Dockers (All) Docker Details Virtual Machines VMs (All) VM Details Server Hardware Shows More Detail Regarding Specific Server Hardware Specifications Array Growth Array Growth (Lifetime) Shows Array Growth Over Rolling Last 10 Years (1 Data Point Per Day) SSD (Cache) Drive Health SSD Writes (Day) Shows SSD Writes For Rolling Last 24 Hours at 15 Minute Intervals Controlled By New SSD Drive Variable SSD Writes (Year) Shows SSD Writes For Rolling Last Year at 1 Day Intervals Controlled By New SSD Drive Variable SSD Lifetime Writes Measures SSD Lifetime Writes Math Based on Manufacturer Max TB Written (TBW) Specification Color Based on Thresholds (Derived From Manufacturer TBW) SSD Lifetime Reads Measures SSD Lifetime Writes Math Based on Manufacturer Max TB Written (TBW) Specification Color Based on Thresholds (Derived From Manufacturer TBW) SSD Life Used Calculates Used Drive Life Based on Lifetime Rights Divided by Manufacturer Max TBW Math Based on Manufacture Max TB Written (TBW) Specification Color Based on Thresholds (% of Manufacturer TBW) SSD Drive Temperature (Dynamic Colors Based Temp Thresholds) Plex Library Statistics Combined Growth Chart Across All Libraries The old way was just ugly and too performance intensive This is a nice one stop shop! Completely Overhauled with New Panels with Media Type Breakdowns Across Sub Libraries Changes Variable Now Used for Varken Datasource (Set at Top of Dashboard) Updated GUI Panels/Sizes/Locations/Colors/Themes Change Uptime Panel to Fit New Theme System Power Panel Changed System Power to Bar Charts Scaled the Volts to a Range Between 1V and 12V Array Growth Changed All Panels to Rolling Timelines Today So Far = Last 24 Hours This Week So Far = Last 7 Days This Month So Far = Last 30 Days This Year So Far = Last 365 Days Plex Stats Renamed to Plex Streams Plex Heatmaps Changed All Panels to Rolling Timelines Today So Far = Last 24 Hours This Week So Far = Last 7 Days This Month So Far = Last 30 Days This Year So Far = Last 365 Days Plex History Device Types Changed Chart from Pie to Donut Stream Types Changed Chart from Pie to Donut Media Types Changed Chart from Pie to Donut Media Qualities Changed Chart from Pie to Donut Changed Panels to Rolling Timelines Today So Far = Last 24 Hours This Week So Far = Last 7 Days This Month So Far = Last 30 Days This Year So Far = Last 365 Days Plex Library Growth Changed All Panels to Rolling Timelines Today So Far = Last 24 Hours This Week So Far = Last 7 Days This Month So Far = Last 30 Days This Year So Far = Last 365 Days CPU 01 Core Load Changed Labels So Cores Reflect Only the Core Number Before: Core01, Core02, ... After: 01, 02, ... This Improves Readability and Scalability on Smaller (Non 4K Displays) Array Disk Storage Used % Field: Removed Cell Background Colors and Changed Override to Basic Gauge Improved Visual Experience and Readability Array Total Storage Used % Field: Removed Cell Background Colors and Changed Override to Basic Gauge Improved Visual Experience and Readability Flash Storage Used % Field: Removed Cell Background Colors and Changed Override to Basic Gauge Improved Visual Experience and Readability Unassigned Storage Used % Field: Removed Cell Background Colors and Changed Override to Basic Gauge Improved Visual Experience and Readability Flash Storage Used % Field: Removed Cell Background Colors and Changed Override to Basic Gauge Improved Visual Experience and Readability Drive S.M.A.R.T. Health Overview Temp (C) Field: Removed Cell Background Colors and Changed Override to Colored Text Improved Visual Experience and Readability Drive S.M.A.R.T. Health Overview Temp (C) Field: Removed Cell Background Colors and Changed Override to Colored Text Improved Visual Experience and Readability UDMA CRC Errors Field: Removed Cell Background Colors and Changed Override to Colored Text Improved Visual Experience and Readability Current Pending Sectors Field: Removed Cell Background Colors and Changed Override to Colored Text Improved Visual Experience and Readability Reallocated Sectors Field: Removed Cell Background Colors and Changed Override to Colored Text Improved Visual Experience and Readability Reallocated Events Field: Removed Cell Background Colors and Changed Override to Colored Text Improved Visual Experience and Readability Offline/Uncorrectable Field: Removed Cell Background Colors and Changed Override to Colored Text Improved Visual Experience and Readability Helium Level Field: Removed Cell Background Colors and Changed Override to Colored Text Improved Visual Experience and Readability Drive S.M.A.R.T. Health Summary Min Field: Removed Cell Background Colors and Changed Override to Colored Text Improved Visual Experience and Readability Max Field: Removed Cell Background Colors and Changed Override to Colored Text Improved Visual Experience and Readability Mean Field: Removed Cell Background Colors and Changed Override to Colored Text Improved Visual Experience and Readability Total Field: Removed Cell Background Colors and Changed Override to Colored Text Improved Visual Experience and Readability UPS Stats UPS Runtime Left Removed Exclamation Point From Panel Name Changed All Panels to Rolling Timelines Today So Far = Last 24 Hours This Week So Far = Last 7 Days This Month So Far = Last 30 Days This Year So Far = Last 365 Days Removed Cell Background Colors Improved Visual Experience and Readability Fixes/Improvements All Panels are Now Driven by Datasource Variables Adjusted All Drive Path Panels to Use Regex Resolves ROOTFS Issue Some Users Were Experiencing UUD Should Now Not Care How Your Paths are Setup and Just Work Adjusted Drive Variables to Select Distinct Based on Selected Time Interval Removes Missing/Old Drives From Panels and Removes Legacy Data Prevents Old Device IDs "SD*" From Showing Up After Reboots Provided You Select a Timeframe After the Reboot Varken Geolocation Map Fixed Bug Where Geo Map Header Was Hidden Behind UI Elements Gave Panel a New Name of "Stream Origination" Map Now Automatically Centers on Current Stream (Last Geo Hash) Changes Default Zoom Level to 3 (Zoom Out By Factor of 1) Changed Geo Location Blips to Yellow to Match Plex Color Theme Added Mouse Zooming/Scrolling (Wheel) to Map General Graphs Now Start at "0" Where Applicable (Docker Ram) % Graphs Now Cap at 100% (CPU Graphs) Drive Queries Now Correctly Account For Dynamic Host Variable (Custom Query and Parenthesis Placement) UUD 1.6 Screenshots (With Personal Info Redacted): A TREMENDOUS amount of work has gone into this release. There are a ton of people who have contributed to this release whether it be bug fixes, suggestions, improvements, or new ideas. I will do an updated post to specifically call out each and every person who helped with this 1.6 build. First, though, I just want to get this out to you guys ASAP. There are a few tips and tricks that I will also release in a post soon that will detail some of the gotchas with the UNRAID API and new Grafana Plugins. I just need some time to put that together. In the meantime, please let me know how your baseline 1.6 install is going. I really hope you guys enjoy this release!!!


.thumb.png.92808247ef39a7d2f3080e02af29897d.png)


.thumb.png.c57838a767decc3c3500219f31029d73.png)
-
Ha ha. Welp, it's about to happen. Uploading code now. Should be about 1-2 hours out. Screenshots are done, and I just have to get the posts written. Welcome to the UUD community.
-
Engaging documentation mode...
-
Development on UUD 1.6 is now COMPLETE! I'm finally heading to bed! When I wake up, I will gather screenshots and finish up the content and verbiage for the release posts. Still a few more hours of work, but I'll be glad to get this one out the door. I really hope you guys like it. Lots of exciting stuff for you to discover and unpack tomorrow!
-
Alright, clear your schedules. 1.6 drops this weekend! My Target is Saturday. It's gonna be one where you'll want to upgrade ha ha.
-
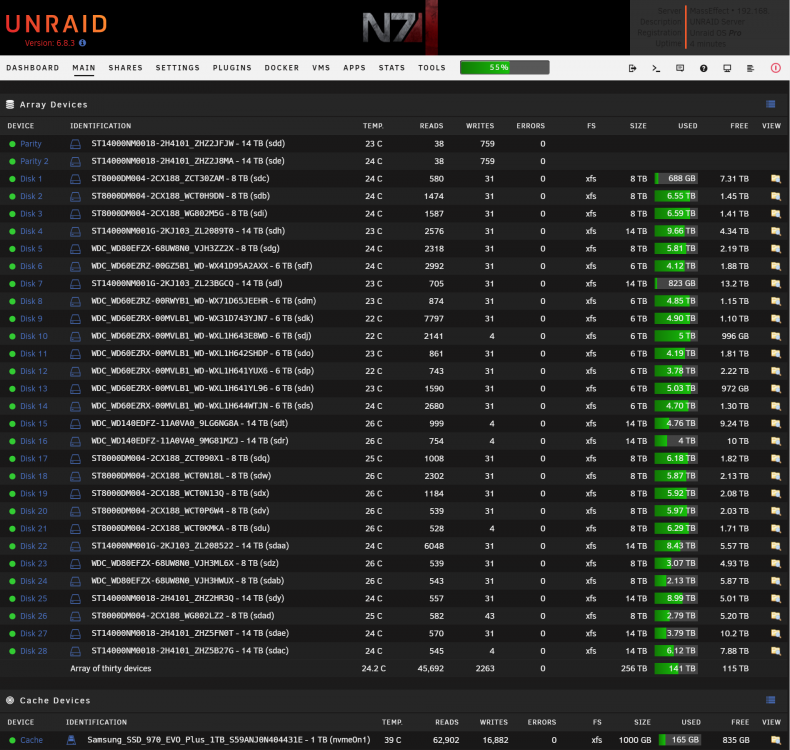
Is this the largest single array LOL? I just hit 256TB usable, with 285TB in the server total. I have another backup server approaching 200 TB. I'm very close to .5 PB overall.

-
=== DEVELOPER UPDATE === UUD 1.6 is close. Very close...
-
I was just writing up a reply to say check your Telegraf config file. Glad you got it figured out.
-
Thanks everyone for reporting this issue. @SpencerJ are you and the team aware of this? The UUD has only been tested/released on 6.83 stable. I have yet to upgrade myself. I’ll release 1.6 first, then look into upgrading my 2 servers soon thereafter.
-
Does your appdata folder sit on these disks? AKA are you NOT using a cache disk? If so, the data will be written to the appdata folder that sits on these disks based on your Telegraf interval (30 seconds is default). And if you have these 2 disks in the same spin-up group, that would also explain it.
-
DEVELOPER UPDATE: Hey guys. Sorry it has been so long since my last post/news. Unfortunately, I am going through a divorce. It was a complete shock, and I'll just leave it at that. As you can imagine, it has taken up a lot of my time and energies. I was on track to release UUD 1.6 right before that bombshell went off. So, I am slowly getting back into development mode to polish a few things up and get this out the door. Another user @LTM and I have also been hard at work on another project that will directly support the UUD now and into the future. I am very excited to make that introduction and announcement soon. I wanted to say thanks to @GilbN and all of the other users in the community who have helped out people with questions and issues while I was away. It's great to see! Stay tuned...
-
It would be cool to discuss things like the Ultimate UNRAID Dashboard (UUD). 😉
-
Are you using Cache? It won’t show anything until the mover runs and the data hits the actual array. It is designed to pick up data changes within 30 seconds (assuming your Telgraf config update interval matches). The selected Grafana timeframe has no impact on these growth queries because they are set to explicit relative time intervals individually. In the upper right you’ll see “Today so far” in blue. This means that the graph starts at Midnight. The uptick may have been your mover. Mine works perfectly...
-
Can vouch for the Recycle Bin plugin. It is fantastic and has saved my arse plenty of times...
-
Ha Ha. Love the “Japanese Monster Movies”. You have a whole section just for them. Nice...
-
You need to edit the query by selecting your proper Plex Library section. If your library section names happen to mach the UUD (mine since I'm the developer) exactly, they will just magically work. So edit the panel, head over to the query, and click the library section tag and select from the auto populated drop own menu. Do this for all fo the N/As and you'll be in business. You can also copy any of these, change the color if you want, pick a different section, and change the name. So you can add things like Stand-Up, UFC, Home Movies, etc. This is just a template. Make it your own... And for the map that shows all locations, that should be possible. I'll see what I can figure out.
-
Thanks for that. I'm back in town.
-
Hi everyone. Due to an unforeseen circumstances, I will need to postpose the UUD 1.6 release until late February. I'll be away from the forums until I get back from my trip. Sorry about the delay. The next release will be worth the wait.
-
See page 21 for mine. Try that.
-
@hermy65 Look up 4 posts LOL. No worries man!😉
-
This is found in the instructions on POST# 1.
-
New Query: SELECT DISTINCT("ID_SERIAL") FROM (SELECT * FROM "diskio" WHERE $timeFilter)


.png.22e490e87cea389a3192d554fbb028bb.png)


.png.c49ac940143d11db30092fa7a8afec72.png)


