






falconexe
Community Developer
-
Joined
Everything posted by falconexe
-
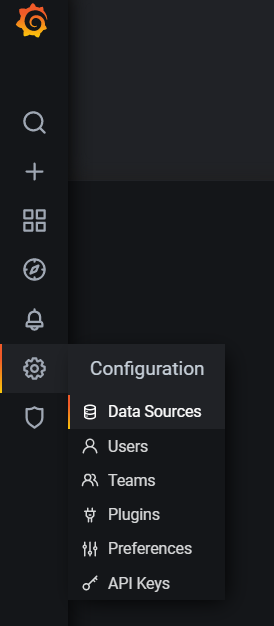
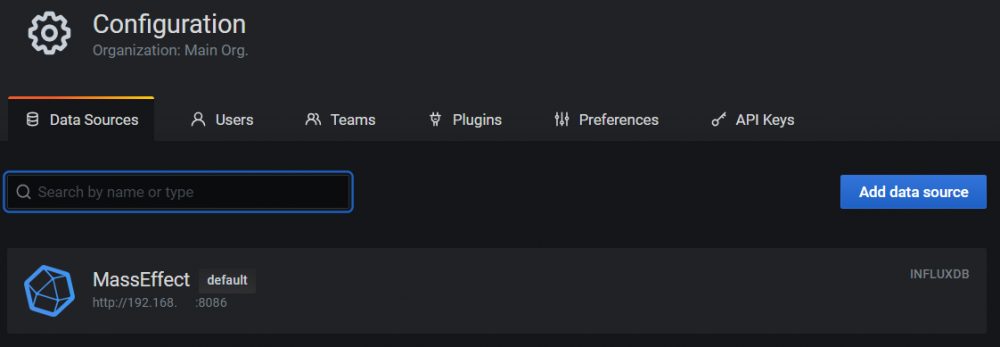
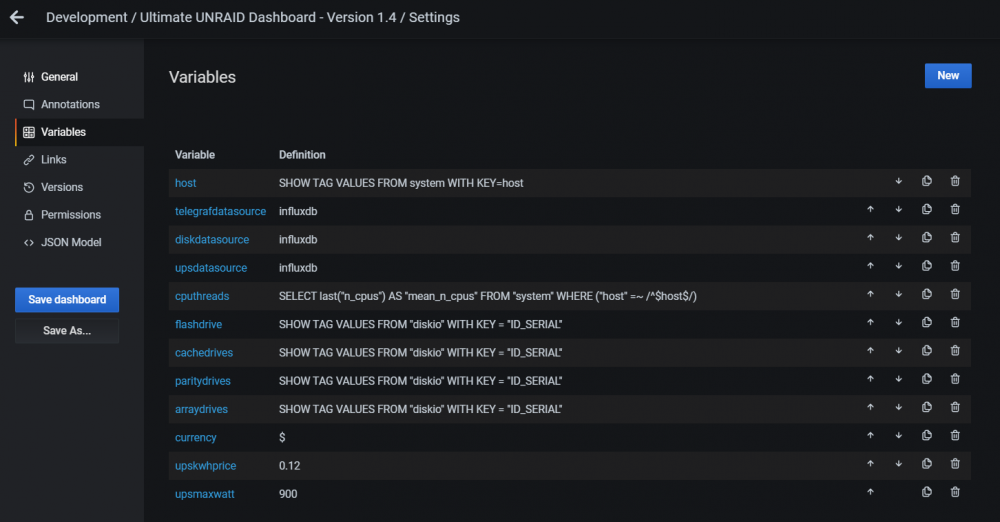
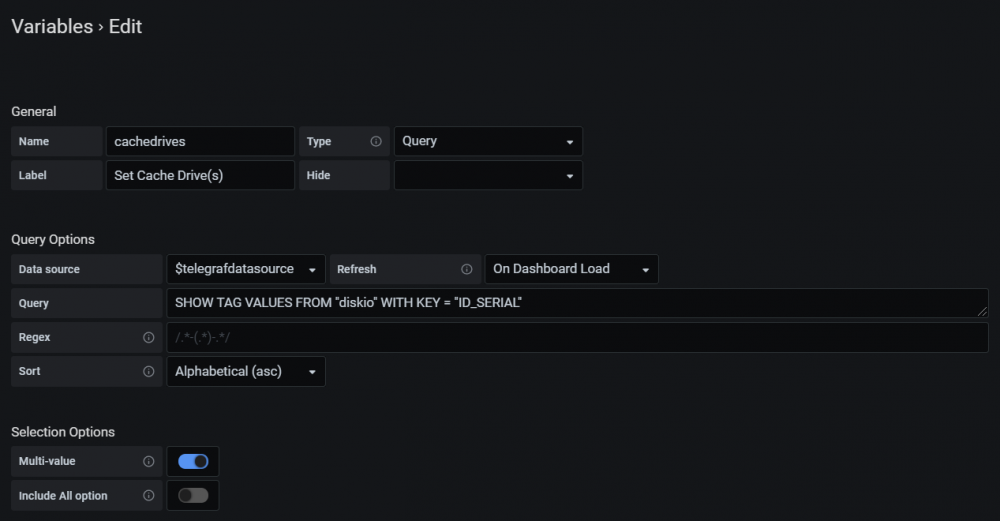
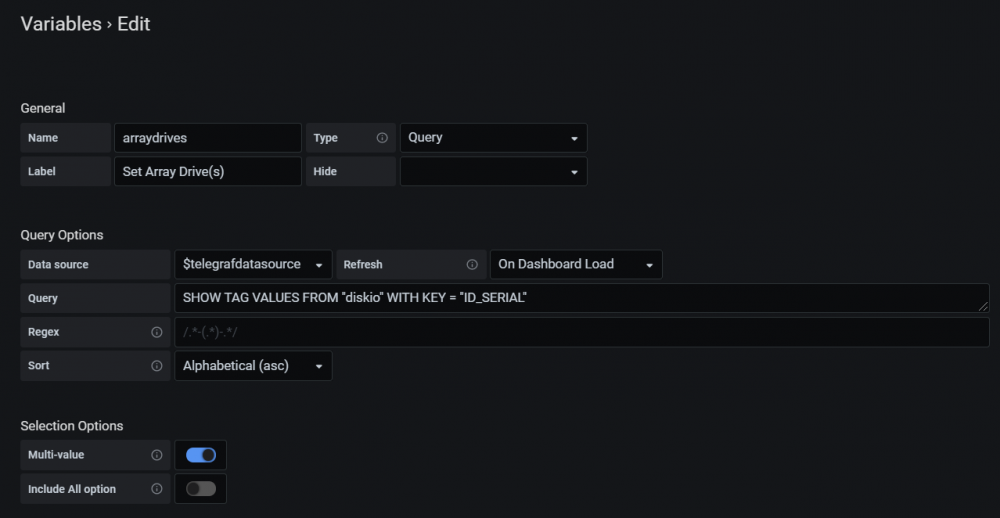
Do you see ANY drives in ANY of the variable drop down menus at the top of the dashboard? Please post a screenshot of your variables as a whole. Like below: Did you select/setup your default InfluxDB datasource?

-
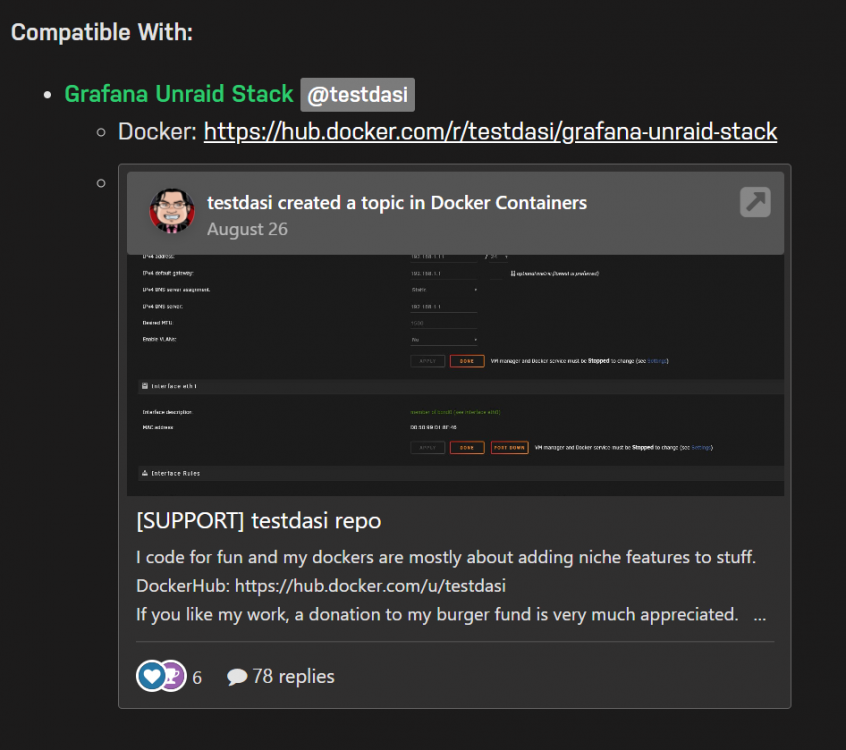
Hey @testdasi I just added a compatibility section on the UUD topic (first post on page 1) and tagged you. Link:
-
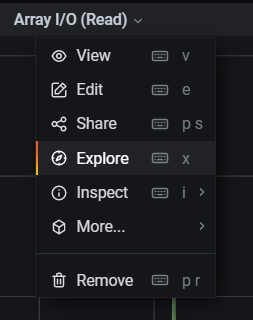
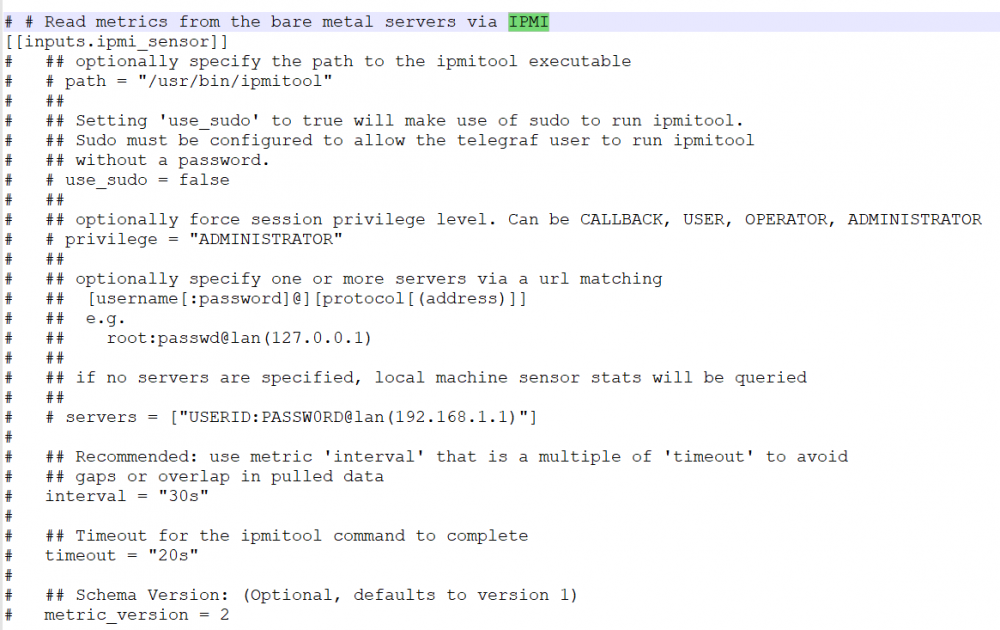
If you are not using a parity drive, you can delete the "paritydrives" variable. First Save your dashboard before making that change so you can revert later if you want and restore it. Then just click the trash icon. Then save your dashboard again and reload. If you look at the drive queries, you can then remove any references to that variable as needed. I'll look into a NULL value option for variables. If I can find a way to do this, I will add it to version 1.4 for those who don't run specific drive types. For anyone not running Cache drive(s), you can do the same thing and delete that variable. Running without parity seems pretty rare, so I opted to cast the widest use case out of the box. The great thing about Grafana is that you can customize it to your liking/needs. The UUD is just a really great place to start for those that want/need to take it further, or even in an entire new direction. As for your drive stuff not showing up, please click on the panel(s) in question, then click Explore, and post a screenshot so I can see both the query and data. We can troubleshoot from there. Also please post screenshots of the dropdown for each drive variable so we can see what you are being offered. Regarding IPMI, many people including myself are using it without any issues. Are you running the IPMI docker? Can you post logs of Telegraf at the time of the crash? Stop the Telegraf docker. Right click the docker and click the log button. Start Telegraf and post the results. Here is the IMPI section of my Telegraf config. You need to ensure it is enabled here (by uncommenting it). You also need to ensure you have loaded the plugin into telegraf and that you have the correct arguments passed to the docker. All of this info is contained in the 1st post on page 1. There was another user who had a similar issue earlier in this topic too if you want to see that info. Hopefully all of this makes sense. We'll get you figured out. So far I have not had anyone that we couldn't get up an running. 🤜🤛

-
@testdasi I’m down. Let me know if I can help. We can also coordinate new releases. I’m currently developing version 1.4. And I appreciate your kind words!
-
Thanks for the shoutout @testdasi! My goal as the developer of UUD was to get as absolutely close to "out of the box" as possible. The new version of UUD 1.3 that I posted last night uses dynamic code to handle all manner of UNRAID architecture. And I'll keep working to improve it as time goes on. Feel free to join us on the forum topic for support. It is absolutely 100% compatible with the Grafana-Unraid-Stack docker. 😁
-
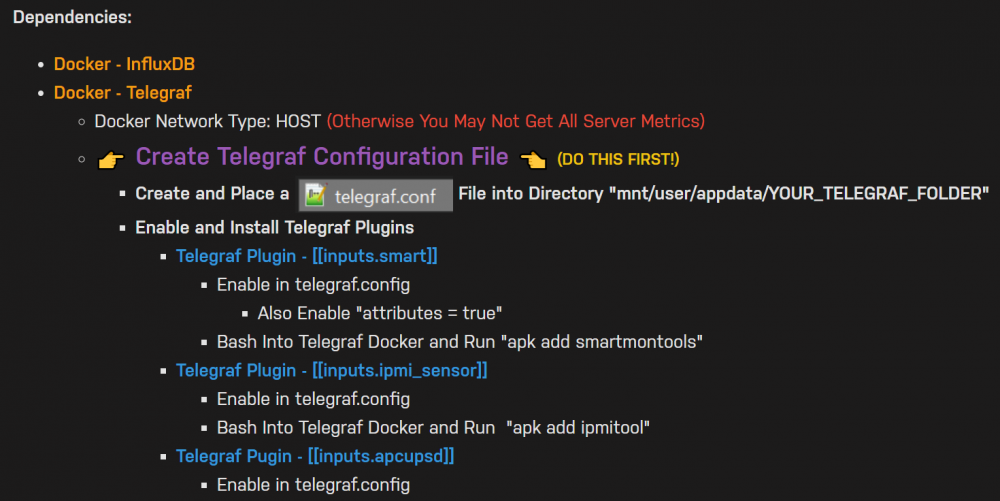
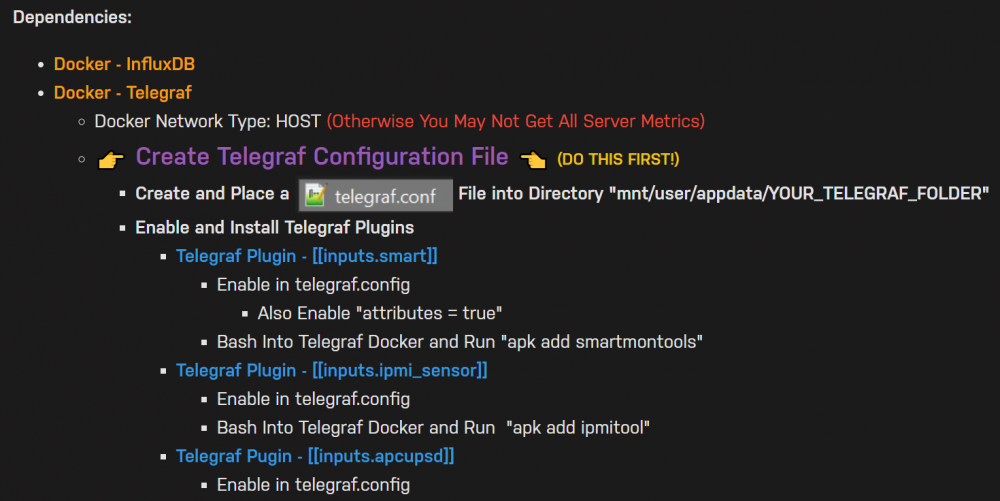
Sweet. Glad you got it working. I updated the install/dependencies sections on post 1 to include this explicitly for the Telegraf config. Just in case anyone else isn't clear on it or forgets that single line. Cheers!
-
So in your Telegraf config, you now have both [[inputs.smart]] > "attributes = true" uncommented? Did you restart all 3 dockers to pickup the changes? I like to do them in this order. Shutdown: Grafana > Telegraf > InfluxDB Startup: InfulxDB > Telegraf > Grafana
-
You should definitely remove the LIMIT 10 clause too. That could do some fun stuff... Also, diskio is for other queries. This one uses "smart_attribute". Paste your S.M.A.R.T. section of the config too. You may have attributes turned off (red below). Here is mine: # # Read metrics from storage devices supporting S.M.A.R.T. [[inputs.smart]] # #devices = [ "/dev/nvme0n1" ] # ## Optionally specify the path to the smartctl executable # # path = "/usr/bin/smartctl" # # ## On most platforms smartctl requires root access. # ## Setting 'use_sudo' to true will make use of sudo to run smartctl. # ## Sudo must be configured to to allow the telegraf user to run smartctl # ## without a password. # # use_sudo = false # # ## Skip checking disks in this power mode. Defaults to # ## "standby" to not wake up disks that have stoped rotating. # ## See --nocheck in the man pages for smartctl. # ## smartctl version 5.41 and 5.42 have faulty detection of # ## power mode and might require changing this value to # ## "never" depending on your disks. # # nocheck = "standby" # # ## Gather all returned S.M.A.R.T. attribute metrics and the detailed # ## information from each drive into the 'smart_attribute' measurement. attributes = true # # ## Optionally specify devices to exclude from reporting. # # excludes = [ "/dev/pass6" ] # # ## Optionally specify devices and device type, if unset # ## a scan (smartctl --scan) for S.M.A.R.T. devices will # ## done and all found will be included except for the # ## excluded in excludes. # # devices = [ "/dev/ada0 -d atacam" ] # # ## Timeout for the smartctl command to complete. # # timeout = "30s"
-
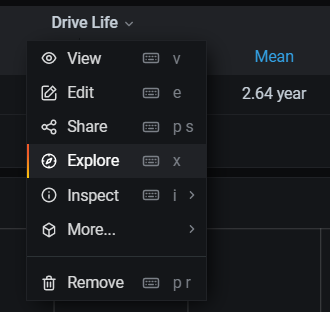
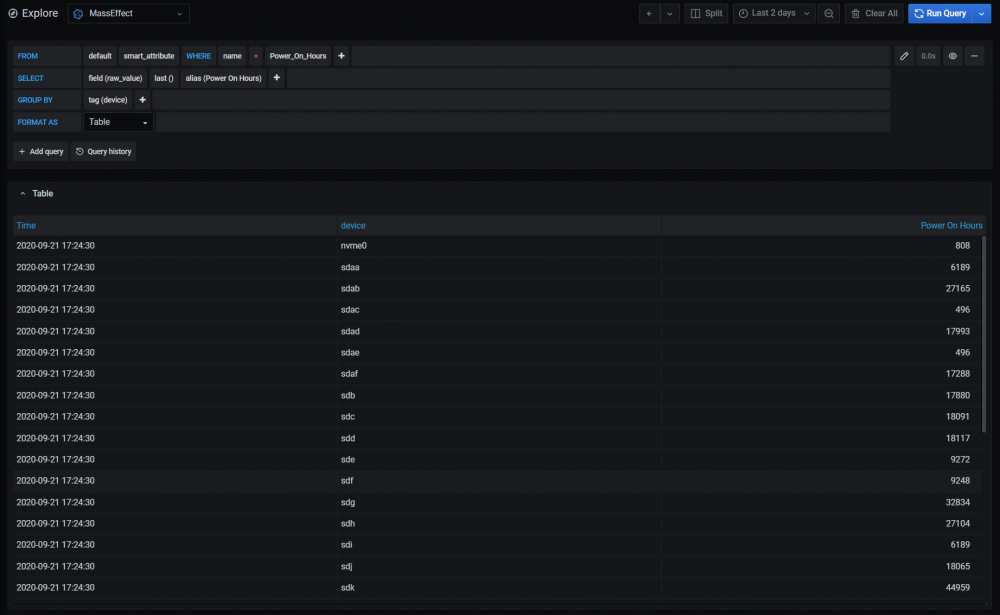
Thanks. I meant the actual GUI version of the query. Like This. I need to see both the query and data to properly troubleshoot.
-
Glad to hear it is working "awesome"! Happy to help. Please post a screenshot of the query on that panel. Should be easy to fix...
-
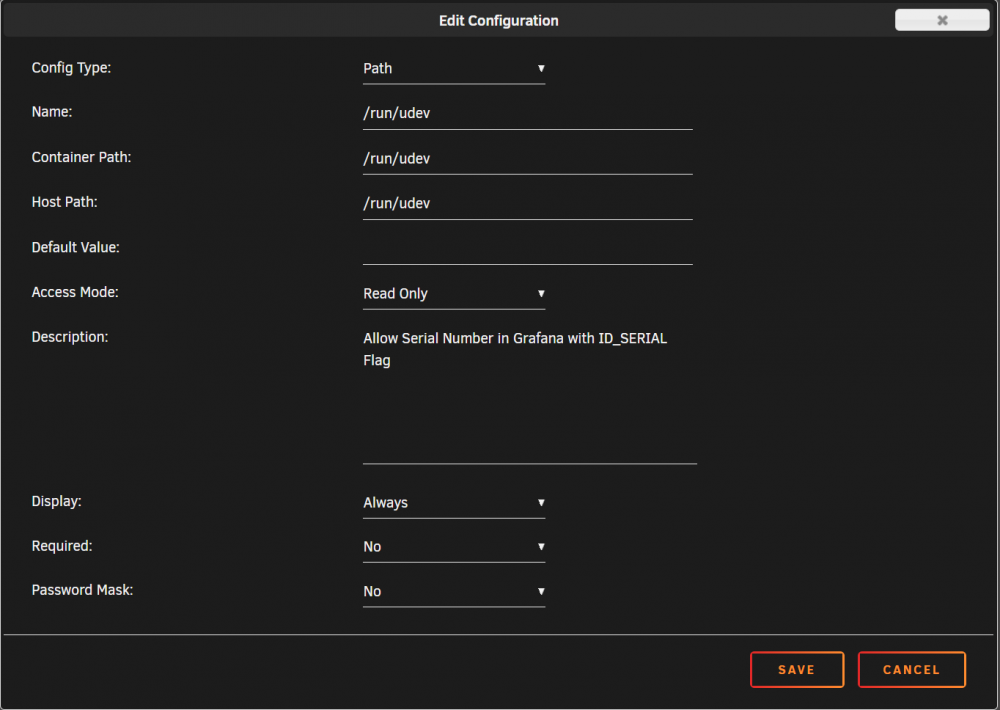
Thanks again. I've updated the install/dependencies/release notes sections on post 1 accordingly. Nice to know the official Telegraf Docker will now include this "/run/udev" path by default now! Now all anyone has to do in order to use serial numbers on DISKIO is amend the Telegraf Config. One less step is always nice. 😎
-
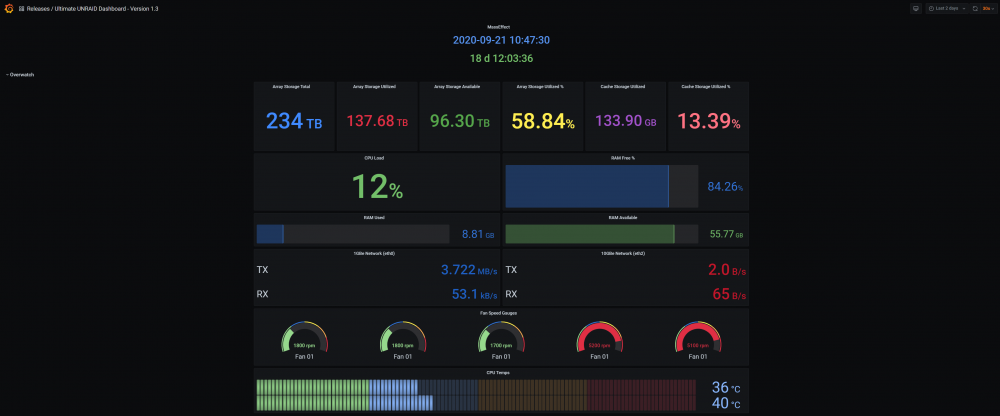
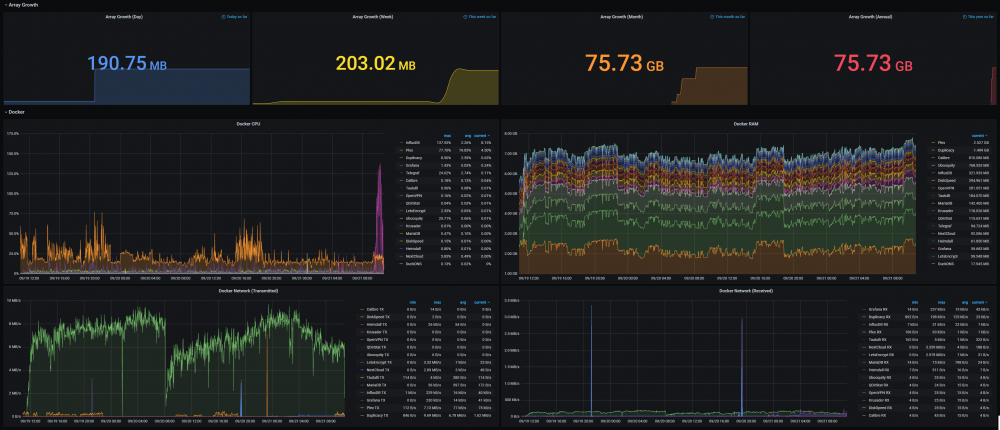
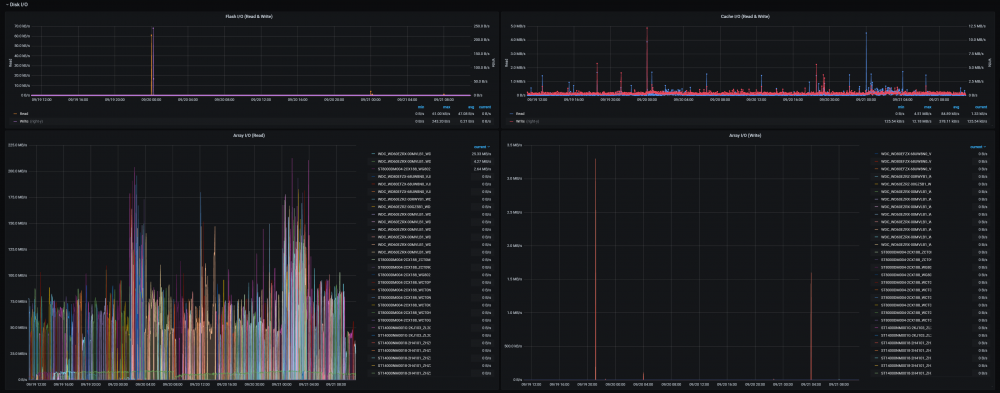
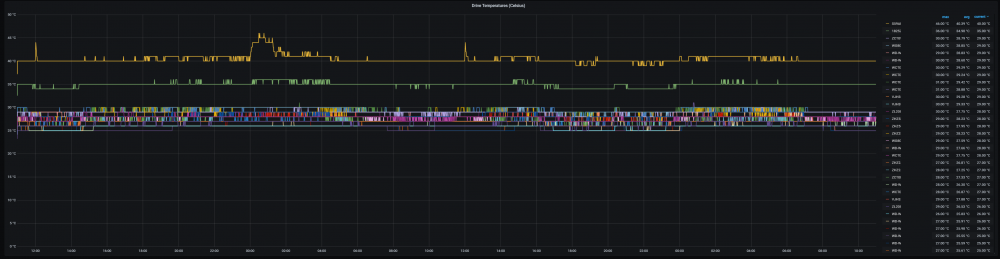
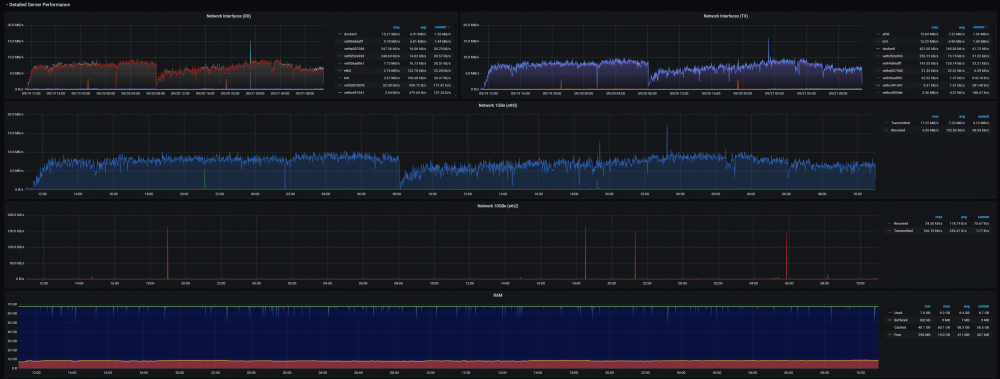
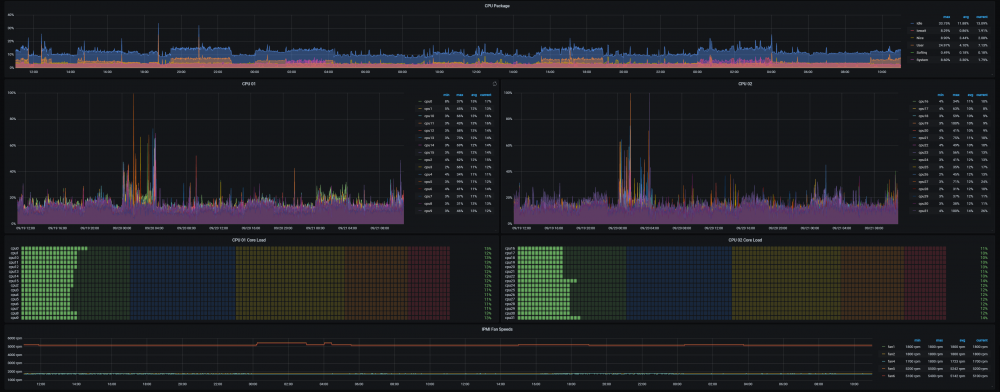
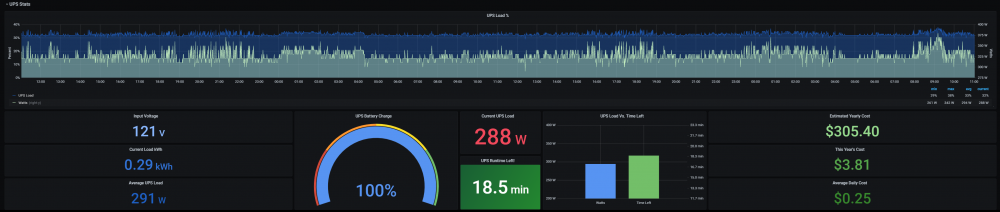
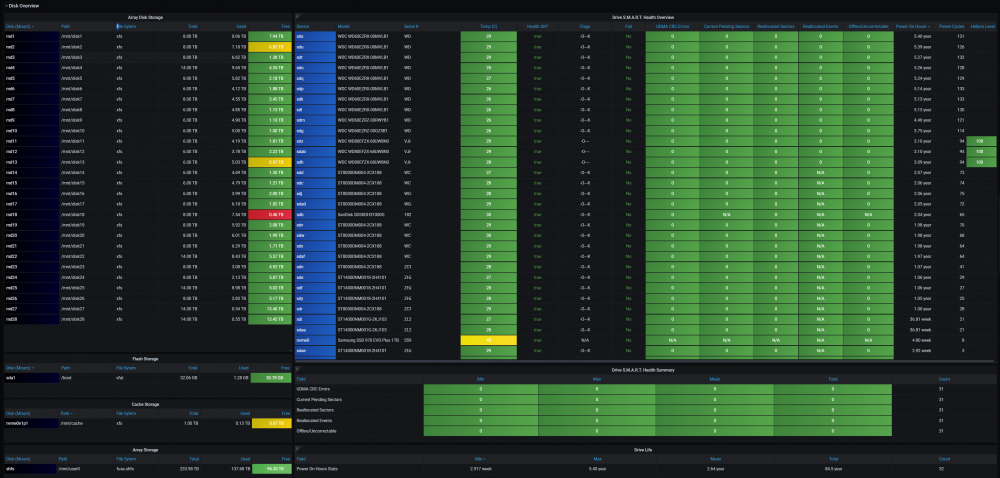
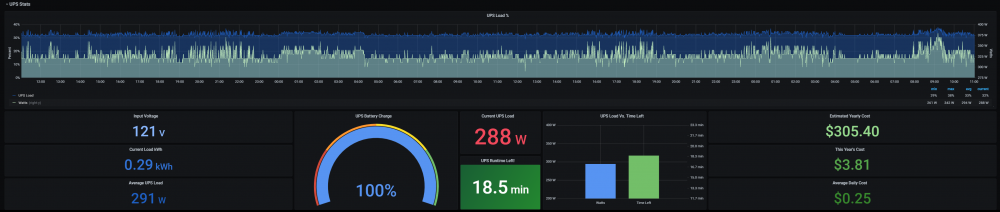
Hi everyone. Just wanted to post this here in case anyone was interested! Introducing the Ultimate UNRAID Dashboard (UUD). I just released version 1.3 last night. Forum Post: Version 1.3 Screenshots:
-
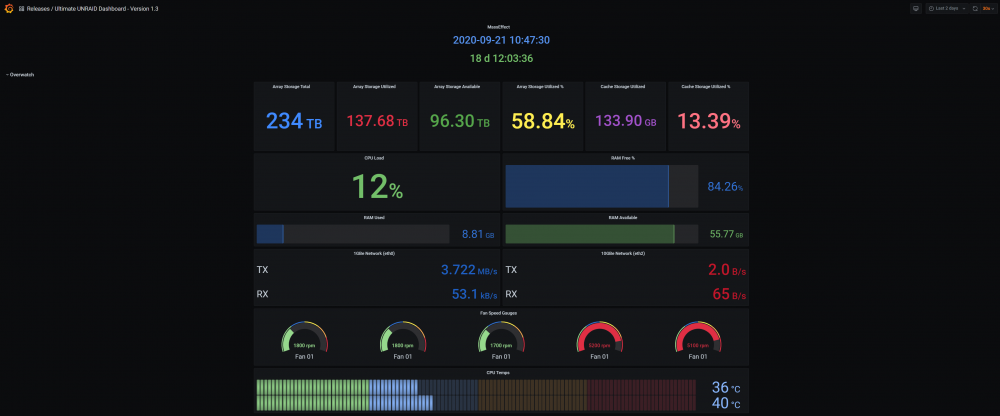
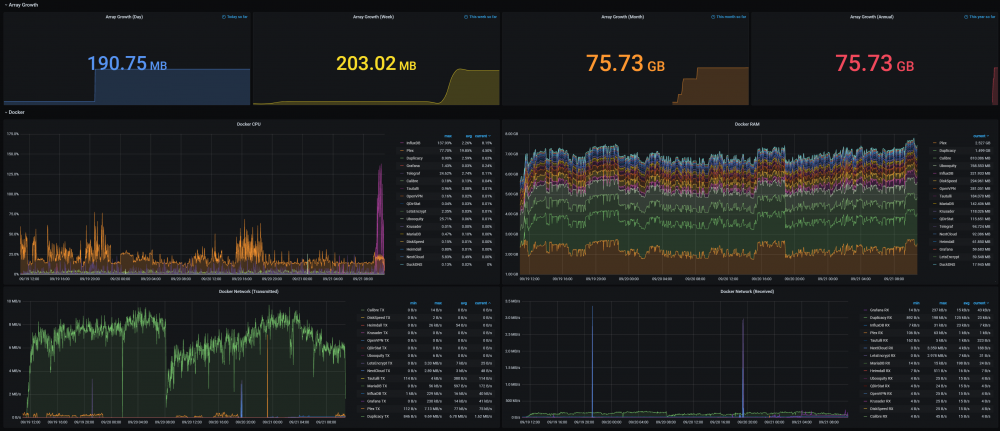
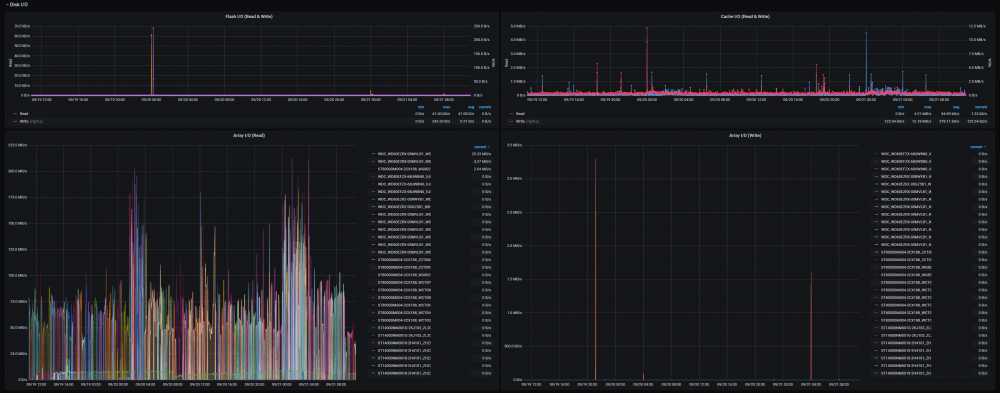
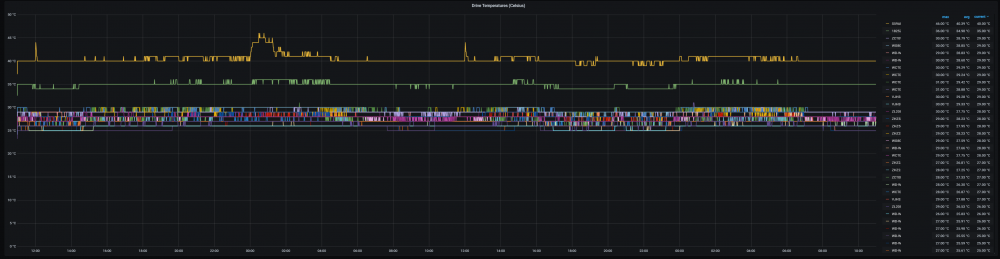
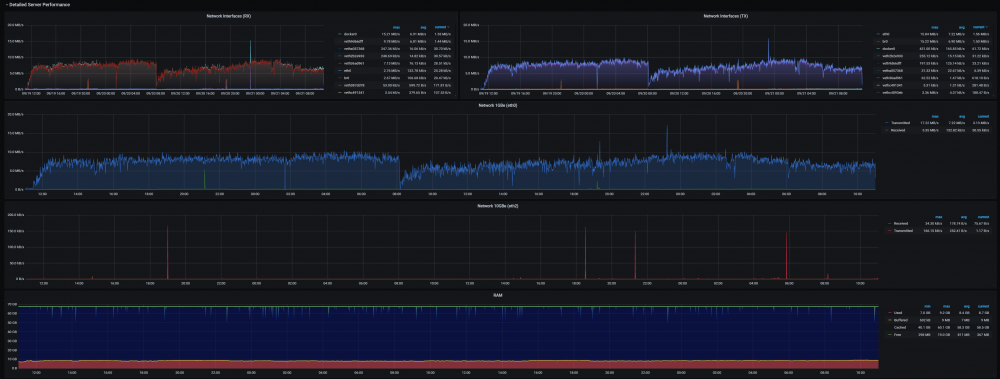
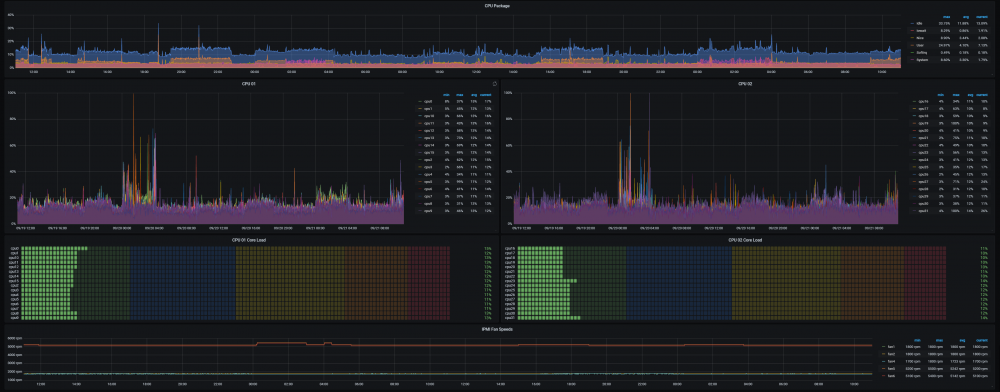
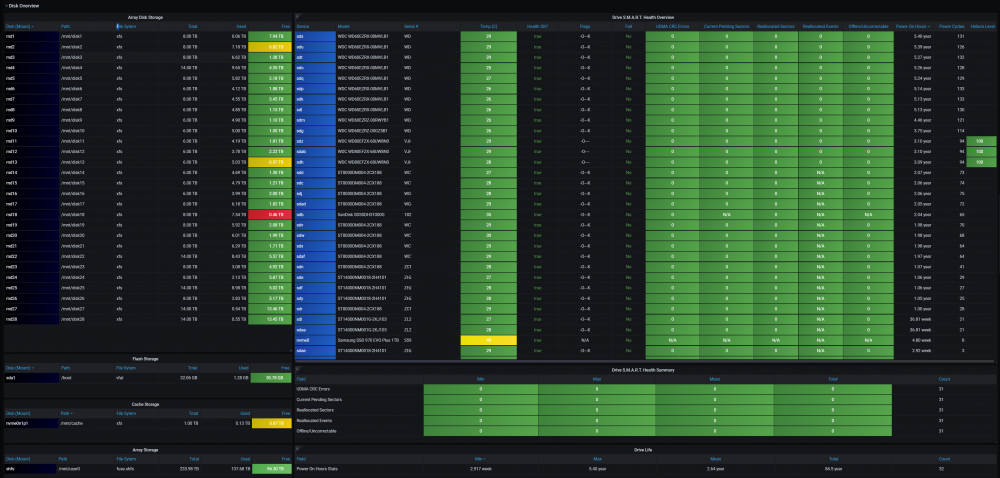
Per @SpencerJ request, here are updated pictures of UUD Version 1.3 Notes: These are Very High Resolution Screenshots on a 4K Monitor. Click For Full Screen Detail Serial Numbers Are Redacted When I get some time, I'll perform the serial number to drive number mappings using overrides, and will share those screenshots.
-
Wow! Yeah, I’ll post it here now. I’m honored! Thanks.
-
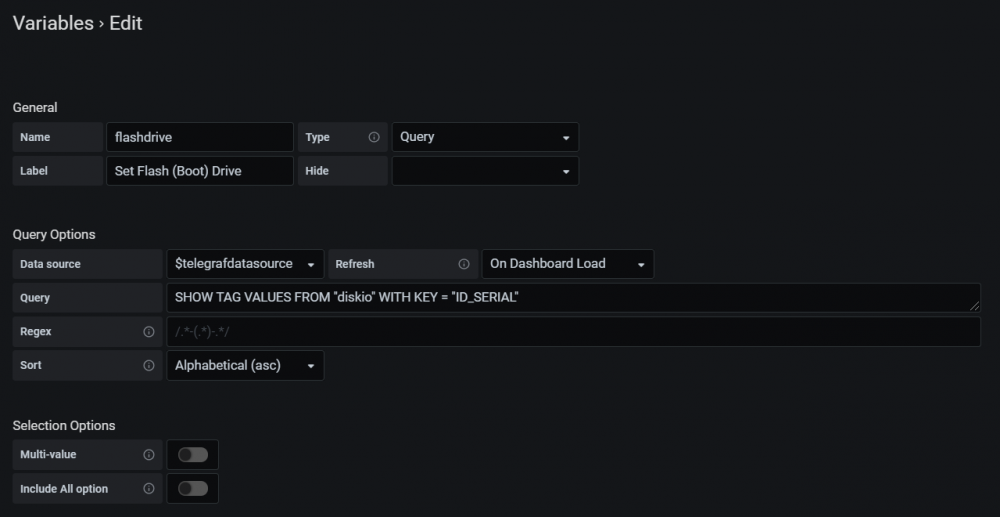
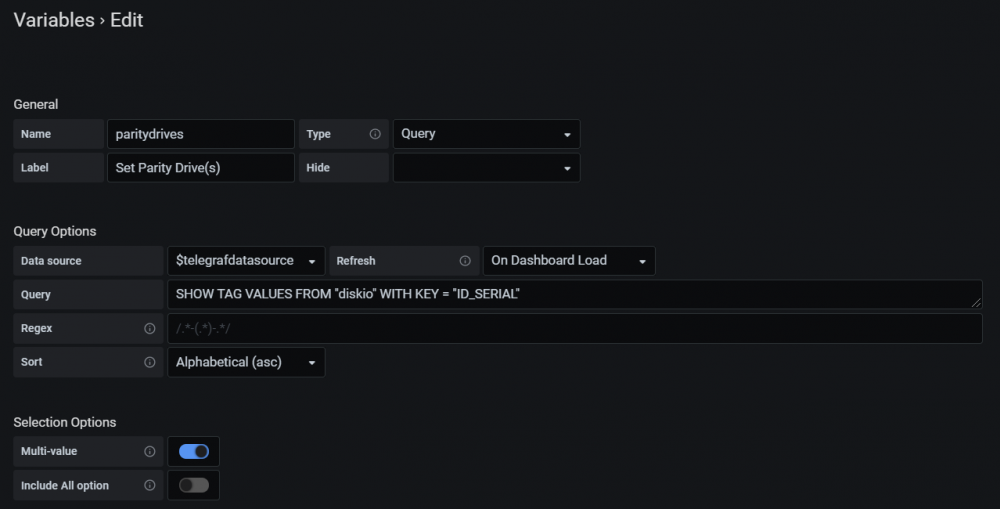
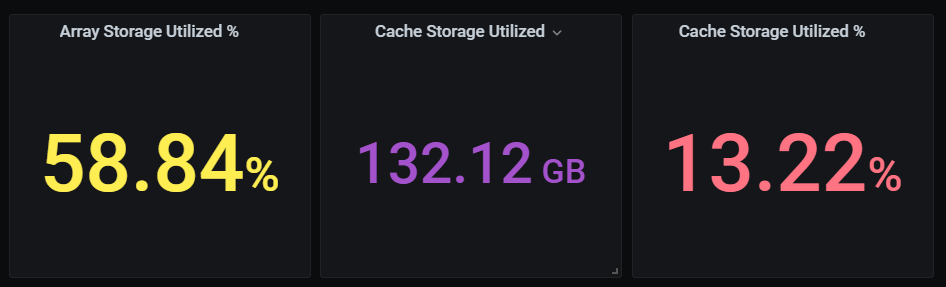
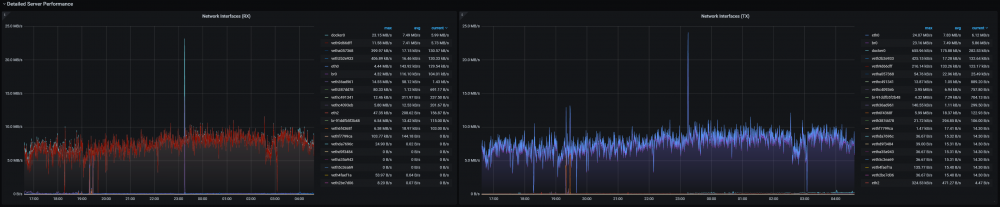
VERSION 1.3 IS FINALLY HERE! After many many hours, little sleep, and just short of a metric crap-ton of edits/revisions/code changes/code merges, I have finally finished development on UUD version 1.3. This is a HUGE update and should make everyone's lives much easier trying to adapt this to their own UNRAID server. The dashboard is now extremely dynamic. I have removed hard coding throughout and implemented REGEX where possible. If it can't work for EVERYONE's server, I rewrote the code so it could. I wanted to give a HUGE shout-out to @GilbN for his continued help, support, and coding on this dashboard. He has been extremely helpful, especially with the dynamics (REGEX and Global Dashboard Variables). Without further ado... Core Changes: This Release is Related to Bug Fixes, Code Cleanup, Adding More Dynamic Ability For a Vast Range of Users/Configurations, and Continued Fine Tuning Added/Modified Dashboard Variables (See Below) to Support Wide Range of Users/Architecture/Use Cases Implemented REGEX Throughout Dashboard When and Where Possible Re-Wrote All Code Using Serial Numbers Where Possible (DiskIO, S.M.A.R.T. Device Temperatures, etc.) You Can Now Set Value Mappings on These Serials Numbers to Forever Label Drives by Drive Number! See Panel Descriptions For Usage Requires Additional Setup: There is a Way to Make Drive Order/Mapping Permanent by Using the Serial Number of the Drive Add the Following Path to the Telegraf Docker Then Edit telegraf.conf > [[inputs.diskio]] > Add device_tags = ["ID_SERIAL"] > Use ID_SERIAL Flag in Grafana This Means That Upon Booting, You Don't Have to Worry About SD* Mounts Changing You Could Override the Serial Number With "DISK01" etc. So the Serials Would Never Show Unless You Want Them To Fan Speed Gauges: Added Regex to Extract Fans From IPMI Sensors List Updated Drive Temperatures (Celsius) Panel to Display All Drive Temps Including Flash (Boot) Updated Docker CPU to Use New Variable Name "cputhreads" Instead of "cpucores" (Deprecated) Changed All Array Share Queries to Use Path = "/mnt/user0" Instead of Device = "sfhs" (Provides More Accurate/Consistent Results) Changed/Ensured All Panel Reference Query IDs to Be In Order by Appearance/Alphabetical (Query 1 = A, Query 2 = B, etc.) Changed All References and Code Involving Dual Assets to 1/2 As Opposed to 0/1 Not Treating as an Array - Example: CPU 00/CPU 01 Becomes CPU 01/CPU 02 Updated Code In Drive S.M.A.R.T. Health Summary Panel to Use Current Standards/Nomenclature Bug Fixes: UPS - Cost This Year Resolved Calculation Error Where Proper Daily Growth Was Not Enumerating Grammatical Errors Throughout Dashboard New Panels/Graphs Array Storage Utilized % Displays Percentage of Array Usage Cache Storage Utilized Displays Usage in GB of Cache Drive(s) Cache Storage Utilized % Displays Percentage of Cache Drive(s) Usage Network Interfaces (TX) Uses REGEX | Includes All Networks Interfaces (NICs, Bridges, Docker, & Virtual) Network Interfaces (RX) Uses REGEX | Includes All Networks Interfaces (NICs, Bridges, Docker, & Virtual) UI Changes: Moved Uptime Clock Panel Above "Overwatch" Section Changed Uptime Clock Panel to Transparent Style Moved Array/Disk Stat Panels to Very Top of Dashboard Renamed Panels Fan Speeds > Fan Speed Gauges Disk Storage > Array Disk Storage Drive S.M.A.R.T. Health > Drive S.M.A.R.T. Health Overview Drive Temperatures > Drive Temperatures (Celsius) CPU 00 > CPU 01 CPU 01 > CPU 02 UPS Load vs Time Left > UPS Load Vs. Time Left This Year's Cost > Cost This Year Dashboard Variables: Modified CPU Cores Variable Name to Match Label: cpucores > cputhreads Modified UPS Variables to Have "UPS" Prefix in Name kwhprice > upskwhprice maxwatt > upsmaxwatt Added Flash (Boot) Drive Variable Uses Serial Numbers. This way it will NEVER CHANGE. Set it once and forget it! (Requires New Dependency - See Above) Usage: Select Single Flash (Boot Drive) Added Parity Drive(s) Variable Uses Serial Numbers. This way they will NEVER CHANGE. Set it once and forget it! (Requires New Dependency - See Above) Usage: Select 1 or More Parity Drives Added Cache Drive(s) Variable Uses Serial Numbers. This way they will NEVER CHANGE. Set it once and forget it! (Requires New Dependency - See Above) Usage: Select 1 or More Cache Drives Added Array Drive(s) Variable Uses Serial Numbers. This way they will NEVER CHANGE. Set it once and forget it! (Requires New Dependency - See Above) Usage: Select 1 or More Array Drives (Not Flash, Not Parity, & Not Cache) Added Descriptions To Following Panels: Fan Speed Gauges Note: Uses REGEX to Parse Fan Names From IPMI Sensor List! Array Growth (Week) Note: Query Options > Min Interval - Must Match on Week/Month/Year (Set to 2h [2 Hours] by Default For Performance Reasons Array Growth (Month) Note: Query Options > Min Interval - Must Match on Week/Month/Year (Set to 2h [2 Hours] by Default For Performance Reasons) Array Growth (Annual) Note: Query Options > Min Interval - Must Match on Week/Month/Year (Set to 2h [2 Hours] by Default For Performance Reasons) Docker CPU Note: Uses Variable Flash I/O (Read & Write) Note: Uses Variable Cache I/O (Read & Write) Note: Uses Variable Array I/O (Read) Note: Uses Variables | Use Overrides > Display Name to Dynamically Name Serial Number (Field Name) to Drive Number Array I/O (Write) Note: Uses Variables | Use Overrides > Display Name to Dynamically Name Serial Number (Field Name) to Drive Number Drive S.M.A.R.T. Health Overview Note: Uses REGEX Drive Temperatures (Celsius) User Overrides > Display Name to Dynamically Name Serial Number (Field Name) to Drive Number Network Interfaces (RX) Note: Uses REGEX | Includes All Networks Interfaces (NICs, Bridges, Docker, & Virtual) Network Interfaces (TX) Note: Uses REGEX | Includes All Networks Interfaces (NICs, Bridges, Docker, & Virtual) CPU 01 Note: Uses REGEX To Find Cores in CPU 01. Change REGEX According to Your Number of Cores! Example: CPU 01 Has 8 Cores (16 With HyperThreading) - The REGEX For Cores 0-15 is "/cpu(1[6-9]|2[0-9]|3[01])|cpu-total/" CPU 02 Note: Uses REGEX To Find Cores in CPU 02. Change REGEX According to Your Number of Cores! Example: CPU 02 Has 8 Cores (16 With HyperThreading) - The REGEX For Cores 16-31 is "/cpu(1[6-9]|2[0-9]|3[01])/" CPU 01 Core Load Note: Uses REGEX To Find Cores in CPU 01. Change REGEX According to Your Number of Cores! Example: CPU 01 Has 8 Cores (16 With HyperThreading) - The REGEX For Cores 0-15 is "/cpu(1[6-9]|2[0-9]|3[01])|cpu-total/" CPU 02 Core Load Note: Uses REGEX To Find Cores in CPU 02. Change REGEX According to Your Number of Cores! Example: CPU 02 Has 8 Cores (16 With HyperThreading) - The REGEX For Cores 16-31 is "/cpu(1[6-9]|2[0-9]|3[01])/" IPMI Fan Speeds Note: Uses REGEX to Parse Fan Names From IPMI Sensor List! UPS Load % Note: Uses Variables Current Load kWh Note: Uses Variables Average UPS Load Note: Uses Variables Current UPS Load Note: Uses Variables UPS Load Vs. Time Left Note: Uses Variables Estimated Yearly Cost Note: Uses Variables | Adjust Field Unit For Your Set UPS Currency Variable As Required! Actual Cost This Year Note: Uses Variables | Adjust Field Unit For Your Set UPS Currency Variable As Required! Average Daily Cost Note: Uses Variables | Adjust Field Unit For Your Set UPS Currency Variable As Required! See Post Number 1 For the New JSON File! Alright, I'm finally heading to bed. Let me know if you run into any issues. Thanks guys. I hope you ENJOY! 😁






-
So version 1.3 has been peer-reviewed by @GilbN (thanks!). Needless to say, there is A LOT of code to merge before I can release it. I'll start working on this later tonight. Plan is to have this released by the end of weekend for you guys to enjoy.
-
Thanks I'll check it out.
-
So this is totally possible. The only problem is that I don't run a GPU on my UNRAID build. I have a dedicated gaming rig for that stuff. So we'll have to have you or someone else be a guinea pig and help us out. The plugin does exist though, so it is just a matter of coding it. Perhaps we could even add a variable (boolean true/false) if you have a GPU, then have the dashboard react to it. @GilbN you run any Nvidai GPUs? I bet you already have like 3 RTX-3080 pre-orders being shipped you lucky... 🤣 Plugin Info: https://github.com/influxdata/telegraf/tree/release-1.15/plugins/inputs/nvidia_smi
-
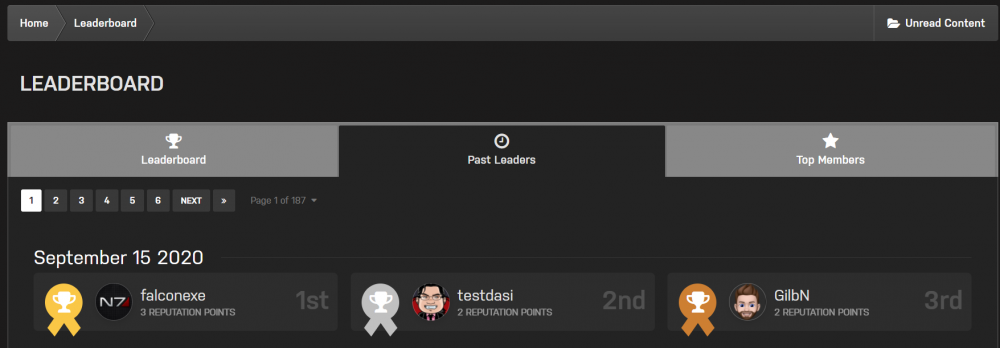
Hey guys, just wanted to say a huge thanks for putting @GilbN and I in the top 3 yesterday on the entire forum. Never thought that would happen. We really appreciate it! (wipes away small tears...) 😅

-
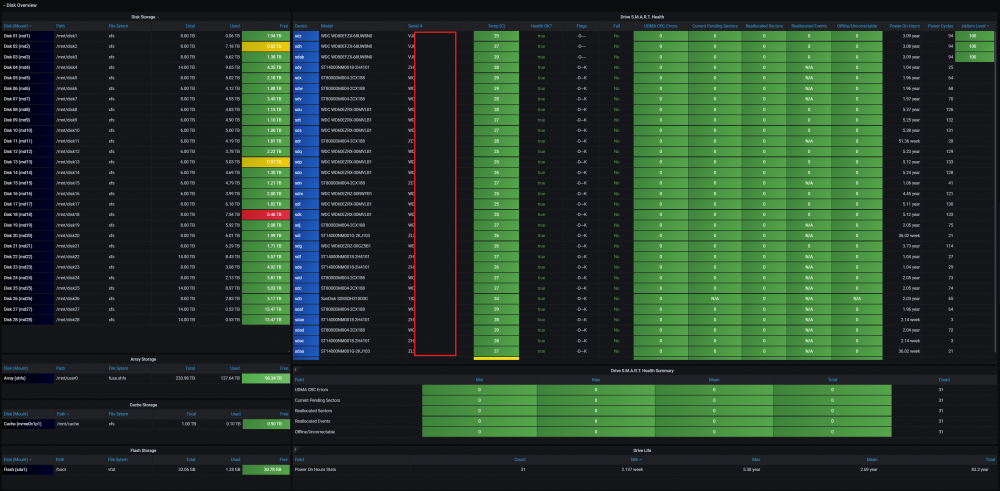
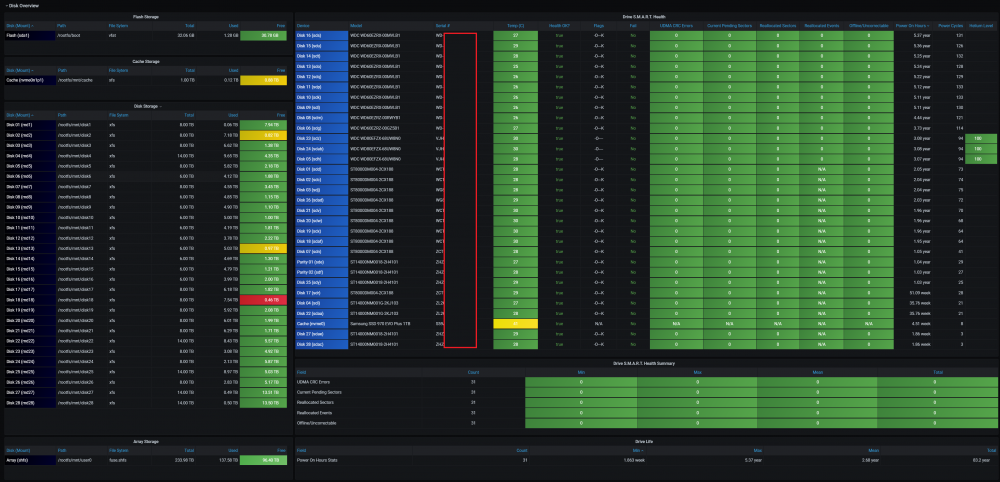
Also re-balanced the Disk Overview UI. This will also be in Version 1.3. Changes: Put the 2 Largest Tables Side by Side Dropped the Cache/Flash Storage Panels to the Bottom (Under Array Storage) Put the Count (Number of Disks) Stat on the Right Side of Drive S.M.A.R.T. Health Summery Panel This Centers the Green Stat Cells with/on the Table Above (Much Easier on the Eyes and More Cohesive) Before: After:
-
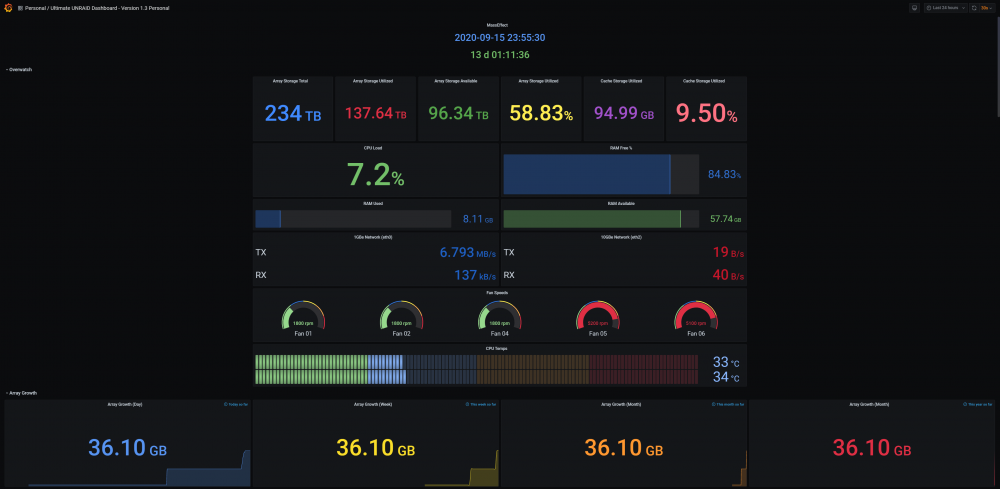
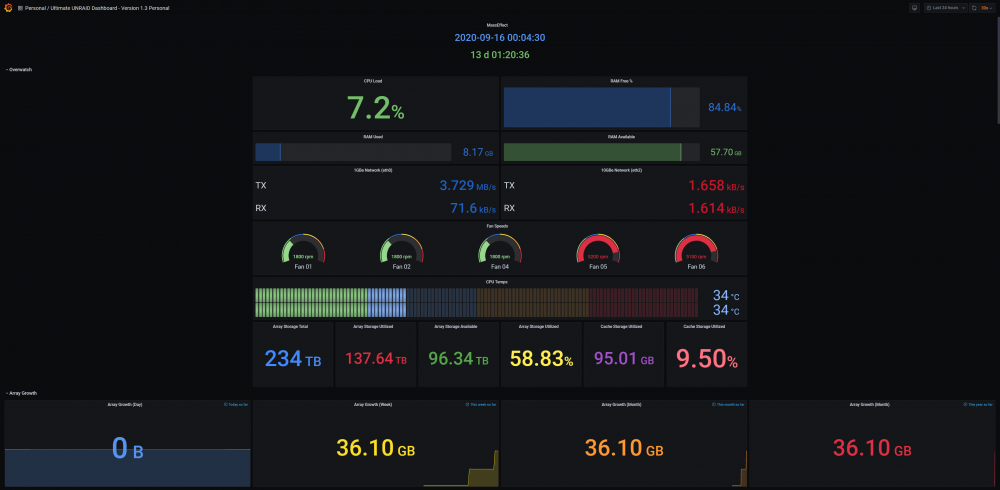
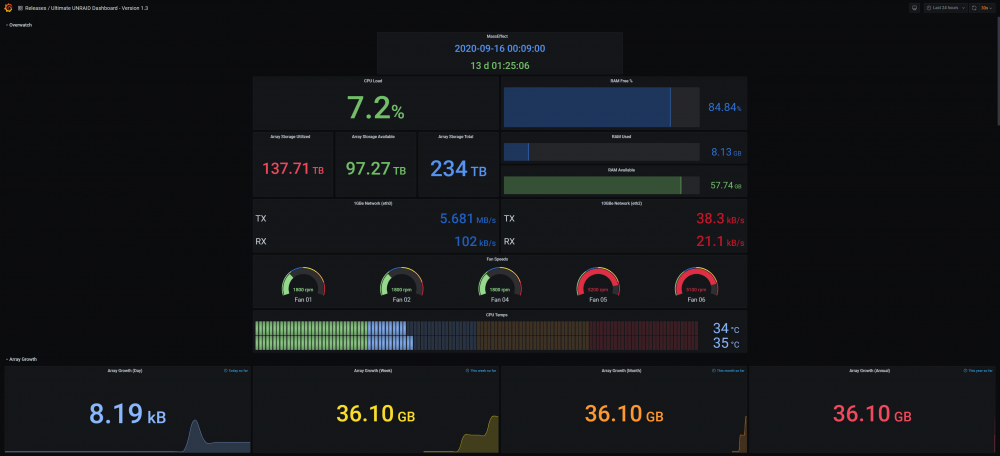
Messing with some new disk stats on my personal build within the "Overwatch" section. Added: Array Storage Utilized % Cache Storage Utilized Amount Cache Storage Utilized % Changed: Made Up-time Clock Transparent Placed the Disk Utilization Panels At the Very Top (The first thing data hoarders want to know is how much space they have...) Alt Option: Place Them Above Array Growth Charts? Moved the RAM Meters Down and Now Side By Side Let me know if you guys like these new panels/layout and your thoughts on the colors (you can change them to whatever you want on your side). I'll probably add these three new panels to version 1.3 before it gets released. Before: After: After Alt Option (I may actually like this one the best LOL):
-
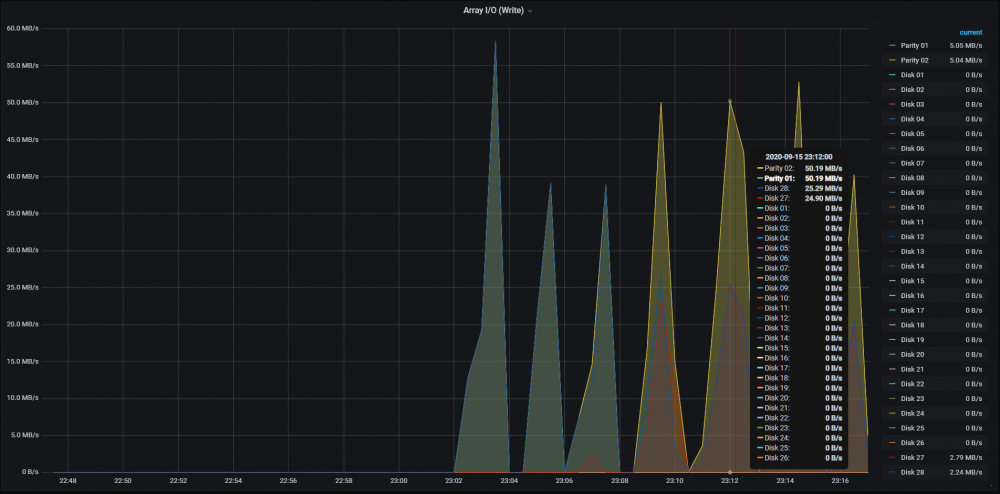
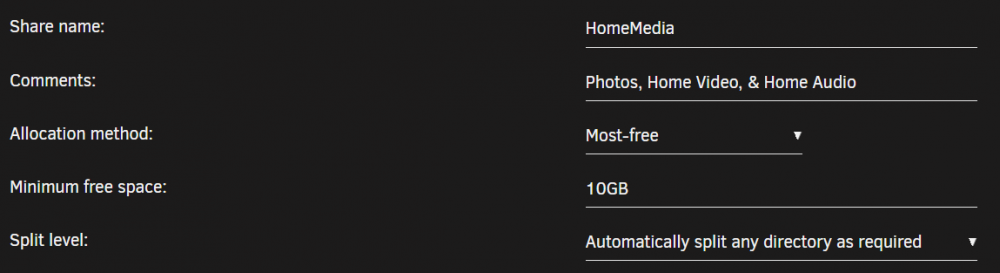
Man I love being able to see what drives my data dumps are going to! Super convenient to make sure your split levels, and allocation method are working. Disk 27 and 28 are my newest 14TB drives with the most free space.

-
Alright guys. I just finished development on falconexe's Version 1.3, and it is being peer reviewed by @GilbN. I'll release it as soon as it is through this stage. This release is related to bug fixes, code cleanup, adding more dynamic ability for a vast range of users and configurations, and continued fine tuning. In version 1.4 we can focus on net new panels, graphs, gauges, and use cases. If you have any code to share, thoughts or suggestions, or requests, let them rip! Can't promise we can do everything, but between GilbN and I, I'm sure we'll figure most of it out. Thanks again for all of the positive feedback, constructive criticism, DMs and your support. I never thought this thing would blow up like it did, but clearly our fellow UNRAID users love this stuff as much as we do! 😁
-
👍 @RockDawg Thanks for the feedback man. Makes all of this hard, but fun work, meaningful!
-
With mixed drives sizes, using metric bytes is nice because Grafana can auto adjust the unit. However, I segregated these panels by base unit so TBs show in whole numbers, and GBs show in whole numbers. This is very important when setting thresholds (colors) because 1TB is not 1GB, but rather 1000. You can’t apply thresholds on mixed units because they won’t scale. Hence the groupings I did...








