


cinereus
Members
-
Joined
-
Last visited
Everything posted by cinereus
-
How do we do this now it's been removed from Nerd Tools?
-
There is no "hardware status" on my dashboard. This is with QNAP TS-EC1079 Pro.
-
I have two unraid servers and one Windows machine. I have installed Tailscale on all of them. They can all ping each other. All machines can add SMB shares from the other machines over the LAN. However, I can't get SMB shares to add over Tailscale IP. In Windows and unraid I can see the SMB share at /lanip/share but it doesn't work with /tailscaleip/share
-
Speedtest tracker docker just stopped working for me too.
-
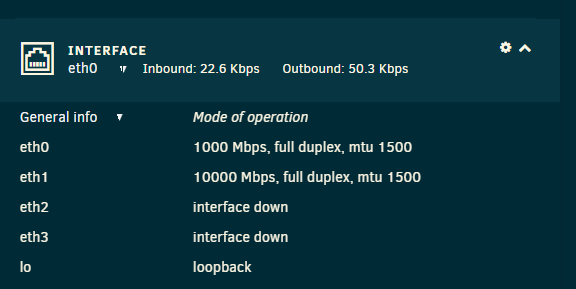
Yes. eth0 works completely fine. Very strangely, what seems to have fixed it is moving over from 192.168.1.x to 192.168.2.x. No idea what the issue was there....
-
I have changed to a new dedicated 1 Gbps port which still has the same issue. It says connected but won't ping.
-
It's currently been up for several hours in a row and still can't ping in either direction.
-
Thanks for the detailed reply. Have you had any issue with the connections on the backplate? That's my main concern apart from drive bays and thermals.
-
Yeah but it's not currently dropped. It's currently connected. I still can't ping. Before I could ping when connected and not ping (obviously) when dropped.
-
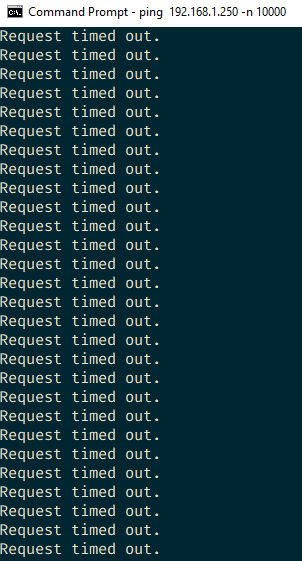
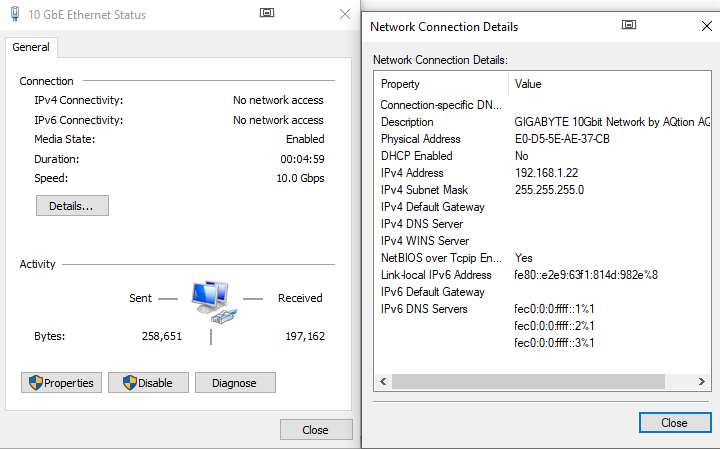
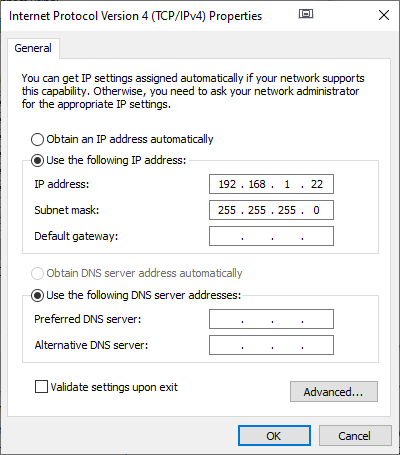
There's no router involved - it's a direct connection. But even when it's up I can't ping. That's the main issue for now. This is when the link is up:
-
I bought high quality CAT-6 thinking that would be enough. Sadly maybe not. I need flat cables to run under carpet. It's a direct connection so no switch involved at all.
-
Would it be at all possible to mod this case to make space for 3 x 5.25" bays so you fit a 5x3.5" rack in the top? Unfortunately only 10 HDD is a bit of a dealbreaker for me, I'd love to have room for 11.
-
fs-diagnostics-20231114-1721.zip
-
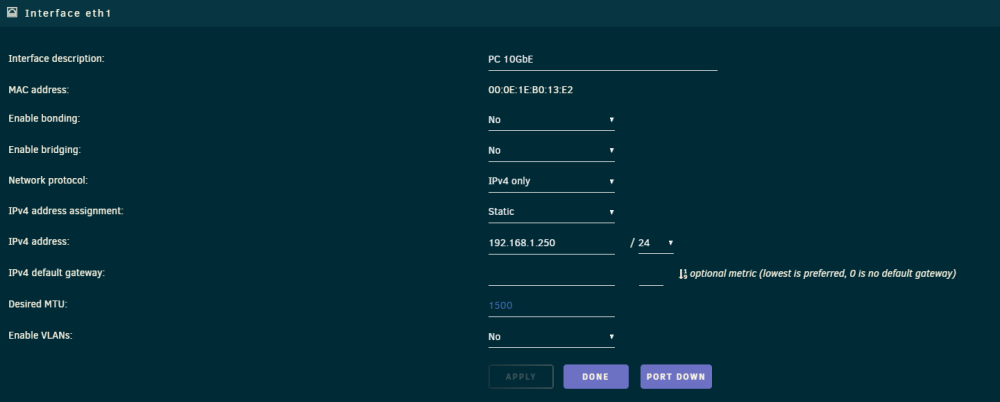
I have a direct connection from my Windows PC to eth1 on my unraid box. The Windows ethernet is set up as 192.168.0.22 and the unraid machine is set up as 192.168.1.250. They were pinging fine but now suddenly I can't ping either to or from the unraid box any more. The weird thing is that Windows sees the connect and says it's enabled and up. And Unraid sees the connection too, they just can't speak to each other suddenly. Here's my Windows and Unraid settings:

-
Thanks. This is using a Dell card but yes the cable is about 20m length. Sadly I think upgrading everything to Mellanox and fibre is out of my budget
-
Is this more likely to be a cable issue or a card issue?fs-diagnostics-20231114-1721.zip
-
I'm still getting SSL/AWS related errors trying to run speedtest-cli even after updating python through nerdpack: python2.7 speedtest-cli --version ✘ 4.71 95% 16:31 ERROR:root:code for hash md5 was not found. Traceback (most recent call last): File "/usr/lib64/python2.7/hashlib.py", line 147, in <module> globals()[__func_name] = __get_hash(__func_name) File "/usr/lib64/python2.7/hashlib.py", line 97, in __get_builtin_constructor raise ValueError('unsupported hash type ' + name) ValueError: unsupported hash type md5 ERROR:root:code for hash sha1 was not found. Traceback (most recent call last): File "/usr/lib64/python2.7/hashlib.py", line 147, in <module> globals()[__func_name] = __get_hash(__func_name) File "/usr/lib64/python2.7/hashlib.py", line 97, in __get_builtin_constructor raise ValueError('unsupported hash type ' + name) ValueError: unsupported hash type sha1 ERROR:root:code for hash sha224 was not found. Traceback (most recent call last): File "/usr/lib64/python2.7/hashlib.py", line 147, in <module> globals()[__func_name] = __get_hash(__func_name) File "/usr/lib64/python2.7/hashlib.py", line 97, in __get_builtin_constructor raise ValueError('unsupported hash type ' + name) ValueError: unsupported hash type sha224 ERROR:root:code for hash sha256 was not found. Traceback (most recent call last): File "/usr/lib64/python2.7/hashlib.py", line 147, in <module> globals()[__func_name] = __get_hash(__func_name) File "/usr/lib64/python2.7/hashlib.py", line 97, in __get_builtin_constructor raise ValueError('unsupported hash type ' + name) ValueError: unsupported hash type sha256 ERROR:root:code for hash sha384 was not found. Traceback (most recent call last): File "/usr/lib64/python2.7/hashlib.py", line 147, in <module> globals()[__func_name] = __get_hash(__func_name) File "/usr/lib64/python2.7/hashlib.py", line 97, in __get_builtin_constructor raise ValueError('unsupported hash type ' + name) ValueError: unsupported hash type sha384 ERROR:root:code for hash sha512 was not found. Traceback (most recent call last): File "/usr/lib64/python2.7/hashlib.py", line 147, in <module> globals()[__func_name] = __get_hash(__func_name) File "/usr/lib64/python2.7/hashlib.py", line 97, in __get_builtin_constructor raise ValueError('unsupported hash type ' + name) ValueError: unsupported hash type sha512 Traceback (most recent call last): File "speedtest-cli", line 133, in <module> from md5 import md5 File "/usr/lib64/python2.7/md5.py", line 10, in <module> from hashlib import md5 ImportError: cannot import name md5
-
Thanks. In case the person I was replying to does not see this, are there any affordable 3 in 2s? Also, if it's useful, I used to run that FatCage back in 2006 and it worked fine for me.
-
Bit of a necropost but are there any good 5 in 3s available in 2023?
-
Thank you. I fixed the error there wasn't enough space. Unfortunately I didn't get any notifications though.
-
Still getting the same issue. Looks like a tar error.
-
Thanks. What should permissions be?
-
Oh I misread that as 6.1.2. Yes I'm on 6.9.2. How do I backup my appdata?
-
I have searched "Appdata Backup" in Apps and I have also looked at this post. There is no other option called "Appdata backup" to be found anywhere.
-
I thought I have done that. I installed Appdata Backup 2.5 and I still get the error I posted above. Still not working.


