LMD
Members
-
Joined
-
Last visited
Everything posted by LMD
-
Did fix it lately, but seems since the last update Grana is broken again. Unraid Version: 6.11.5 Telegraf Version: telegraf:1.20.2-alpine Influx Version: influxdb:1.8.4-alpine Tried setting rights correct for Grafana, but no luck on that. Appdata and then "chmod a+rwX grafana" Any solution on this error?
-
Works like a charm! Thanks.
-
I have an error I did not encounter before, and I don't have a solution for it: logger=ngalert.multiorg.alertmanager t=2022-11-03T16:26:20.799011295+01:00 level=error msg="unable to create Alertmanager for org" org=1 err="error writing file notifications: unable to create the working directory \"/var/lib/grafana/alerting/1\": mkdir /var/lib/grafana/alerting/1: permission denied" logger=cli t=2022-11-03T16:26:20.799745318+01:00 level=error msg="Critical error" reason="runtime error: invalid memory address or nil pointer dereference" stackTrace="goroutine 1 [running]:\nruntime/debug.Stack()\n\t/usr/local/go/src/runtime/debug/stack.go:24 +0x65\ngithub.com/grafana/grafana/pkg/cmd/grafana-server/commands.executeServer.func2()\n\t/drone/src/pkg/cmd/grafana-server/commands/cli.go:143 +0x94\npanic({0x3123440, 0x5c53a60})\n\t/usr/local/go/src/runtime/panic.go:884 +0x212\ngithub.com/grafana/grafana/pkg/services/ngalert/notifier.(*Alertmanager).ApplyConfig(0x0, 0xc001aa12f0?)\n\t/drone/src/pkg/services/ngalert/notifier/alertmanager.go:318 +0xae\ngithub.com/grafana/grafana/pkg/services/ngalert/notifier.(*MultiOrgAlertmanager).SyncAlertmanagersForOrgs(0xc001c6bbc0, {0x3f0eb60, 0xc00005a038}, {0xc0016c5d48, 0x1, 0x3f10108?})\n\t/drone/src/pkg/services/ngalert/notifier/multiorg_alertmanager.go:208 +0x772\ngithub.com/grafana/grafana/pkg/services/ngalert/notifier.(*MultiOrgAlertmanager).LoadAndSyncAlertmanagersForOrgs(0xc001c6bbc0, {0x3f0eb60, 0xc00005a038})\n\t/drone/src/pkg/services/ngalert/notifier/multiorg_alertmanager.go:140 +0xd8\ngithub.com/grafana/grafana/pkg/services/ngalert.(*AlertNG).init(0xc000a3ec60)\n\t/drone/src/pkg/services/ngalert/ngalert.go:138 +0x3ac\ngithub.com/grafana/grafana/pkg/services/ngalert.ProvideService(0xc0002a6000, {0x3f007f8?, 0xc0012d8330}, {0x3f2e020?, 0xc000cddae0}, {0x3f28140?, _}, _, {0x3f13dc0, 0xc0013328a0}, ...)\n\t/drone/src/pkg/services/ngalert/ngalert.go:73 +0x4a9\ngithub.com/grafana/grafana/pkg/server.Initialize({{0x7ffd7205bca6, 0x18}, {0x7ffd7205bc8a, 0x12}, {0xc0000520d0, 0x5, 0x5}}, {{0x0, 0x0}, {0x0, ...}, ...}, ...)\n\t/drone/src/pkg/server/wire_gen.go:366 +0x41cb\ngithub.com/grafana/grafana/pkg/cmd/grafana-server/commands.executeServer({0x7ffd7205bca6, 0x18}, {0x7ffd7205bc8a, 0x12}, {0x0, 0x0}, {0x7ffd7205bccb, 0x6}, 0x203000?, {{0x3ed8694, ...}, ...})\n\t/drone/src/pkg/cmd/grafana-server/commands/cli.go:188 +0x785\ngithub.com/grafana/grafana/pkg/cmd/grafana-server/commands.RunServer({{0x3ed8694, 0x5}, {0x3ed9948, 0xa}, {0x3ed868c, 0x4}, {0x3ed9938, 0xa}})\n\t/drone/src/pkg/cmd/grafana-server/commands/cli.go:111 +0x758\nmain.main()\n\t/drone/src/pkg/cmd/grafana-server/main.go:16 +0xb7\n" I did try to reinstall the docker, without any success.
-
It seems that an update of the plugin ITE IT87 Driver solved my problem with seeing fan and fanspeeds. Which is Awesome!
-
Can confirm that it is fixed! Thanks ❤️
-
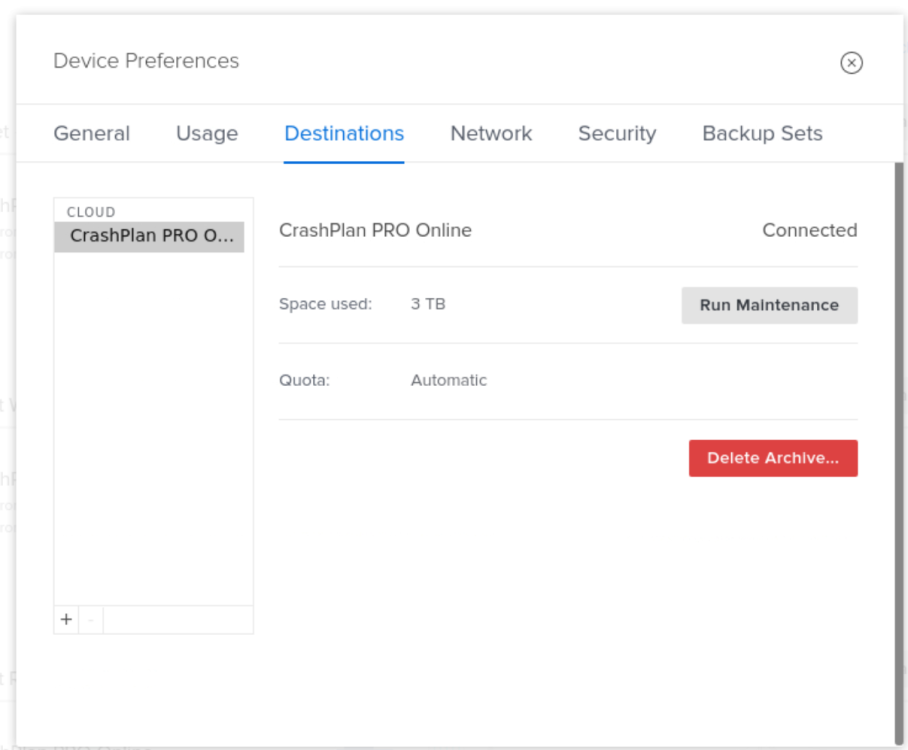
The + left under the Cloud - Crashplan PRO Online. After hitting that button: Gives Unable to connect after refreshing, did check some log files in the AppData, but could not find a clue where to go.

-
I moved my USB backup to other solution, but now when i would like to edit the location, the docker seems to crash. I cannot really find a clue in the log files and could use some help. If somebody could tell me which logs are needed, I can post them here.
-
I moved my system from an Intel platform (Z170 Chip) to AMD X570S, but with that my fan's ain't visible anymore. I tried the ITE IT87 Driver plugin, but without luck. The motherboard i moved to is the Gigabyte X570S AERO G Sensors and sensors-detect: root@Mindfix4:~# sensors nvme-pci-0400 Adapter: PCI adapter Composite: +48.9°C (low = -273.1°C, high = +81.8°C) (crit = +84.8°C) Sensor 1: +48.9°C (low = -273.1°C, high = +65261.8°C) Sensor 2: +56.9°C (low = -273.1°C, high = +65261.8°C) acpitz-acpi-0 Adapter: ACPI interface temp1: +16.8°C (crit = +20.8°C) MB Temp: +16.8°C (crit = +20.8°C) nvme-pci-0100 Adapter: PCI adapter Composite: +38.9°C (low = -273.1°C, high = +81.8°C) (crit = +84.8°C) Sensor 1: +38.9°C (low = -273.1°C, high = +65261.8°C) Sensor 2: +42.9°C (low = -273.1°C, high = +65261.8°C) k10temp-pci-00c3 Adapter: PCI adapter CPU Temp: +45.6°C Tccd1: +36.5°C Tccd2: +35.0°C root@Mindfix4:~# sensors-detect # sensors-detect version 3.6.0 # System: Gigabyte Technology Co., Ltd. X570S AERO G [-CF] # Kernel: 5.19.14-Unraid x86_64 # Processor: AMD Ryzen 9 3900X 12-Core Processor (23/113/0) This program will help you determine which kernel modules you need to load to use lm_sensors most effectively. It is generally safe and recommended to accept the default answers to all questions, unless you know what you're doing. Some south bridges, CPUs or memory controllers contain embedded sensors. Do you want to scan for them? This is totally safe. (YES/no): Silicon Integrated Systems SIS5595... No VIA VT82C686 Integrated Sensors... No VIA VT8231 Integrated Sensors... No AMD K8 thermal sensors... No AMD Family 10h thermal sensors... No AMD Family 11h thermal sensors... No AMD Family 12h and 14h thermal sensors... No AMD Family 15h thermal sensors... No AMD Family 16h thermal sensors... No AMD Family 17h thermal sensors... Success! (driver `k10temp') AMD Family 15h power sensors... No AMD Family 16h power sensors... No Hygon Family 18h thermal sensors... No Intel digital thermal sensor... No Intel AMB FB-DIMM thermal sensor... No Intel 5500/5520/X58 thermal sensor... No VIA C7 thermal sensor... No VIA Nano thermal sensor... No Some Super I/O chips contain embedded sensors. We have to write to standard I/O ports to probe them. This is usually safe. Do you want to scan for Super I/O sensors? (YES/no): Probing for Super-I/O at 0x2e/0x2f Trying family `National Semiconductor/ITE'... No Trying family `SMSC'... No Trying family `VIA/Winbond/Nuvoton/Fintek'... No Trying family `ITE'... Yes Found unknown chip with ID 0x8689 Probing for Super-I/O at 0x4e/0x4f Trying family `National Semiconductor/ITE'... No Trying family `SMSC'... No Trying family `VIA/Winbond/Nuvoton/Fintek'... No Trying family `ITE'... Yes Found unknown chip with ID 0x8695 Some systems (mainly servers) implement IPMI, a set of common interfaces through which system health data may be retrieved, amongst other things. We first try to get the information from SMBIOS. If we don't find it there, we have to read from arbitrary I/O ports to probe for such interfaces. This is normally safe. Do you want to scan for IPMI interfaces? (YES/no): Probing for `IPMI BMC KCS' at 0xca0... No Probing for `IPMI BMC SMIC' at 0xca8... No Some hardware monitoring chips are accessible through the ISA I/O ports. We have to write to arbitrary I/O ports to probe them. This is usually safe though. Yes, you do have ISA I/O ports even if you do not have any ISA slots! Do you want to scan the ISA I/O ports? (YES/no): Probing for `National Semiconductor LM78' at 0x290... No Probing for `National Semiconductor LM79' at 0x290... No Probing for `Winbond W83781D' at 0x290... No Probing for `Winbond W83782D' at 0x290... No Lastly, we can probe the I2C/SMBus adapters for connected hardware monitoring devices. This is the most risky part, and while it works reasonably well on most systems, it has been reported to cause trouble on some systems. Do you want to probe the I2C/SMBus adapters now? (YES/no): Using driver `i2c-piix4' for device 0000:00:14.0: AMD KERNCZ SMBus Module i2c-dev loaded successfully. Next adapter: NVIDIA i2c adapter 4 at b:00.0 (i2c-0) Do you want to scan it? (yes/NO/selectively): Next adapter: NVIDIA i2c adapter 6 at b:00.0 (i2c-1) Do you want to scan it? (yes/NO/selectively): Next adapter: NVIDIA i2c adapter 7 at b:00.0 (i2c-2) Do you want to scan it? (yes/NO/selectively): Now follows a summary of the probes I have just done. Just press ENTER to continue: Driver `k10temp' (autoloaded): * Chip `AMD Family 17h thermal sensors' (confidence: 9) No modules to load, skipping modules configuration. Unloading i2c-dev... OK Seems the following chip ID's are in the need of a driver; Found unknown chip with ID 0x8689 Found unknown chip with ID 0x8695 Google didn't give a good direction on which "Super IO Sensors" it are and I have no idea if there is a plugin that would help with Unraid for this. So is there anybody that could help me out with this?
-
Seems I get stuck on after I try to login on the webinterface. Tried differtent things, even checked log folder (which is empty): /mnt/user/appdata/binhex-mineos-node/mineos/logs Tried multiple options: 1. Other port number 2. Fixed IP adress on Custom:BR0 3. Windows VM under Unraid 4. Different webbrowsers 5. Clean install of the docker Did try to search for a solution, but no luck. Any suggestions for this problem?
-
Takes both ways times, download seems a bit faster then upload for the times i did restore some matters from it. Thanks, trying it now
-
Seems the update is out. Hopefully you find time to update it upcomming week, gladly the backup is running to another disk