

weirdcrap
-
Posts
454 -
Joined
-
Last visited
Content Type
Profiles
Forums
Downloads
Store
Gallery
Bug Reports
Documentation
Landing
Everything posted by weirdcrap
-
Help identifying possible drive issue [Solved]
weirdcrap replied to weirdcrap's topic in General Support
It doesn't. The errors that unRAID reports have nothing to do with those SMART parameters. Those raw error rates are caused by the fact that the drive is trying to read tiny magnetic fluctuations close to the limits of what is physically possible. It's a tiny signal amongst a lot of noise and it needs advanced signal processing and error correction to get a result. The raw error rate is very high on all hard drives; it's just that Seagate reports it while others do not. Just ignore it - unRAID does. The errors in the unRAID GUI are because some of your disks dropped off-line. If a disk is off-line then an attempt to read it will fail. You were running a parity check when the disks dropped off-line, which involves reading every byte from every disk, so that's a lot of errors. It already does ignore SMART parameters 1 and 7. See for yourself: Settings -> Disk Settings then scroll down to Global SMART Settings and see that it only monitors parameters 5, 187, 197 and 198 by default. That makes sense, thanks for the explanation. So you are thinking this is a cable/power/controller issue? I forgot to mention that the SuperMicro card is plugged into one of my two PCI-E 3.0 x16 slots (Updated with OP for more details). It shouldn't make a difference but i want to make sure I share as much info as I can. What would be my ideal testing procedure moving forward here? Like I said I don't really want to mess around with trying a bunch of parity builds and then checks as I am worried about beating on the array to much while it is unprotected. Is the suspect most likely: -Power connections? -SATA connections? -Could it be two of the Norco SS-500s I got on ebay are damaged? I'm thinking swap the old 2TB parity with the location of the current 4TB and do a parity build on to the 2TB and see if it reports any errors. If the build and a subsequent check don't report any errors I can assume that it isn't the bay or cable that the 4TB was plugged into. Or should I first attempt to re-seat the expansion card, check cables, power, etc before moving on to parity re-builds and checks on the 4TB? -
Help identifying possible drive issue [Solved]
weirdcrap replied to weirdcrap's topic in General Support
@trurl: The diagnostic dump attached to my OP should not contain the first incident where all of those drives dropped that I posted a screenshot of. I had to hard reboot the server after that first time so there wouldn't have been a syslog or anything else to show for it. I should have tried to get a dump while the webui was still working but alas I did not. None of my other subsequent parity checks or rebuilds on the 4TB disk had a "catastrophic" failure like that first time did. No disk errors have since been reported on the "main" tab. I see different error numbers on my non-correcting check vs my correcting check (almost 5x as many during correcting). Like I mentioned in the OP after the hard reboot all of the disks re-appeared and the array started fine. I now only see parity errors during parity operations. None of the other disks have dropped again. I wanted to expand on my post above yours (trying to provide as much info as possible) and mention that when my array had the 2 x 2TB parity drives I had no issues making a full backup of my main array (20TB+ of data) via samba and 4TB or so from USB disks all without a single controller or disk error. Sent from my Nexus 6P using Tapatalk -
Help identifying possible drive issue [Solved]
weirdcrap replied to weirdcrap's topic in General Support
After seeing all of my Seagate drives across both servers reporting these "errors" I agree that I should be able to ignore them. I personally like to be made aware anytime a non-erroneous smart error appears so I am glad it was brought to my attention. My question is, if this was a known thing Seagate drives do why does UnRAID report these as errors with a parity disk but completely ignores them when they are data disks? Turns out they do. Here is my up to date Server layout hastily notated in paint. Two ports on the motherboard and all of the ports for my SuperMicro AOC-SASLP-MV8 dropped during that first parity build I described. In case you can't understand my paint markup: -Drive 1 (my old parity disk) is just chilling as a hot spare and was not part of the array at all when this happened. -Drives 2-5 are on one of the two breakout cables from my SuperMicro AOC-SASLP-MV8 and they all dropped. -Drives 16-19 make up the other breakout cable from my SuperMicro card. -Drive 20 is the 4TB new parity disk I am having issues with and is connected directly to the motherboard. Thanks so far for your help, we are getting this narrowed down and now have some suspects. A few weeks ago when I first got all my "new" parts in I did some playing around with dual parity (2x 2TB disks) and had a couple rebuilds and parity checks under my belt with this setup and had no issues for the few weeks I had it set up like that. Only things I have changed was remove dual parity, re-assign one disk as data other as hot spare, and try to move to this 4TB disk. Haven't touched any of the hardware inside since I first put it all back together. I am inclined to point the finger at these Norco bays to start as they are one of the few components (besides some new SATA cables) in this rebuild that wasn't in use in the old flawless build I had going. They were bought used on Ebay for a sweet price ($40 x 4 plus $20~ for shipping). Supposedly (this is ebay after all) they were all pulled from working servers that were being decommissioned and were said to be fully functional besides some cosmetic stuff. They all appear to work just fine in the limited testing I did (plug drive in, make sure it powers on, mounts and I can read/write a couple gigs of data to it). I have never had any issues with this SuperMicro card before this changeover. Same can be said for my power supply (a seasonic x-series 650 or 750 can't remember which) and it should be more than enough to power 20 drives, your basic computer components (CPU, RAM, etc), and an old GTX200 series PCI graphics card for troubleshooting when WebUI is down. I will try re-seating expansion cards, SATA cables, and power connections in that order to see if I can't find the root cause. Does anyone have suggestions for a good way to QUICKLY test for the issues I am experiencing? This is my older system and a lot of these drives are 5+ years young so I would prefer to avoid subjecting my disks to multiple parity checks, rebuilds, etc unless absolutely necessary. -
Help identifying possible drive issue [Solved]
weirdcrap replied to weirdcrap's topic in General Support
See my edit in the OP. I would have to check my drive serial numbers to my array layout when I get home to be sure but I'm fairly certain they are spread across multiple bays and controllers. I will come back and update this post once I get home to check. -
*NEW INFORMATION AT BOTTOM OF POST* I recently made some substantial hardware changes to my second UnRAID backup machine and I am now having issues with a new disk I have introduced. My array consists of a mix of 2TB disks and a single 4TB parity drive. Old specs: Mobo: ASROCK 880GMLE-FX CPU: AMD FX-6300 Black Edition RAM: 8GB (2x 4GB) Corsair Ballistix DDR3 Storage Cards: SuperMicro AOC-SASLP-MV8 Total Drives: 16 x 2TB (1 Parity x 15 data) Drives were all mounted in CoolerMaster 4x3 bay expanders where each drive had an individual power and SATA connection. PCI/PCIE Layout: 1x PCIE x1<----- IOCrest IO-PCE9215-4I 1x PCIE x16 <---- SuperMicro Card 2x PCI <----- Graphics Card my new specs: Mobo: ASUS M5A97 R2.0 CPU: AMD FX-6300 Black Edition RAM: 16GB (4x 4GB) Corsair Ballistix DDR3 Storage Cards: SuperMicro AOC-SASLP-MV8 8x drives 2x SYBA SI-PEX40064 aka. IOCrest IO-PCE9215-4I 7x drives across the two cards Other six drives are connected directly to motherboard. Total Drives: 19 x 2TB 1 x 4TB (1 4TB Parity x 19 2TB data) These are all in NORCO SS-500 5-Bay SATA / SAS Hot Swap Rack Module with individual SATA connections per drive and shared power from 2x molex connectors per bay. PCI/PCIE Layout: 1 x PCIe 2.0 x16 (blue) <---- Empty 1 x PCIe 2.0 x16 (x4 mode, black) <---- SuperMicro Card 2 x PCIe 2.0 x1 <----- IOCrest IO-PCE9215-4I cards 2 x PCI <----- One Empty, one PCI Nvidia GTX200 series Graphics Card EDIT2: Going to disable virtualization in BIOS as I never plan on using it with this machine and I spent all day reading about marvell based storage controllers and the issues discovered with virtualization for some users. Also plan to do a more balanced layout for disks to better distribute bandwidth for optimum speeds: New PCI/PCIE Layout: 1 x PCIe 2.0 x16 (blue) <---- SuperMicro Card x6 disks 1 x PCIe 2.0 x16 (x4 mode, black) <---- SuperMicro Card x6 disks 1 x PCIe 2.0 x1 <----- Empty 1 x PCIe 2.0 x1 <----- IOCrest IO-PCE9215-4I card x2 disks (last 6 on Mobo). 2 x PCI <----- One Empty, one PCI Nvidia GTX200 series Graphics Card So after my rebuild I got my array all situated and everything was working fine (besides speed issues which is issue for another post) with a 2TB parity drive and 18 2TB data drives. This past weekend I decided to swap in a 4TB Seagate NAS HDD that I had sitting around as a cold spare for my other UnRAID server. This would allow me to replace disks in the old system as they die with newer 4TB disks to expand my backup capacity. This cold spare was pre-cleared with the pre-clear script and had two full rounds run on it and it reported no problems. NOTE: I did NOT put the 4TB disk in the same bay as the old parity drive. I figured I could just leave the old one in place for a hot spare. I will try swapping their bays if the community recommends it. In addition I have 7 of these same model drives Now this is where things seem to go bad fast. I start the parity rebuild and leave it sit as it says it is going to take about 24 hours to complete. I checked on it before I went to sleep and it was still running fine. In the morning I woke up and checked my notifications and saw a notice for the array that stated the parity build had completed and then immediately after I received a failed health report from UnRAID. I manage to get the webui to work long enough to see that the parity disk, disks 1-4, disks 11-12, & disks 15-16 are all reporting some crazy number of errors in the tens of millions. I try to view drive smart information but nothing appears to be working quite like it should be. I try telnet and SSH in to the machine, connection refused. I use the WebUI to stop the array and it manages to do that before showing me this: At this point the WebUI is just stuck saying waiting for available socket in chrome. I waited for a couple hours to see if it would start responding before I ended up having to do a hard shutdown. Once I got the machine rebooted all the drives showed up fine and the array started normally and wanted to do a parity check. I stopped the check because I wanted to look at the drives first. Of all of the drives that supposedly had errors the only one that seemed to show any sign of actual problems was the 4TB drive (see attached smart report from the drive). I ran both a short and extended SMART test and both passed without error: Num Test_Description Status Remaining LifeTime(hours) LBA_of_first_error # 1 Extended offline Completed without error 00% 1987 - # 2 Short offline Completed without error 00% 1980 - Here are the particular values (these are much higher than they were the first time as I have done subsequent work and testing): 1 Raw read error rate 0x000f 080 064 044 Pre-fail Always Never 108284144 7 Seek error rate 0x000f 081 060 045 Pre-fail Always Never 121797733 I decided to run a non-correcting parity check and see what happened. The check completed and listed the exact same number of parity errors that I saw previously and this time around no disks dropped and no "disk errors" were reported (or whatever the error column on the main screen represents). Decided to try and run a correcting parity check this time just to test because at this point I am prepared to swap back to my old 2TB parity drive so I don't care if I hose the parity on the 4TB disk. I let it run for about 8 hours and in that time it reported an additional 102,861,929 errors. Normally I would just write this off as a bad drive and cut my loses. What has me curious about this is that none of the usual indicators of a failing drive are present such as pending re-allocated sectors, unrecoverable sectors, etc. I don't think it would be power as these bays share a common power back plane across the five drives so I assume that a power issue would manifest itself across all the disks in that bay in some way, shape, or form. So my question(s) to the community are: -is this a sign of a bad drive or possibly some sort of cable issue? -Should I immediately discontinue use of the suspect drive for the sake of restoring parity protection to my array? -Or do you all think I should try swapping cables, bays, etc before I write this drive off as toast? EDIT: after writing this massive post I decided to look at my other server that has 7 of these drives in it that I have had no issues with. Well low and behold literally every single ST4000VN000-1H4168 drive I have is reporting ludicrous numbers of read and seek errors in SMART for these drives. I never noticed any of these errors before because my parity drive in that machine is a 4TB HGST NAS drive which doesn't report these errors. Now the question becomes, can I somehow get unraid to ignore these two smart error values? Is that even recommended, or should I just get a drive that doesn't report erroneous errors? Does anyone else have experience with these drives and this issue? void-diagnostics-20170124-1414.zip void-smart-20170124-1446.zip

-
[Support] Linuxserver.io - Plex Media Server
weirdcrap replied to linuxserver.io's topic in Docker Containers
https://github.com/linuxserver/docker-plex#setting-up-the-application The "fun" part is finding an exact version number that doesn't end up a 404 in the Git pull. I have one saved I used to fall back due to Roku issues. x.x.x.xxxx-xxxxxxx Its about 3 or 4 weeks back as of today? Hope that helps. ps. no this is NOT a dvr version number. *mod - don't post plexpass version numbers I am also having Roku issues, Plex has become unwatchable for me. Does anyone have a solution? Is it just to roll back to this magical x.x.x.xxxx-xxxxxxx version number where Roku playback wasn't completely f*cked? -
[Support] Linuxserver.io - Musicbrainz
weirdcrap replied to linuxserver.io's topic in Docker Containers
Mine was working fine for about a week. Now the logs look the same as they did when it was working but the page just says waiting infinitely and it doesn't respond to queries from applications. Going to Try deleting everything and starting again like CHBMB suggested and see if it sorts itself out. Otherwise I might just download the VM image from their site and use that to run it from my Windows box where it will hopefully be less temperamental. -
[Support] Linuxserver.io - Cardigann
weirdcrap replied to linuxserver.io's topic in Docker Containers
No idea. Better off asking in couchpotato forum or torrentpotato if you get no replies from anyone else here. Under the TorrentPotato section you put in the TorrentPotato link for that tracker from Cardigann into the host field. You then put the Cardigann API key into the Pass key field. Leave the username field blank (I haven't seen anything require this field). Make sure the box at the begginning of the field next to host is checked as this shows that you want to enable that searcher. That should be all you need. -
What's the Public version? A fork of Jackett that includes support for public trackers not just private ones.
-
[Support] Linuxserver.io - Musicbrainz
weirdcrap replied to linuxserver.io's topic in Docker Containers
Follow up question on this, what kind of update interval does this use to pull changes from MusicBrainz? Is it weekly? As changes are made? Do I need to restart the container to pull new data? -
Recent unRAID releases have begun saving syslog.txt to the root of the flash. Powerdown saved timestamped logs and diagnostics to the logs folder, so perhaps you uninstalled powerdown in September? I believe they are talking about adding configurable saving of logs and diagnostics, and I believe the Tips and Tweaks plugin has features to do it also. That sounds about right, I uninstalled it whenever he announced that he was discounting support for the powerdown plugin. So UnRAID only saves the most recent shutdown log now? EDIT: I installed dlandon's tips and tweaks plugin to regain the syslog archiving as I find it indispensable to be able to look back at past logs for troubleshooting intermittent issues. Sent from my Nexus 6P using Tapatalk
-
Thanks for the reply. So far after two reboots it has always been IRQ #16 that has problems and it seems to happen after I have tried to plugin a USB device and mount it with unassigned devices as far as I can tell. Neither time has it affected a port or set of ports that have something important plugged in like my APC or the boot flash. Like I said I had issues with UAD yesterday with a device and didn't notice anything in the log about the IRQ until this morning. Then after the reboot I tried to plug in a completely different device and the same thing happened. I can't recall if both times it was usb1. I will try updating my test box to the latest RC even though it isn't having this issue and if everything seems stable I will upgrade NODE next. Could you possibly answer my question at the very end of my monster post, did the place on the flash drive logs are saved get moved? my /boot/logs folder doesn't appear to have been touched since mid September...
-
I upgraded from 6.2.2 to 6.2.4 two-three days ago and I haven't really been watching the logs much. Since the upgrade to 6.2.4 I have noticed the following in my system log twice now, once this morning and once this afternoon (even after rebooting in between): Nov 11 17:12:08 Node kernel: irq 16: nobody cared (try booting with the "irqpoll" option) Nov 11 17:12:08 Node kernel: CPU: 0 PID: 11501 Comm: emhttp Not tainted 4.4.30-unRAID #2 Nov 11 17:12:08 Node kernel: Hardware name: Gigabyte Technology Co., Ltd. B85M-DS3H-A/B85M-DS3H-A, BIOS F2 08/10/2015 Nov 11 17:12:08 Node kernel: 0000000000000000 ffff88081f203e70 ffffffff8136f79f ffff8807e5674800 Nov 11 17:12:08 Node kernel: 0000000000000000 ffff88081f203e98 ffffffff8107f8ce ffff8807e5674800 Nov 11 17:12:08 Node kernel: 0000000000000000 0000000000000010 ffff88081f203ed0 ffffffff8107fb9b Nov 11 17:12:08 Node kernel: Call Trace: Nov 11 17:12:08 Node kernel: <IRQ> [<ffffffff8136f79f>] dump_stack+0x61/0x7e Nov 11 17:12:08 Node kernel: [<ffffffff8107f8ce>] __report_bad_irq+0x2b/0xb4 Nov 11 17:12:08 Node kernel: [<ffffffff8107fb9b>] note_interrupt+0x1a0/0x22e Nov 11 17:12:08 Node kernel: [<ffffffff8107d8d1>] handle_irq_event_percpu+0xe2/0xf0 Nov 11 17:12:08 Node kernel: [<ffffffff8107d915>] handle_irq_event+0x36/0x54 Nov 11 17:12:08 Node kernel: [<ffffffff810803c5>] handle_fasteoi_irq+0x8c/0xf4 Nov 11 17:12:08 Node kernel: [<ffffffff8100e0e8>] handle_irq+0x17/0x1b Nov 11 17:12:08 Node kernel: [<ffffffff8100db3e>] do_IRQ+0x46/0xc2 Nov 11 17:12:08 Node kernel: [<ffffffff8162a6c2>] common_interrupt+0x82/0x82 Nov 11 17:12:08 Node kernel: <EOI> Nov 11 17:12:08 Node kernel: handlers: Nov 11 17:12:08 Node kernel: [<ffffffff814b1e61>] usb_hcd_irq Nov 11 17:12:08 Node kernel: Disabling IRQ #16 Here is my lsdev output (I haven't restarted UnRAID again yet tonight, bunch of people streaming): Device DMA IRQ I/O Ports ------------------------------------------------ 0000:00:02.0 f000-f03f 0000:00:1f.2 27 f060-f07f f080-f083 f090-f097 f0a0-f0a3 f0b0-f0b7 0000:00:1f.3 f040-f05f 0000:02:00.0 e000-e0ff 0000:03:00.0 29 d000-d01f d020-d023 d030-d037 d040-d043 d050-d057 0000:04:00.0 30 c000-c01f c020-c023 c030-c037 c040-c043 c050-c057 7-edge 7 ACPI 1800-1803 1804-1805 1808-180b 1810-1815 1820-182f 1850-1850 acpi 9 ahci c000-c01f c020-c023 c030-c037 c040-c043 c050-c057 d000-d01f d020-d023 d030-d037 d040-d043 d050-d057 f060-f07f f080-f083 f090-f097 f0a0-f0a3 f0b0-f0b7 cascade 4 dma 0080-008f dma1 0000-001f dma2 00c0-00df dmar0 24 dmar1 25 ehci_hcd:usb1 16 ehci_hcd:usb2 23 eth0 28 fpu 00f0-00ff i801_smbus 18 f040-f05f i8042 1 12 it87 0a35-0a36 0a35-0a36 keyboard 0060-0060 0064-0064 parport0 5 0378-037a PCI 0000-0cf7 0cf8-0cff 0d00-ffff c000-cfff d000-dfff e000-efff pic1 0020-0021 pic2 00a0-00a1 pnp 04d0-04d1 0680-069f 0a00-0a0f 0a20-0a2f 0a30-0a3f 164e-164f 1854-1857 1c00-1cfe 1d00-1dfe 1e00-1efe 1f00-1ffe ffff-ffff ffff-ffff ffff-ffff PNP0C04:00 00f0-00f0 r8169 e000-e0ff rtc0 8 0070-0077 serial 03f8-03ff timer 0 timer0 0040-0043 timer1 0050-0053 vga+ 03c0-03df xhci_hcd 26 and my proc/interrupts CPU0 CPU1 CPU2 CPU3 0: 30 0 0 0 IR-IO-APIC 2-edge timer 1: 2 0 0 0 IR-IO-APIC 1-edge i8042 5: 0 0 0 0 IR-IO-APIC 5-edge parport0 7: 20 0 0 0 IR-IO-APIC 7-edge 8: 46 0 0 0 IR-IO-APIC 8-edge rtc0 9: 0 0 0 0 IR-IO-APIC 9-fasteoi acpi 12: 4 0 0 0 IR-IO-APIC 12-edge i8042 16: 100001 0 0 0 IR-IO-APIC 16-fasteoi ehci_hcd:usb1 18: 0 0 0 0 IR-IO-APIC 18-fasteoi i801_smbus 23: 29 0 0 0 IR-IO-APIC 23-fasteoi ehci_hcd:usb2 24: 0 0 0 0 DMAR-MSI 0-edge dmar0 25: 0 0 0 0 DMAR-MSI 1-edge dmar1 26: 1098951 0 0 0 IR-PCI-MSI 327680-edge xhci_hcd 27: 1357019 0 0 0 IR-PCI-MSI 512000-edge 0000:00:1f.2 28: 29824263 0 0 0 IR-PCI-MSI 1048576-edge eth0 29: 1010454 0 0 0 IR-PCI-MSI 1572864-edge 0000:03:00.0 30: 20852 0 0 0 IR-PCI-MSI 2097152-edge 0000:04:00.0 NMI: 0 0 0 0 Non-maskable interrupts LOC: 14841433 13022098 13103008 12792463 Local timer interrupts SPU: 0 0 0 0 Spurious interrupts PMI: 0 0 0 0 Performance monitoring interrupts IWI: 2 1 2 1 IRQ work interrupts RTR: 0 0 0 0 APIC ICR read retries RES: 3403886 3696337 3346919 3162996 Rescheduling interrupts CAL: 16277 10323 9302 10017 Function call interrupts TLB: 422395 427894 417297 509851 TLB shootdowns TRM: 0 0 0 0 Thermal event interrupts THR: 0 0 0 0 Threshold APIC interrupts DFR: 0 0 0 0 Deferred Error APIC interrupts MCE: 0 0 0 0 Machine check exceptions MCP: 105 105 105 105 Machine check polls ERR: 20 MIS: 0 PIN: 0 0 0 0 Posted-interrupt notification event PIW: 0 0 0 0 Posted-interrupt wakeup event I don't have any USB devices plugged in to my UnRAID besides the data cable for my UPS which appears to still be working fine as it is reporting stats. I have attached my Diagnostics log. I checked and I have the latest BIOS version from Gigabyte for my motherboard. I have another Unraid server with some different hardware and I haven't seen any of these USB issues with it and it's also on 6.2.4 Edit: Furthermore, I hadn't plugged any USB devices into my server in a few months so I can't say when this started but yesterday and today on 6.2.4 when I try to mount a USB device with unassigned devices I see a number of USB reset errors after I try to mount them through unassigned devices. It shows the spinning mounting animation and then just disappear. I can manually navigate to the /mnt/disks/ folder and see the device but when trying to copy or read files I receive an i/o error. Here is an excerpt from my system log with the USB resets: Nov 11 09:57:37 Node kernel: usb 3-2: new high-speed USB device number 4 using xhci_hcd Nov 11 09:57:38 Node kernel: usb-storage 3-2:1.0: USB Mass Storage device detected Nov 11 09:57:38 Node kernel: scsi host15: usb-storage 3-2:1.0 Nov 11 09:57:39 Node kernel: scsi 15:0:0:0: Direct-Access Wearable AirStash A02 PQ: 0 ANSI: 0 Nov 11 09:57:39 Node kernel: sd 15:0:0:0: Attached scsi generic sg12 type 0 Nov 11 09:57:39 Node kernel: sd 15:0:0:0: [sdm] 62333952 512-byte logical blocks: (31.9 GB/29.7 GiB) Nov 11 09:57:39 Node kernel: sd 15:0:0:0: [sdm] Write Protect is off Nov 11 09:57:39 Node kernel: sd 15:0:0:0: [sdm] Mode Sense: 1b 00 00 00 Nov 11 09:57:39 Node kernel: sd 15:0:0:0: [sdm] No Caching mode page found Nov 11 09:57:39 Node kernel: sd 15:0:0:0: [sdm] Assuming drive cache: write through Nov 11 09:57:39 Node kernel: sdm: sdm1 Nov 11 09:57:39 Node kernel: sd 15:0:0:0: [sdm] Attached SCSI removable disk Nov 11 09:57:55 Node kernel: usb 3-2: reset high-speed USB device number 4 using xhci_hcd Nov 11 09:58:11 Node kernel: usb 3-2: reset high-speed USB device number 4 using xhci_hcd Nov 11 09:58:12 Node emhttp: cmd: /usr/local/emhttp/plugins/dynamix/scripts/tail_log unassigned.devices.log Nov 11 09:58:29 Node mount.exfat: volume was not unmounted cleanly Nov 11 09:58:44 Node kernel: usb 3-2: reset high-speed USB device number 4 using xhci_hcd Nov 11 09:59:02 Node kernel: usb 3-2: reset high-speed USB device number 4 using xhci_hcd Nov 11 09:59:07 Node kernel: usb 3-2: device descriptor read/64, error -110 Nov 11 09:59:18 Node kernel: usb 3-2: USB disconnect, device number 4 Nov 11 09:59:18 Node kernel: sd 15:0:0:0: [sdm] tag#0 UNKNOWN(0x2003) Result: hostbyte=0x01 driverbyte=0x00 Nov 11 09:59:18 Node kernel: sd 15:0:0:0: [sdm] tag#0 CDB: opcode=0x85 85 06 20 00 00 00 00 00 00 00 00 00 00 40 98 00 Nov 11 10:02:04 Node sshd[21977]: Accepted publickey for chris from 162.218.150.130 port 58951 ssh2: RSA SHA256:SYxfyeDR9+KFcVaAl11Xt+D5um7ctM81aeKdqdGqv24 Nov 11 10:02:10 Node su[22036]: Successful su for root by chris Nov 11 10:02:10 Node su[22036]: + /dev/pts/2 chris:root Nov 11 10:03:31 Node mount.exfat: failed to read directory cluster 0x7 Nov 11 10:03:31 Node kernel: Buffer I/O error on dev sdm1, logical block 1320, async page read Nov 11 10:04:12 Node mount.exfat: failed to write super block Nov 11 10:05:14 Node kernel: usb 3-10: new high-speed USB device number 5 using xhci_hcd Nov 11 10:05:14 Node kernel: usb-storage 3-10:1.0: USB Mass Storage device detected Nov 11 10:05:14 Node kernel: scsi host16: usb-storage 3-10:1.0 Nov 11 10:05:15 Node kernel: scsi 16:0:0:0: Direct-Access Wearable AirStash A02 PQ: 0 ANSI: 0 Nov 11 10:05:15 Node kernel: sd 16:0:0:0: Attached scsi generic sg12 type 0 Nov 11 10:05:15 Node kernel: sd 16:0:0:0: [sdm] 62333952 512-byte logical blocks: (31.9 GB/29.7 GiB) Nov 11 10:05:15 Node kernel: sd 16:0:0:0: [sdm] Write Protect is off Nov 11 10:05:15 Node kernel: sd 16:0:0:0: [sdm] Mode Sense: 1b 00 00 00 Nov 11 10:05:15 Node kernel: sd 16:0:0:0: [sdm] No Caching mode page found Nov 11 10:05:15 Node kernel: sd 16:0:0:0: [sdm] Assuming drive cache: write through Nov 11 10:05:15 Node kernel: sdm: sdm1 Nov 11 10:05:15 Node kernel: sd 16:0:0:0: [sdm] Attached SCSI removable disk Nov 11 10:05:31 Node kernel: usb 3-10: reset high-speed USB device number 5 using xhci_hcd Nov 11 10:05:47 Node kernel: usb 3-10: reset high-speed USB device number 5 using xhci_hcd Nov 11 10:10:41 Node kernel: usb 3-10: reset high-speed USB device number 5 using xhci_hcd Nov 11 10:10:57 Node kernel: usb 3-10: reset high-speed USB device number 5 using xhci_hcd Nov 11 10:14:26 Node kernel: usb 3-10: USB disconnect, device number 5 Nov 11 10:16:02 Node kernel: usb 4-1: new SuperSpeed USB device number 2 using xhci_hcd Nov 11 10:16:02 Node kernel: usb-storage 4-1:1.0: USB Mass Storage device detected Nov 11 10:16:02 Node kernel: scsi host17: usb-storage 4-1:1.0 Nov 11 10:16:03 Node kernel: scsi 17:0:0:0: Direct-Access Monster MONSTER DIGITAL PMAP PQ: 0 ANSI: 6 Nov 11 10:16:03 Node kernel: sd 17:0:0:0: Attached scsi generic sg12 type 0 Nov 11 10:16:05 Node kernel: sd 17:0:0:0: [sdm] 120999936 512-byte logical blocks: (62.0 GB/57.7 GiB) Nov 11 10:16:05 Node kernel: sd 17:0:0:0: [sdm] Write Protect is off Nov 11 10:16:05 Node kernel: sd 17:0:0:0: [sdm] Mode Sense: 23 00 00 00 Nov 11 10:16:05 Node kernel: sd 17:0:0:0: [sdm] No Caching mode page found Nov 11 10:16:05 Node kernel: sd 17:0:0:0: [sdm] Assuming drive cache: write through Nov 11 10:16:05 Node kernel: sdm: sdm1 Nov 11 10:16:05 Node kernel: sd 17:0:0:0: [sdm] Attached SCSI removable disk Nov 11 10:18:13 Node kernel: usb 4-1: USB disconnect, device number 2 Nov 11 10:18:22 Node kernel: usb 4-2: new SuperSpeed USB device number 3 using xhci_hcd Nov 11 10:18:22 Node kernel: usb-storage 4-2:1.0: USB Mass Storage device detected Nov 11 10:18:22 Node kernel: scsi host18: usb-storage 4-2:1.0 Nov 11 10:18:23 Node kernel: scsi 18:0:0:0: Direct-Access TS-RDF5 SD Transcend TS37 PQ: 0 ANSI: 6 Nov 11 10:18:23 Node kernel: sd 18:0:0:0: Attached scsi generic sg12 type 0 Nov 11 10:18:23 Node kernel: sd 18:0:0:0: [sdm] 62333952 512-byte logical blocks: (31.9 GB/29.7 GiB) Nov 11 10:18:23 Node kernel: sd 18:0:0:0: [sdm] Write Protect is off Nov 11 10:18:23 Node kernel: sd 18:0:0:0: [sdm] Mode Sense: 23 00 00 00 Nov 11 10:18:23 Node kernel: sd 18:0:0:0: [sdm] Write cache: disabled, read cache: enabled, doesn't support DPO or FUA Nov 11 10:18:23 Node kernel: sdm: sdm1 Nov 11 10:18:23 Node kernel: sd 18:0:0:0: [sdm] Attached SCSI removable disk Nov 11 10:18:37 Node emhttp: cmd: /usr/local/emhttp/plugins/dynamix/scripts/tail_log syslog Nov 11 10:18:49 Node emhttp: cmd: /usr/local/emhttp/plugins/dynamix/scripts/tail_log unassigned.devices.log Nov 11 10:18:55 Node emhttp: cmd: /usr/local/emhttp/plugins/dynamix/scripts/tail_log syslog I tried the slots on the front of the case and the back of the motherboard and I tried multiple devices. I hooked up an SSD in an orico USB 3 drive enclosure and with an NTFS file system, error. Hooked up a random flash drive formatted in exfat, error. However when I hooked up my monster digital USB 3.0 flash drive that I know i have hooked up to Unraid before I didn't get an error and everything worked fine (this was also exfat formatted). I know the log shows that the drive I attached was not unmounted cleanly but this also happened with the Orico USB 3.0 enclosure with a freshly formatted SSD in it so I don't think the unclean removal is the cause. On an unrelated note did LimeTech change where system logs are saved to on the flash with V6.x? I went to grab logs from the past few weeks and noticed that according to the log/folder time stamps a log hasn't been saved to my flash (/boot/logs) since September 18th and I know I have rebooted quite a few times since september. EDIT2: I also noticed this at the very beginning of my syslog: spurious 8259A interrupt: IRQ7 which appears to have been reported by other users in the 6.2.x announcement threads. Sent with tapatalk node-diagnostics-20161111-1720.zip
-
[Support] Linuxserver.io - Musicbrainz
weirdcrap replied to linuxserver.io's topic in Docker Containers
both Sweet, finally started working this morning. Thanks! -
[Support] Linuxserver.io - Musicbrainz
weirdcrap replied to linuxserver.io's topic in Docker Containers
Just the data folder or both the config and data folders? -
[Support] Linuxserver.io - Musicbrainz
weirdcrap replied to linuxserver.io's topic in Docker Containers
I am having an issue with this docker. It appears that it is failing to initialize the database (see the line marked >>>> <<<<<): [s6-init] making user provided files available at /var/run/s6/etc...exited 0. [s6-init] ensuring user provided files have correct perms...exited 0. [fix-attrs.d] applying ownership & permissions fixes... [fix-attrs.d] postgresql-log-dir: applying... [fix-attrs.d] postgresql-log-dir: exited 0. [fix-attrs.d] done. [cont-init.d] executing container initialization scripts... [cont-init.d] 05-timezone: executing... Current default time zone: 'America/Chicago' Local time is now: Thu Nov 10 15:47:46 CST 2016. Universal Time is now: Thu Nov 10 21:47:46 UTC 2016. [cont-init.d] 05-timezone: exited 0. [cont-init.d] 10_add_user: executing... ------------------------------------- _ _ _ | |___| (_) ___ | / __| | |/ _ \ | \__ \ | | (_) | |_|___/ |_|\___/ |_| Brought to you by linuxserver.io We do accept donations at: https://www.linuxserver.io/donations ------------------------------------- GID/UID ------------------------------------- User uid: 99 User gid: 100 ------------------------------------- [cont-init.d] 10_add_user: exited 0. [cont-init.d] 20-brainzcode: executing... [cont-init.d] 20-brainzcode: exited 0. [cont-init.d] 30-initialise-database: executing... >>>>>>>>>>>> [b][cont-init.d] 30-initialise-database: exited 9.[/b] <<<<<<<<<<<<<<<<< [cont-init.d] 40-config-redis: executing... [cont-init.d] 40-config-redis: exited 0. [cont-init.d] done. [services.d] starting services [services.d] done. [372] 10 Nov 15:47:48.718 # Server started, Redis version 2.8.4 [372] 10 Nov 15:47:48.718 # WARNING overcommit_memory is set to 0! Background save may fail under low memory condition. To fix this issue add 'vm.overcommit_memory = 1' to /etc/sysctl.conf and then reboot or run the command 'sysctl vm.overcommit_memory=1' for this to take effect. The log then just sits there and doesn't move. See attached for my mappings. I triple checked my code for metabrainz and it is correct as well. This is what I see when I try to view the WebUI: 08006 DBI connect('dbname=musicbrainz_db','abc',...) failed: could not connect to server: No such file or directory Is the server running locally and accepting connections on Unix domain socket "/var/run/postgresql/.s.PGSQL.5432"? The db file is indeed missing and the folder/file permissions look correct so I'm not sure why it would not have been created: drwxrwxrwx 1 nobody users 116 Nov 10 15:43 . drwxrwxrwx 1 nobody users 138 Nov 10 15:12 .. -rw-rw-rw- 1 chris users 1675 Aug 5 14:56 PolyphemusAutomationSetup drwxrwxrwx 1 nobody users 0 Sep 13 17:03 calibre drwxrwxrwx 1 nobody users 32 Nov 10 15:58 mbrainzData drwxrwxrwx 1 nobody users 44 Nov 10 15:58 musicbrainz drwxrwxrwx 1 nobody users 48 Sep 17 17:02 plex root@VOID:/mnt/cache/appdata# cd mbrainzData/ root@VOID:/mnt/cache/appdata/mbrainzData# ls -al total 0 drwxrwxrwx 1 nobody users 32 Nov 10 15:58 . drwxrwxrwx 1 nobody users 116 Nov 10 15:43 .. drwxr-xr-x 1 nobody users 0 Nov 10 15:58 dbase drwxr-xr-x 1 nobody users 0 Nov 10 15:58 import drwxr-xr-x 1 nobody users 0 Nov 10 15:58 redis root@VOID:/mnt/cache/appdata/mbrainzData#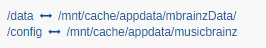
-
[Solved] Errors in syslog after upgrade to v6.2
weirdcrap replied to weirdcrap's topic in General Support
Fair enough, I will give it a reboot and keep an eye on the system log. EDIT: No errors in the log showing up after the reboot, I will let it run for a few days and see if anything pops up. EDIT2: Ok no errors still looks like some one time hiccups from the upgrade. -
[Solved] Errors in syslog after upgrade to v6.2
weirdcrap replied to weirdcrap's topic in General Support
I did have to re-apply my sshfs install in NerdPack to get it working and when I applied that I recall that it went through and re-applied all of my packages including updating python (which is still on v2.7, specifically 2.7.12). I think that Python error was just a one time thing and I haven't seen it since. I am a bit more concerned about those CPU stack traces. -
Hi all, Just upgraded to unRAID v6.2 on Sunday and when I was looking through my system log to resolve what I think is an unrelated issue I noticed some errors coming up. dlandon suggested that the stack traces from my CPU might be related to my CPU over heating. When Plex is transcoding at full bore (97% cpu utilization) my CPU is reporting its temp as 60C which is toasty but not near the thermal threshold of the CPU. I cranked up the fan controller to high and it is still sitting at 60C so I will either need to invest in fans that push more CFMs of air or get an after market CPU cooler if I want to get the temps down further. Specifically I seem to have had Python segfault on me which based on the log time occured a couple hours after upgrading from 6.19 to 6.2: Sep 18 10:41:42 Node kernel: python[17518]: segfault at 2b043cd61ff8 ip 00002b0438283d9b sp 00002b043cd62000 error 6 in libpython2.7.so.1.0[2b0438214000+341000] Sep 18 10:41:44 Node kernel: python[10080]: segfault at 2afc522c9ff8 ip 00002afc4a04fd9b sp 00002afc522ca000 error 6 in libpython2.7.so.1.0[2afc49fe0000+341000] Sep 18 10:41:45 Node kernel: python[10132]: segfault at 2b4ffcbecff8 ip 00002b4ff494f57f sp 00002b4ffcbed000 error 6 in libpython2.7.so.1.0[2b4ff48ed000+341000] Sep 18 10:41:47 Node kernel: python[10207]: segfault at 2ac0a7019ff8 ip 00002ac09ed9fd9b sp 00002ac0a701a000 error 6 in libpython2.7.so.1.0[2ac09ed30000+341000] Sep 18 10:41:48 Node kernel: python[10268]: segfault at 2afc2b390ff8 ip 00002afc2310957f sp 00002afc2b391000 error 6 in libpython2.7.so.1.0[2afc230a7000+341000] Plus some stack traces from my CPU: Sep 19 22:30:42 Node kernel: WARNING: CPU: 0 PID: 27309 at ./arch/x86/include/asm/thread_info.h:236 SyS_rt_sigsuspend+0x8f/0x9e() Sep 19 22:30:42 Node kernel: Modules linked in: xt_nat veth xt_CHECKSUM iptable_mangle ipt_REJECT nf_reject_ipv4 ebtable_filter ebtables vhost_net tun vhost macvtap macvlan ipt_MASQUERADE nf_nat_masquerade_ipv4 iptable_nat nf_conntrack_ipv4 nf_nat_ipv4 iptable_filter ip_tables nf_nat md_mod x86_pkg_temp_thermal coretemp kvm_intel kvm r8169 i2c_i801 i2c_core ahci libahci mii Sep 19 22:30:42 Node kernel: CPU: 0 PID: 27309 Comm: Threadpool work Not tainted 4.4.19-unRAID #1 Sep 19 22:30:42 Node kernel: Hardware name: Gigabyte Technology Co., Ltd. B85M-DS3H-A/B85M-DS3H-A, BIOS F2 08/10/2015 Sep 19 22:30:42 Node kernel: 0000000000000000 ffff8803c77ebee0 ffffffff8136a68e 0000000000000000 Sep 19 22:30:42 Node kernel: 00000000000000ec ffff8803c77ebf18 ffffffff8104a39a ffffffff81055502 Sep 19 22:30:42 Node kernel: fffffffffffffdfe 0000000000014f98 000000000000000d 000000000000a0b7 Sep 19 22:30:42 Node kernel: Call Trace: Sep 19 22:30:42 Node kernel: [] dump_stack+0x61/0x7e Sep 19 22:30:42 Node kernel: [] warn_slowpath_common+0x8f/0xa8 Sep 19 22:30:42 Node kernel: [] ? SyS_rt_sigsuspend+0x8f/0x9e Sep 19 22:30:42 Node kernel: [] warn_slowpath_null+0x15/0x17 Sep 19 22:30:42 Node kernel: [] SyS_rt_sigsuspend+0x8f/0x9e Sep 19 22:30:42 Node kernel: [] entry_SYSCALL_64_fastpath+0x12/0x6d Sep 19 22:30:42 Node kernel: ---[ end trace 753ae045f3fb133e ]--- Sep 19 23:23:13 Node kernel: ------------[ cut here ]------------ Sep 19 23:23:13 Node kernel: WARNING: CPU: 2 PID: 14557 at ./arch/x86/include/asm/thread_info.h:236 SyS_rt_sigsuspend+0x8f/0x9e() Sep 19 23:23:13 Node kernel: Modules linked in: xt_nat veth xt_CHECKSUM iptable_mangle ipt_REJECT nf_reject_ipv4 ebtable_filter ebtables vhost_net tun vhost macvtap macvlan ipt_MASQUERADE nf_nat_masquerade_ipv4 iptable_nat nf_conntrack_ipv4 nf_nat_ipv4 iptable_filter ip_tables nf_nat md_mod x86_pkg_temp_thermal coretemp kvm_intel kvm r8169 i2c_i801 i2c_core ahci libahci mii Sep 19 23:23:13 Node kernel: CPU: 2 PID: 14557 Comm: mono Tainted: G W 4.4.19-unRAID #1 Sep 19 23:23:13 Node kernel: Hardware name: Gigabyte Technology Co., Ltd. B85M-DS3H-A/B85M-DS3H-A, BIOS F2 08/10/2015 Sep 19 23:23:13 Node kernel: 0000000000000000 ffff88075590bee0 ffffffff8136a68e 0000000000000000 Sep 19 23:23:13 Node kernel: 00000000000000ec ffff88075590bf18 ffffffff8104a39a ffffffff81055502 Sep 19 23:23:13 Node kernel: fffffffffffffdfe 0000000000015604 0000000000000002 0000000000000000 Sep 19 23:23:13 Node kernel: Call Trace: Sep 19 23:23:13 Node kernel: [] dump_stack+0x61/0x7e Sep 19 23:23:13 Node kernel: [] warn_slowpath_common+0x8f/0xa8 Sep 19 23:23:13 Node kernel: [] ? SyS_rt_sigsuspend+0x8f/0x9e Sep 19 23:23:13 Node kernel: [] warn_slowpath_null+0x15/0x17 Sep 19 23:23:13 Node kernel: [] SyS_rt_sigsuspend+0x8f/0x9e Sep 19 23:23:13 Node kernel: [] entry_SYSCALL_64_fastpath+0x12/0x6d Sep 19 23:23:13 Node kernel: ---[ end trace 753ae045f3fb133f ]--- Here is my hardware info: I have the following Plugins installed: CA, DenyHosts, Dynamix Schedule, SSD Trim, Dynamix System Statistics, System Temperature, Enhanced Log Viewer, Fix Common Problems, Open Files, Pre Clear Disk, Recycle Bin, Server Layout, SSH, User Scripts, & Unassigned Devices. I have the following Dockers: cadvisor, CouchPotato, Sonarr, Jackett, Headphones, Plex, & NZBGet. node-diagnostics-20160920-0936.zip
-
Ok, so that will print that line to the logger daemon so we can see it in the syslog? I have added the line to the beginning of the unmount script. I will move those system log errors to a separate support thread and see if anyone can shed some light on them. If it is indeed a heat issue I will have to talk to my boss and see if he will let me turn down the A/C in the server room or I will have to order an after market CPU cooler.
-
Sep 19 22:30:42 Node kernel: ------------[ cut here ]------------ Sep 19 22:30:42 Node kernel: WARNING: CPU: 0 PID: 27309 at ./arch/x86/include/asm/thread_info.h:236 SyS_rt_sigsuspend+0x8f/0x9e() Sep 19 22:30:42 Node kernel: Modules linked in: xt_nat veth xt_CHECKSUM iptable_mangle ipt_REJECT nf_reject_ipv4 ebtable_filter ebtables vhost_net tun vhost macvtap macvlan ipt_MASQUERADE nf_nat_masquerade_ipv4 iptable_nat nf_conntrack_ipv4 nf_nat_ipv4 iptable_filter ip_tables nf_nat md_mod x86_pkg_temp_thermal coretemp kvm_intel kvm r8169 i2c_i801 i2c_core ahci libahci mii Sep 19 22:30:42 Node kernel: CPU: 0 PID: 27309 Comm: Threadpool work Not tainted 4.4.19-unRAID #1 Sep 19 22:30:42 Node kernel: Hardware name: Gigabyte Technology Co., Ltd. B85M-DS3H-A/B85M-DS3H-A, BIOS F2 08/10/2015 Sep 19 22:30:42 Node kernel: 0000000000000000 ffff8803c77ebee0 ffffffff8136a68e 0000000000000000 Sep 19 22:30:42 Node kernel: 00000000000000ec ffff8803c77ebf18 ffffffff8104a39a ffffffff81055502 Sep 19 22:30:42 Node kernel: fffffffffffffdfe 0000000000014f98 000000000000000d 000000000000a0b7 Sep 19 22:30:42 Node kernel: Call Trace: Sep 19 22:30:42 Node kernel: [<ffffffff8136a68e>] dump_stack+0x61/0x7e Sep 19 22:30:42 Node kernel: [<ffffffff8104a39a>] warn_slowpath_common+0x8f/0xa8 Sep 19 22:30:42 Node kernel: [<ffffffff81055502>] ? SyS_rt_sigsuspend+0x8f/0x9e Sep 19 22:30:42 Node kernel: [<ffffffff8104a457>] warn_slowpath_null+0x15/0x17 Sep 19 22:30:42 Node kernel: [<ffffffff81055502>] SyS_rt_sigsuspend+0x8f/0x9e Sep 19 22:30:42 Node kernel: [<ffffffff81620a2e>] entry_SYSCALL_64_fastpath+0x12/0x6d Sep 19 22:30:42 Node kernel: ---[ end trace 753ae045f3fb133e ]--- This: x86_pkg_temp_thermal coretemp kvm_intel kvm r8169 i2c_i801 i2c_core ahci libahci mii But I don't know that much about these faults. Reardless, I don't think is is good. I agree I never like seeing those messages but so far I haven't been able to find any information on what exactly that kernel error means.
-
I noticed those in the system log this morning when I was trying to troubleshoot this. They python error took place right around the time I was upgrading from 6.19 to 6.2 and I haven't seen it pop up since (I upgraded 9/18 around 9-10AM) I have never seen the CPU temp spike over 45C and utilization is generally pretty low (less than 10%) unless plex is transcoding heavily. What part of those messages makes you think the CPU is over heating? EDIT: Well apparently when I setup the Dynamix CPU temp plugin I picked the wrong sensor, when plex is really hammering the CPU it gets up to around 58-60C but that is still well below the thermal throttling threshold for the processor. The UnRAID case sits in an air conditioned server room so besides cranking up the fans manually on the fan controller my only other options to address a CPU temp issue would be to buy an aftermarket CPU cooler.
-
The mounts became unavailable sometime in the last 24 hours, sorry I can't be more specific I haven't really checked on it much. The only reason I noticed is my couchpotato was pissed off because it couldn't find the remote share it uses. I have a diagnostic log attached to my OP in this thread.
-
Can't remember off the top of my head if I put the time of execution in the logging for the start / stop scripts (not at home at the moment). But if the scripts logs available through user.scripts shows only a single execution, then its not unRaid. I didn't think to check the script logs, where do I view them? I only see a log icon next to my mount script? Nevermind, found it. I don't even see a log having been generated for the unmount script so I guess the plugin hasn't run the script at all. Like I said before I am just going off what I have experienced previously with the PowerDown plugin and when I disabled the K00 script prior to the v2.23 release I no longer had an issue. I have disabled the schedule for the unmount script in user.scripts for now and I will see if they stay mounted...
-
Thanks, I would tend to agree with you if not for my previous experience with powerdown. Once I disabled the script that had the umount commands to remove the shares they would stay up and never drop until I manually removed them. The weird behavior makes me think there has to be some kind of signal unRAID is issuing that is tricking these plugins into thinking that the array is being stopped or something like that (of course I am just guessing).

