


FreeMan
Members
-
Joined
-
Last visited
-
This is a very low priority issue, but one I've noticed in the last week or so (probably since upgrading to 6.12.9, but I don't recall when I first saw it). The CPU graph on the Dashboard of the GUI always "drips" to zero at the left edge of the graph as the line runs off the edge of the graph. I've captured this GIF to show it: You can see how it "drips" down the left hand edge of the graph. Again, this is a very minor, low-priority issue, but one that is, hopefully, a quick fix. Per the rules, here's the diagnostics file: nas-diagnostics-20240425-1658.zip
-
In order to run an extended SMART test, disk spin down must be disabled. Makes sense since I've tried it in the past (on a 5.x version, maybe?) and could never get the test to run to completion. It would be very handy to have an option for "Temporarily disable spin down for 'X' hours", where 'X' could be in a drop down, or could be a free-form numeric entry with a drop down for [Minutes|Hours|Days]. I could disable spin down for 24 hours to run a SMART test, then rest assured that it will reenable and all my disks will go back to sleep when not needed, eliminating the confusion on why they're always up... Even better would be for the OS to be able to detect that an extended SMART test is running on a disk and simply not spin it down, but I haven't a clue if that's possible or not.
-
That's why my spin down was disabled a couple of weeks back!!! It has to be disabled in order to run an extended test and it's really easy to forget to reenable it. Off I go to submit a suggestion.
-
I got a notification this morning of a reallocated sector count of 16 on a drive. Attached are the SMART stats. nas-smart-20240410-1632.zip Any need to worry yet, or just keep an eye on it for a while?
-
Is there a build now that doesn't have this issue? I've rolled back to the 2.1.1-4-05 tag, so I'm not getting update notifications...
-
I love getting notifications via Pushover and really appreciate that it's supported natively. Sadly, though, the formatting is not ideal. I have the 'Array Status Notification' turned on, and I get every character of every drive serial number sent to my phone. I'm cool with that, but it's unreadable in portrait mode, so I have to rotate the phone. Still, though, no big deal till you get to the bottom of the list and realize that with 15 drives in the array, I don't get info on all 15 of them - notice the Cache drive? Yeah, it's cut off at 'Seagate_FireCuda_12' because the message has hit Pushover's message size limit. If all the drives are active, I get temps on them all and don't see any info on the Cache drive at all. I don't even see the word "Cache". It would be great to get just the last 4 digits of the serial number the linux drive assignment "(sdx)" and "Active 'temp'" or "Standby". It would be spectacular to be able to configure what info I get. Again, VERY appreciative that this is a built in feature, I would just like it even more if it were ever so slightly more useful. Heaven help me if I add another drive! *NOTE: I'm sure the same formatting settings would be usable for all the different notification apps, so I doubt that it would have to be custom just for Pushover.
.thumb.png.0fcaba2aec95968569864377bb67c72e.png)
-
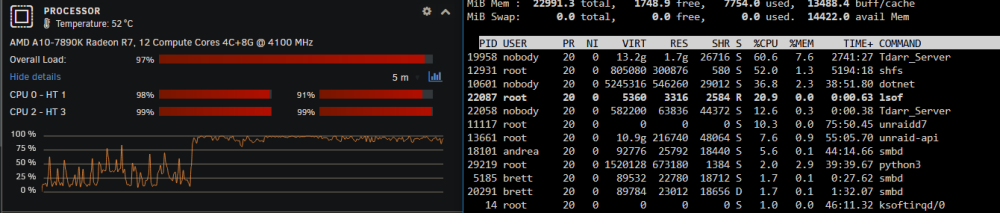
52°C is at the upper end of the range I've ever _noticed_. Doesn't mean it hasn't been hotter, that's just the hottest I've seen...
-
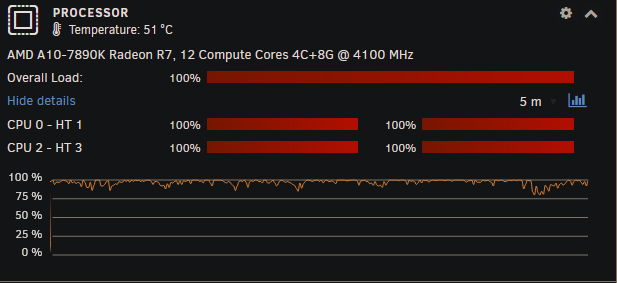
Fair enough, @MAM59. I've had ongoing issues with this over the last couple of years and have never managed to figure out the cause. I don't have the fastest server, MoBo, drives or controllers, so this isn't a totally unreasonable suggestion. If you'll note in the screen shots, though, CPU temp was 51 & 52°C when it was reporting 100% CPU and had dropped to 39°C at 77% total CPU load, so I'd say the CPU was actually busy doing something, not just waiting for I/O. Also, the web interface of several dockers was running slowly, as though the CPU was highly stressed and my requests to the various dockers were in queue waiting for some CPU attention. If you've got any other suggestions on how to determine what's actually going on, I'm more than open to listening.
-
Just spiked again. This time, I know that my Sonarr docker is renaming a lot of files to fix up their naming, but, how do I determine what is actually happening when I haven't just kicked off some sort of process that I know may cause high CPU. during the CPU spike: nas-diagnostics-20240308-1534.zip
-
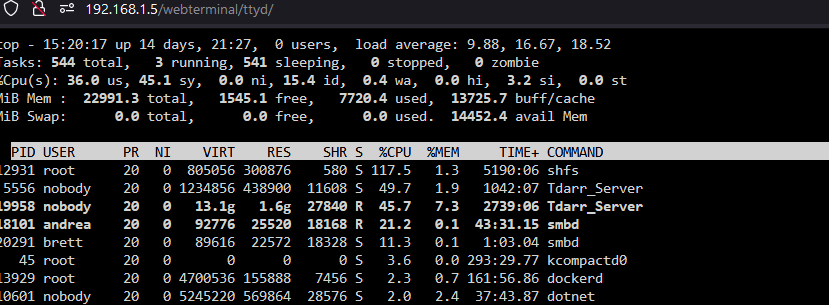
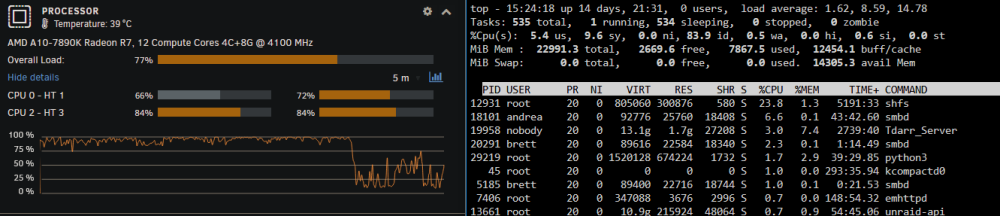
My CPU has been like this for the past couple of hours and it will peak like this every now and then. I have no idea what causes this. I've looked at docker usage and they're usually 1% or less (I currently have 2 dockers running around 15% each, but that still only accounts for 30% total, not the 100% being shown.) This is one of the very few times top has shown my anything running above 10% or so, so this does seem almost reasonable: the tdarr_server I'd expect, since I'm doing a lot of file transcodes (but none are actually transcoding on the UNRAID server itself - all nodes are running on Win machines). How do I determine what the smbd processes are that are at 21% and 11%? Obviously shfs was running very high, how do I determine what was causing that? CPU utilization has just dropped off, but this is the first time all afternoon it's been at a reasonable level: Again, how do I go about figuring out what causes this high CPU? Is there a way to log from top? Is there something else that'll show and log what's using CPU? How do I determine what's causing SHFS and SMBD to use so much CPU? Under the assumption that it's usually helpful: nas-diagnostics-20240308-1526.zip These were taken after CPU utilization dropped back down, though.
-
Interesting. I didn't see anything in the change log that would point to this, but it does, in fact, seem to have solved the issue. I did see that it updated last night (thanks, CA!), but I didn't wait until tonight to let it autoupdate again.
-
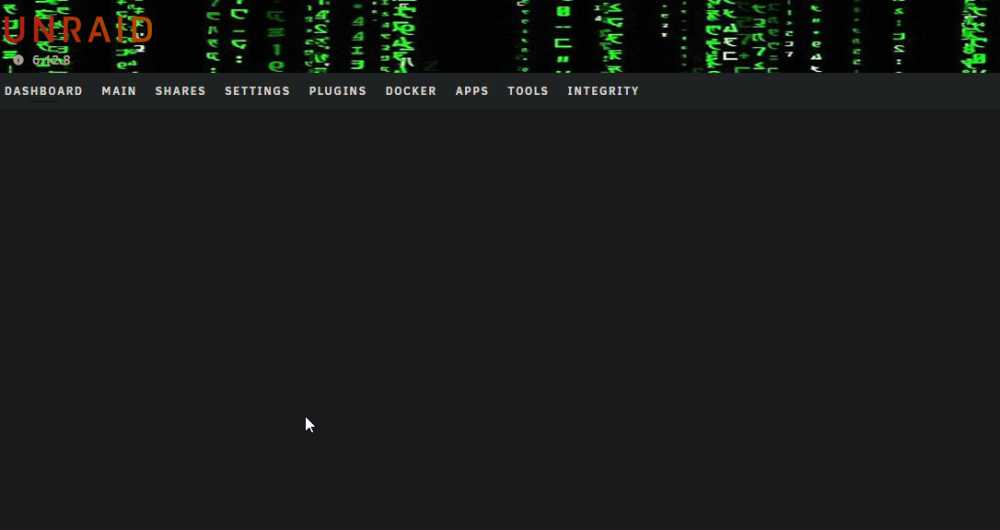
Yesterday, all was good, this evening, the Dashboard will not display. I've tried in my normal FireFox, and also in Brave and Chrome. It spins forever (at least 30 seconds), then displays the header but nothing else. Here's a screenshot from Brave, but all 3 browsers show the same: All the other tabs will display info as expected. In FireFox (my primary browser) I've cleared cache and cookies and did a ctrl-F5 to do a hard refresh and still the same thing. Tips, tricks & suggestions more than welcome! nas-diagnostics-20240306-1738.zip
-
Held the power button til the server turned off, then turned it back on. It's up & running now. Whew!
-
Hrm... I rebooted and the server didn't come back up. Can't get to <ip>/main. Don't even get to the login page. The counter was at 25xx something... Suggestions?
-
Thank you sir! I've made the config change and am rebooting. Can you point me to a basic primer on what the difference is? I don't need all the nitty gritty details, I'm just curious, at a high level, what this really means.


.png.1172191fbd7d53007722dc4924091e86.png)


