


andber
Members
-
Joined
-
Last visited
-
Danke Alturismo fürs helfen und mitdenken! Der Docker ist mir bekannt. Das Backup läuft auf einer dedizierten Ubuntu Maschine, dort ist auch rdiff-backup und rdiff-web installiert. Von dieser Ubuntumaschine aus greife ich die Daten ab den Servern ab. Unraid ist einer dieser Server (mit installiertem rdiff-backup ohne rdiff-web). Zum Beispiel mit dem folgenden Befehl: rdiff-backup --api-version 201 --no-ssh-compression --terminal-verbosity 5 backup [email protected]::/mnt/hdd/smbshare/daten/ /backupdrive/39/daten/ Damit hatte ich keine Probleme mit irgendwelchen Dateirechten .... vermutlich war das so aber gar nicht nötig bzw. nie so gedacht. Lief aber die letzten5 Jahre so perfekt Jetzt bin ich auf dem Backuprechner am umstellen, dass das Backup die Daten über einen Mount abholt. sudo apt install sshfs sudo mkdir /mnt/backup39 sudo sshfs [email protected]:/mnt/hdd/smbshare/daten /mnt/backup39 -o allow_other,default_permissions sudo rdiff-backup --api-version 201 --no-ssh-compression --terminal-verbosity 5 backup /mnt/backup39/ /backupdrive/39/daten/ Ich hoffe das klappt auch so .... und sonst schau ich mir den Docker nochmals an
-
Hallo zusammen Ich habe auf unraid 7.0.0 geupdated und habe eigentlich meine Freude daran. Danke an alle beteiligten. Im gleichen Zug habe ich mir vorgenommen die nerdtools zu eliminieren, in welchem ich noch einige Packete unter anderem Python im Einsatz hatte Für Python habe ich neu das plugin "Python 3 for UNRAID" im Einsatz habe Die Installation rdiff-backup in unraid ist eigentlich keine Hexerei. pip install rdiff-backup Nun kommen bei mir aber die folgende lange Fehlermeldung, mit welcher ich als python und slackware Anfänger nicht viel anfangen kann. root@unraid2:~# pip install rdiff-backup Collecting rdiff-backup Using cached rdiff-backup-2.2.6.tar.gz (944 kB) Installing build dependencies ... done Getting requirements to build wheel ... done Installing backend dependencies ... done Preparing metadata (pyproject.toml) ... done Collecting PyYAML (from rdiff-backup) Using cached PyYAML-6.0.2-cp311-cp311-manylinux_2_17_x86_64.manylinux2014_x86_64.whl.metadata (2.1 kB) Using cached PyYAML-6.0.2-cp311-cp311-manylinux_2_17_x86_64.manylinux2014_x86_64.whl (762 kB) Building wheels for collected packages: rdiff-backup Building wheel for rdiff-backup (pyproject.toml) ... error error: subprocess-exited-with-error × Building wheel for rdiff-backup (pyproject.toml) did not run successfully. │ exit code: 1 ╰─> [110 lines of output] WARNING setuptools_scm.pyproject_reading toml section missing 'pyproject.toml does not contain a tool.setuptools_scm section' Traceback (most recent call last): File "/tmp/pip-build-env-x6c83que/normal/lib/python3.11/site-packages/setuptools_scm/_integration/pyproject_reading.py", line 36, in read_pyproject section = defn.get("tool", {})[tool_name] ~~~~~~~~~~~~~~~~~~~~^^^^^^^^^^^ KeyError: 'setuptools_scm' running bdist_wheel running build running build_py running pre_build_exec running pre_build_templates templating tools/rdiff-backup.spec.template -> build/rdiff-backup.spec creating build templating tools/rdiff-backup.spec.template-fedora -> build/rdiff-backup.fedora.spec creating build/lib.linux-x86_64-cpython-311/rdiff_backup copying src/rdiff_backup/FilenameMapping.py -> build/lib.linux-x86_64-cpython-311/rdiff_backup copying src/rdiff_backup/Globals.py -> build/lib.linux-x86_64-cpython-311/rdiff_backup copying src/rdiff_backup/Hardlink.py -> build/lib.linux-x86_64-cpython-311/rdiff_backup copying src/rdiff_backup/Main.py -> build/lib.linux-x86_64-cpython-311/rdiff_backup copying src/rdiff_backup/Rdiff.py -> build/lib.linux-x86_64-cpython-311/rdiff_backup copying src/rdiff_backup/Security.py -> build/lib.linux-x86_64-cpython-311/rdiff_backup copying src/rdiff_backup/SetConnections.py -> build/lib.linux-x86_64-cpython-311/rdiff_backup copying src/rdiff_backup/Time.py -> build/lib.linux-x86_64-cpython-311/rdiff_backup copying src/rdiff_backup/__init__.py -> build/lib.linux-x86_64-cpython-311/rdiff_backup copying src/rdiff_backup/backup.py -> build/lib.linux-x86_64-cpython-311/rdiff_backup copying src/rdiff_backup/compare.py -> build/lib.linux-x86_64-cpython-311/rdiff_backup copying src/rdiff_backup/connection.py -> build/lib.linux-x86_64-cpython-311/rdiff_backup copying src/rdiff_backup/eas_acls.py -> build/lib.linux-x86_64-cpython-311/rdiff_backup copying src/rdiff_backup/fs_abilities.py -> build/lib.linux-x86_64-cpython-311/rdiff_backup copying src/rdiff_backup/hash.py -> build/lib.linux-x86_64-cpython-311/rdiff_backup copying src/rdiff_backup/increment.py -> build/lib.linux-x86_64-cpython-311/rdiff_backup copying src/rdiff_backup/iterfile.py -> build/lib.linux-x86_64-cpython-311/rdiff_backup copying src/rdiff_backup/librsync.py -> build/lib.linux-x86_64-cpython-311/rdiff_backup copying src/rdiff_backup/log.py -> build/lib.linux-x86_64-cpython-311/rdiff_backup copying src/rdiff_backup/longname.py -> build/lib.linux-x86_64-cpython-311/rdiff_backup copying src/rdiff_backup/manage.py -> build/lib.linux-x86_64-cpython-311/rdiff_backup copying src/rdiff_backup/regress.py -> build/lib.linux-x86_64-cpython-311/rdiff_backup copying src/rdiff_backup/restore.py -> build/lib.linux-x86_64-cpython-311/rdiff_backup copying src/rdiff_backup/robust.py -> build/lib.linux-x86_64-cpython-311/rdiff_backup copying src/rdiff_backup/rorpiter.py -> build/lib.linux-x86_64-cpython-311/rdiff_backup copying src/rdiff_backup/rpath.py -> build/lib.linux-x86_64-cpython-311/rdiff_backup copying src/rdiff_backup/run_delete.py -> build/lib.linux-x86_64-cpython-311/rdiff_backup copying src/rdiff_backup/run_stats.py -> build/lib.linux-x86_64-cpython-311/rdiff_backup copying src/rdiff_backup/selection.py -> build/lib.linux-x86_64-cpython-311/rdiff_backup copying src/rdiff_backup/statistics.py -> build/lib.linux-x86_64-cpython-311/rdiff_backup copying src/rdiff_backup/user_group.py -> build/lib.linux-x86_64-cpython-311/rdiff_backup copying src/rdiff_backup/win_acls.py -> build/lib.linux-x86_64-cpython-311/rdiff_backup creating build/lib.linux-x86_64-cpython-311/rdiffbackup copying src/rdiffbackup/__init__.py -> build/lib.linux-x86_64-cpython-311/rdiffbackup copying src/rdiffbackup/actions_mgr.py -> build/lib.linux-x86_64-cpython-311/rdiffbackup copying src/rdiffbackup/arguments.py -> build/lib.linux-x86_64-cpython-311/rdiffbackup copying src/rdiffbackup/meta_mgr.py -> build/lib.linux-x86_64-cpython-311/rdiffbackup copying src/rdiffbackup/run.py -> build/lib.linux-x86_64-cpython-311/rdiffbackup creating build/lib.linux-x86_64-cpython-311/rdiffbackup/actions copying src/rdiffbackup/actions/__init__.py -> build/lib.linux-x86_64-cpython-311/rdiffbackup/actions copying src/rdiffbackup/actions/backup.py -> build/lib.linux-x86_64-cpython-311/rdiffbackup/actions copying src/rdiffbackup/actions/calculate.py -> build/lib.linux-x86_64-cpython-311/rdiffbackup/actions copying src/rdiffbackup/actions/compare.py -> build/lib.linux-x86_64-cpython-311/rdiffbackup/actions copying src/rdiffbackup/actions/complete.py -> build/lib.linux-x86_64-cpython-311/rdiffbackup/actions copying src/rdiffbackup/actions/info.py -> build/lib.linux-x86_64-cpython-311/rdiffbackup/actions copying src/rdiffbackup/actions/list_.py -> build/lib.linux-x86_64-cpython-311/rdiffbackup/actions copying src/rdiffbackup/actions/regress.py -> build/lib.linux-x86_64-cpython-311/rdiffbackup/actions copying src/rdiffbackup/actions/remove.py -> build/lib.linux-x86_64-cpython-311/rdiffbackup/actions copying src/rdiffbackup/actions/restore.py -> build/lib.linux-x86_64-cpython-311/rdiffbackup/actions copying src/rdiffbackup/actions/server.py -> build/lib.linux-x86_64-cpython-311/rdiffbackup/actions copying src/rdiffbackup/actions/test.py -> build/lib.linux-x86_64-cpython-311/rdiffbackup/actions copying src/rdiffbackup/actions/verify.py -> build/lib.linux-x86_64-cpython-311/rdiffbackup/actions creating build/lib.linux-x86_64-cpython-311/rdiffbackup/utils copying src/rdiffbackup/utils/__init__.py -> build/lib.linux-x86_64-cpython-311/rdiffbackup/utils copying src/rdiffbackup/utils/argopts.py -> build/lib.linux-x86_64-cpython-311/rdiffbackup/utils copying src/rdiffbackup/utils/locking.py -> build/lib.linux-x86_64-cpython-311/rdiffbackup/utils copying src/rdiffbackup/utils/plugins.py -> build/lib.linux-x86_64-cpython-311/rdiffbackup/utils copying src/rdiffbackup/utils/quoting.py -> build/lib.linux-x86_64-cpython-311/rdiffbackup/utils copying src/rdiffbackup/utils/safestr.py -> build/lib.linux-x86_64-cpython-311/rdiffbackup/utils copying src/rdiffbackup/utils/simpleps.py -> build/lib.linux-x86_64-cpython-311/rdiffbackup/utils copying src/rdiffbackup/utils/usrgrp.py -> build/lib.linux-x86_64-cpython-311/rdiffbackup/utils creating build/lib.linux-x86_64-cpython-311/rdiffbackup/meta copying src/rdiffbackup/meta/__init__.py -> build/lib.linux-x86_64-cpython-311/rdiffbackup/meta copying src/rdiffbackup/meta/acl_posix.py -> build/lib.linux-x86_64-cpython-311/rdiffbackup/meta copying src/rdiffbackup/meta/acl_win.py -> build/lib.linux-x86_64-cpython-311/rdiffbackup/meta copying src/rdiffbackup/meta/ea.py -> build/lib.linux-x86_64-cpython-311/rdiffbackup/meta copying src/rdiffbackup/meta/stdattr.py -> build/lib.linux-x86_64-cpython-311/rdiffbackup/meta creating build/lib.linux-x86_64-cpython-311/rdiffbackup/locations copying src/rdiffbackup/locations/__init__.py -> build/lib.linux-x86_64-cpython-311/rdiffbackup/locations copying src/rdiffbackup/locations/_dir_shadow.py -> build/lib.linux-x86_64-cpython-311/rdiffbackup/locations copying src/rdiffbackup/locations/_repo_shadow.py -> build/lib.linux-x86_64-cpython-311/rdiffbackup/locations copying src/rdiffbackup/locations/directory.py -> build/lib.linux-x86_64-cpython-311/rdiffbackup/locations copying src/rdiffbackup/locations/fs_abilities.py -> build/lib.linux-x86_64-cpython-311/rdiffbackup/locations copying src/rdiffbackup/locations/repository.py -> build/lib.linux-x86_64-cpython-311/rdiffbackup/locations creating build/lib.linux-x86_64-cpython-311/rdiffbackup/locations/map copying src/rdiffbackup/locations/map/__init__.py -> build/lib.linux-x86_64-cpython-311/rdiffbackup/locations/map copying src/rdiffbackup/locations/map/filenames.py -> build/lib.linux-x86_64-cpython-311/rdiffbackup/locations/map copying src/rdiffbackup/locations/map/hardlinks.py -> build/lib.linux-x86_64-cpython-311/rdiffbackup/locations/map copying src/rdiffbackup/locations/map/longnames.py -> build/lib.linux-x86_64-cpython-311/rdiffbackup/locations/map copying src/rdiffbackup/locations/map/owners.py -> build/lib.linux-x86_64-cpython-311/rdiffbackup/locations/map running egg_info writing src/rdiff_backup.egg-info/PKG-INFO writing dependency_links to src/rdiff_backup.egg-info/dependency_links.txt writing entry points to src/rdiff_backup.egg-info/entry_points.txt writing requirements to src/rdiff_backup.egg-info/requires.txt writing top-level names to src/rdiff_backup.egg-info/top_level.txt ERROR setuptools_scm._file_finders.git listing git files failed - pretending there aren't any reading manifest file 'src/rdiff_backup.egg-info/SOURCES.txt' adding license file 'COPYING' writing manifest file 'src/rdiff_backup.egg-info/SOURCES.txt' running build_ext building 'rdiff_backup.C' extension creating build/temp.linux-x86_64-cpython-311/src gcc -Wsign-compare -DNDEBUG -g -fwrapv -O3 -Wall -fPIC -I/usr/include/python3.11 -c src/cmodule.c -o build/temp.linux-x86_64-cpython-311/src/cmodule.o error: command 'gcc' failed: No such file or directory [end of output] note: This error originates from a subprocess, and is likely not a problem with pip. ERROR: Failed building wheel for rdiff-backup Failed to build rdiff-backup ERROR: ERROR: Failed to build installable wheels for some pyproject.toml based projects (rdiff-backup) Kann mir hier jemand weiter helfen? In die richtig Richtung stossen? Eigentlich würde ich gerne an rdiff-backup festhalten. Zusammen mit rdiff-web ist das eine wirklich einfache und vorallem übersichtliche Lösung! Gruss und Dank Andi
-
Thank you @ich777 for the always clear and insightful information! I totally agree with you @kkdev, i think its the time to switch to a hardware firewall .... would simplify a few things.
-
Thanks kkdev! I was looking at nvidia before the E810. Unfortunately I have a small server rack in my homelab and only one slot in my unraidserver (X10SDV-8C-TLN4F) so I went for the e810-xxvda4 with 4 25GB SFP28 slots. I couldn't find a 4port card at Mellanox. I give 2 slots directly (PCI IOMMU group) to a virtual pfsense and the other 2 slots (only 1 at the moment) would be used by unraid .... well, you can't have everything ... @ich777 What do you mean as a driverplugin master? -> is there any way to influence the 7.0 release to get higher-performance E810 drivers on board?
-
Perhaps a little more clarification for me. Story: We have a provider that offers a subscription of 25GB instead of 10GB at almost no extra charge (theoretically). I couldn't resist -> https://www.init7.net/en/internet/fiber7/ That's why I would like to put the E810 into operation. I have a pfsense with Intel E810 (ice driver) in operation as a router firewall, where harwareoffloading works wonderfully! Question: If it is foreseeable that kernel 6.6.xx will also be used in the final version of unraid7, is it a given that the Intel E810 will not perform as desired? Or what about the next kernel (6.12.xx?)? -> If the future is really so unclear. Wouldn't it be possible/useful to create a driver plugin so that the Intel E810 can be supported? I am probably overlooking various things. Thanks for your help and regards Andi
-
Thanks kkdev for the clarification: Now it is clear that I will wait 😁-> I should be extremely bored over Christmas. When will there be a new kernel with unraid? 🫠
-
Hello everyone I am also planning to install an intel E810-DA4 in my unraid server (6.12.14) over Christmas. Should I leave it alone, update to 7.0.0-rc1 or are there any instructions/help on how to compile and install the ‘new’ driver? What I can't use is 100% utilisation with network traffic. I'm more at home on the Windows or Ubuntu side ... Slackware is just in ‘use’ so far. Thanks for any help!!!
-
Das würde mich auch interessieren! Neben Überspannungen, Fehlerhafter Hardware, unsachgemässem Einsatz .... welches ich eigentlich alles ausschliessen kann, habe ich eine Vermutung, welche ich als Hauptursache teile, hier gefunden -> https://www.techpowerup.com/forums/threads/samsung-870-evo-beware-certain-batches-prone-to-failure.291504/ -> Fehlerhafte Serien bei Samsung! Meine waren auch so alt und hatten 5 Jahre Garantie. Was ich mir auch überlegt habe, ist dass ich 2 über den SATA Controller des Mainboards betrieben habe und 4 über einen Supermicro AOC-S2308L-L8i im IT Mode ... da bin ich mir nicht sicher wie klug das war .... trim etc .... kenne mich da nicht so aus. Das anno dazumal schon alle Schäden hatten, spricht eigentlich dafür das es nicht so drauf ankommt wo ich sie betrieben habe. Danach habe ich sie lange an einem Mainboard mit 6 SATA Ausgängen betrieben und die Schäden gingen munter weiter .... bin mal gespannt wie sich die neuen so verhalten ...
-
Einfach der Vollständigkeit halber hier noch der Ausgang der Geschichte: Alle 6 SSD's mit obig beschrieben Fehlern wurden durch den Wiederverkäufer ohne Gegenfrage ersetzt. Ich habe dem Garantiefall neben den SSD's auch noch die Statistiken von Smartctl beigelegt und gut beschrieben, was der defekt ist. Wie oben im Thread. Dauer des ganzen Austausches und Garantiebeurteilung (von versenden der defekten SSD's, bis zum erhalt der Neuware) 3 Wochen. Danke für alle Hilfe! Andi
-
Hello everyone OK firstly I have to say that this only happened on the second server. The first server runs without problems with Beta3. What did I want to do Update Beta2 to Beta3. After initialising the update, the script stops at the point already specified in the title -> extracting: /boot/unRAIDServer/syslinux/syslinux.cfg. This looks like this: I see the following in the log: Even after 30 minutes of waiting, nothing happens: The server is still running in the background and I can access the Gui without any problems. There it simply tells me that the update is still running. What can I do? I see the following in the log: Thanks for your help. Andi
-
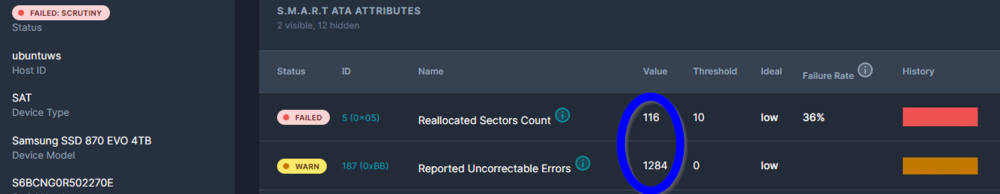
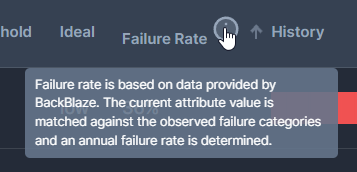
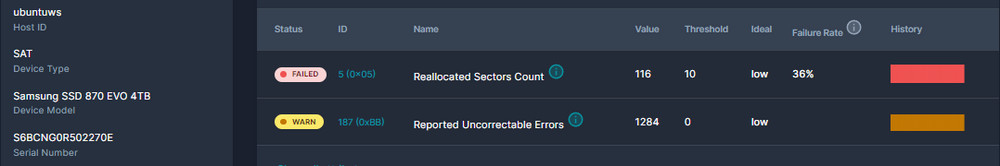
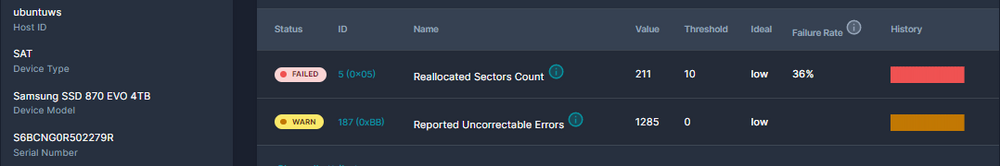
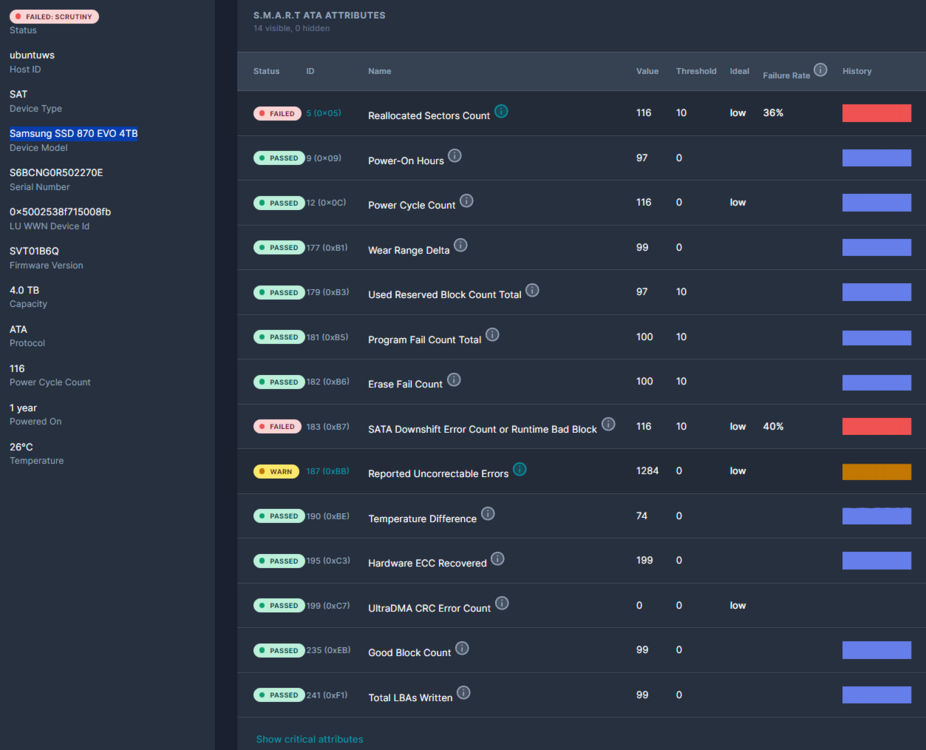
@BengonJa alle 6 SSD in dem Array haben Fehler aber schon unterschidliche Anzahlen ... im ersten Screenshot sind einfach "alle" Smartwerte eingeblendet in den unteren nur noch die kritischen. Du meinst wahrscheinlich den Failure Rate von 36% -> -> ich lese daraus vereinfacht geasgt -> NICHT GUT .....
-
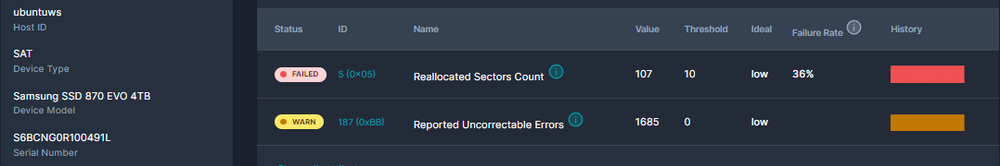
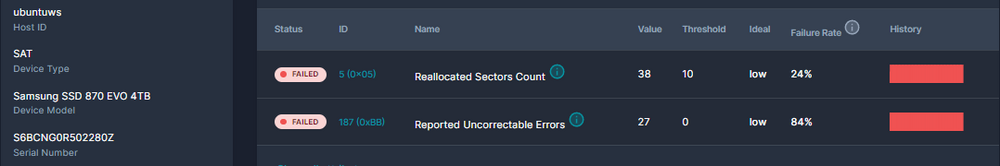
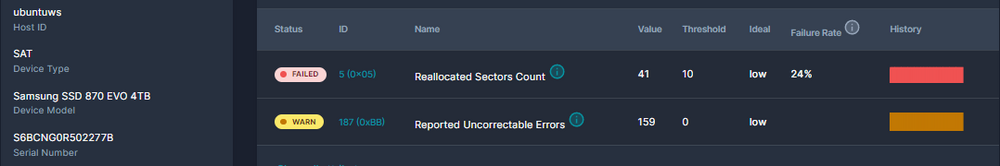
Danke für die Hilfe!! Ich habe mich an den Wiederverkäufer in der Schweiz gewendet. Der kann (evt. will) mir auch nicht sagen, ob ich Grantieanspruch habe. Ich muss alles zusammen einsenden und wie ihr bereits gesagt habt beschreiben. Auf der einen Seite möchte ich dass, aber der Aufwand ist nicht zu unterschätzen. Könnt ihr mir sagen (evt. auch einfach abschätzen), ob so viele Fehler bei "Number of Reported Uncorrectable Errors" und "Reallocated Sectors Count", etc. überhaupbt Anspruch auf Garantie gibt? Mir machen die Werte einfach "Angst", die SSD's innerhalb "kurzer" Zeit (natürlich eine Woche nach Garantieablauf) zu verlieren. Ist diese Angst mit obigen Werten begründet? Oder mach ich mir zuviele Sorgen? Auf etwa 10 anderen ( NVME und SSD Devices von Samsung habe ich NULL Smart Errors ... Gruss nochmals Dankund bis bald wieder Andi P.S. Hier nochmals die Festplatten des Arrays aus Scrutiny: sda sdb sdc sdd sde sdg


-
Hallo zusammen Ich betreibe seit ca. 3 Jahren eine raidz1-0 ZFS SSD Pool mit 6 x Samsung SSD 870 EVO 4TB Seit Beginn läuft er eigentlich nicht rund .... immer wieder habe ich Fehlermeldungen beim SCRUB. Konnte ihn aber einigermassen am Leben erhalten. Andere Pools, mit NVME drives und normalen Festplatten haben keine Probleme. Ich habe mir nun scrutiny installiert um die SMART Statuse zu überwachen und siehe da, da stimmt was gewaltig nicht. Der Befehl sudo smartctl -a /dev/sda gibt folgendes aus smartctl 7.4 2023-08-01 r5530 [x86_64-linux-6.8.0-41-generic] (local build) Copyright (C) 2002-23, Bruce Allen, Christian Franke, www.smartmontools.org === START OF INFORMATION SECTION === Model Family: Samsung based SSDs Device Model: Samsung SSD 870 EVO 4TB Serial Number: S6BCNG0R502270E LU WWN Device Id: 5 002538 f715008fb Firmware Version: SVT01B6Q User Capacity: 4,000,787,030,016 bytes [4.00 TB] Sector Size: 512 bytes logical/physical Rotation Rate: Solid State Device Form Factor: 2.5 inches TRIM Command: Available, deterministic, zeroed Device is: In smartctl database 7.3/5528 ATA Version is: ACS-4 T13/BSR INCITS 529 revision 5 SATA Version is: SATA 3.3, 6.0 Gb/s (current: 6.0 Gb/s) Local Time is: Mon Sep 23 21:02:19 2024 CEST SMART support is: Available - device has SMART capability. SMART support is: Enabled AAM feature is: Unavailable APM feature is: Unavailable Rd look-ahead is: Enabled Write cache is: Enabled DSN feature is: Unavailable ATA Security is: Disabled, frozen [SEC2] Wt Cache Reorder: Enabled === START OF READ SMART DATA SECTION === SMART overall-health self-assessment test result: PASSED General SMART Values: Offline data collection status: (0x80) Offline data collection activity was never started. Auto Offline Data Collection: Enabled. Self-test execution status: ( 0) The previous self-test routine completed without error or no self-test has ever been run. Total time to complete Offline data collection: ( 0) seconds. Offline data collection capabilities: (0x53) SMART execute Offline immediate. Auto Offline data collection on/off support. Suspend Offline collection upon new command. No Offline surface scan supported. Self-test supported. No Conveyance Self-test supported. Selective Self-test supported. SMART capabilities: (0x0003) Saves SMART data before entering power-saving mode. Supports SMART auto save timer. Error logging capability: (0x01) Error logging supported. General Purpose Logging supported. Short self-test routine recommended polling time: ( 2) minutes. Extended self-test routine recommended polling time: ( 320) minutes. SCT capabilities: (0x003d) SCT Status supported. SCT Error Recovery Control supported. SCT Feature Control supported. SCT Data Table supported. SMART Attributes Data Structure revision number: 1 Vendor Specific SMART Attributes with Thresholds: ID# ATTRIBUTE_NAME FLAGS VALUE WORST THRESH FAIL RAW_VALUE 5 Reallocated_Sector_Ct PO--CK 097 097 010 - 116 9 Power_On_Hours -O--CK 097 097 000 - 10960 12 Power_Cycle_Count -O--CK 099 099 000 - 116 177 Wear_Leveling_Count PO--C- 099 099 000 - 24 179 Used_Rsvd_Blk_Cnt_Tot PO--C- 097 097 010 - 116 181 Program_Fail_Cnt_Total -O--CK 100 100 010 - 0 182 Erase_Fail_Count_Total -O--CK 100 100 010 - 0 183 Runtime_Bad_Block PO--C- 097 097 010 - 116 187 Uncorrectable_Error_Cnt -O--CK 099 099 000 - 1284 190 Airflow_Temperature_Cel -O--CK 071 050 000 - 29 195 ECC_Error_Rate -O-RC- 199 199 000 - 1284 199 CRC_Error_Count -OSRCK 100 100 000 - 0 235 POR_Recovery_Count -O--C- 099 099 000 - 32 241 Total_LBAs_Written -O--CK 099 099 000 - 77827970952 ||||||_ K auto-keep |||||__ C event count ||||___ R error rate |||____ S speed/performance ||_____ O updated online |______ P prefailure warning General Purpose Log Directory Version 1 SMART Log Directory Version 1 [multi-sector log support] Address Access R/W Size Description 0x00 GPL,SL R/O 1 Log Directory 0x01 SL R/O 1 Summary SMART error log 0x02 SL R/O 1 Comprehensive SMART error log 0x03 GPL R/O 1 Ext. Comprehensive SMART error log 0x04 GPL,SL R/O 8 Device Statistics log 0x06 SL R/O 1 SMART self-test log 0x07 GPL R/O 1 Extended self-test log 0x09 SL R/W 1 Selective self-test log 0x10 GPL R/O 1 NCQ Command Error log 0x11 GPL R/O 1 SATA Phy Event Counters log 0x13 GPL R/O 1 SATA NCQ Send and Receive log 0x30 GPL,SL R/O 9 IDENTIFY DEVICE data log 0x80-0x9f GPL,SL R/W 16 Host vendor specific log 0xa1 SL VS 16 Device vendor specific log 0xa5 SL VS 16 Device vendor specific log 0xce SL VS 16 Device vendor specific log 0xe0 GPL,SL R/W 1 SCT Command/Status 0xe1 GPL,SL R/W 1 SCT Data Transfer SMART Extended Comprehensive Error Log Version: 1 (1 sectors) Device Error Count: 1284 (device log contains only the most recent 4 errors) CR = Command Register FEATR = Features Register COUNT = Count (was: Sector Count) Register LBA_48 = Upper bytes of LBA High/Mid/Low Registers ] ATA-8 LH = LBA High (was: Cylinder High) Register ] LBA LM = LBA Mid (was: Cylinder Low) Register ] Register LL = LBA Low (was: Sector Number) Register ] DV = Device (was: Device/Head) Register DC = Device Control Register ER = Error register ST = Status register Powered_Up_Time is measured from power on, and printed as DDd+hh:mm:SS.sss where DD=days, hh=hours, mm=minutes, SS=sec, and sss=millisec. It "wraps" after 49.710 days. Error 1284 [3] occurred at disk power-on lifetime: 10581 hours (440 days + 21 hours) When the command that caused the error occurred, the device was active or idle. After command completion occurred, registers were: ER -- ST COUNT LBA_48 LH LM LL DV DC -- -- -- == -- == == == -- -- -- -- -- 40 -- 51 00 70 00 00 75 ef 1f f4 40 00 Error: UNC at LBA = 0x75ef1ff4 = 1978605556 Commands leading to the command that caused the error were: CR FEATR COUNT LBA_48 LH LM LL DV DC Powered_Up_Time Command/Feature_Name -- == -- == -- == == == -- -- -- -- -- --------------- -------------------- 60 00 f0 00 70 00 00 75 ef 1f f4 40 0e 7d+15:17:32.728 READ FPDMA QUEUED 60 00 d6 00 38 00 00 75 ef 1f 1e 40 07 7d+15:17:32.728 READ FPDMA QUEUED 60 00 d6 00 90 00 00 75 ef 1e 48 40 12 7d+15:17:32.728 READ FPDMA QUEUED 60 00 d6 00 60 00 00 75 ef 1d 72 40 0c 7d+15:17:32.728 READ FPDMA QUEUED 60 00 d6 00 88 00 00 75 ef 1c 9b 40 11 7d+15:17:32.728 READ FPDMA QUEUED Error 1283 [2] occurred at disk power-on lifetime: 10516 hours (438 days + 4 hours) When the command that caused the error occurred, the device was active or idle. After command completion occurred, registers were: ER -- ST COUNT LBA_48 LH LM LL DV DC -- -- -- == -- == == == -- -- -- -- -- 40 -- 51 00 a8 00 00 75 ef 1f f4 40 00 Error: UNC at LBA = 0x75ef1ff4 = 1978605556 Commands leading to the command that caused the error were: CR FEATR COUNT LBA_48 LH LM LL DV DC Powered_Up_Time Command/Feature_Name -- == -- == -- == == == -- -- -- -- -- --------------- -------------------- 60 00 f0 00 a8 00 00 75 ef 1f f4 40 15 4d+22:05:53.196 READ FPDMA QUEUED 60 00 d6 00 38 00 00 75 ef 1f 1e 40 07 4d+22:05:53.196 READ FPDMA QUEUED 60 00 d6 00 e0 00 00 75 ef 1e 48 40 1c 4d+22:05:53.196 READ FPDMA QUEUED 60 00 d6 00 30 00 00 75 ef 1d 72 40 06 4d+22:05:53.196 READ FPDMA QUEUED 60 00 d6 00 d8 00 00 75 ef 1b c5 40 1b 4d+22:05:53.196 READ FPDMA QUEUED Error 1282 [1] occurred at disk power-on lifetime: 10505 hours (437 days + 17 hours) When the command that caused the error occurred, the device was active or idle. After command completion occurred, registers were: ER -- ST COUNT LBA_48 LH LM LL DV DC -- -- -- == -- == == == -- -- -- -- -- 40 -- 51 00 90 00 00 75 ef 20 e4 40 00 Error: UNC at LBA = 0x75ef20e4 = 1978605796 Commands leading to the command that caused the error were: CR FEATR COUNT LBA_48 LH LM LL DV DC Powered_Up_Time Command/Feature_Name -- == -- == -- == == == -- -- -- -- -- --------------- -------------------- 60 00 d6 00 90 00 00 75 ef 20 e4 40 12 4d+11:42:36.429 READ FPDMA QUEUED 60 00 f0 00 f0 00 00 75 ef 1f f4 40 1e 4d+11:42:36.429 READ FPDMA QUEUED 60 00 d6 00 00 00 00 75 ef 1f 1e 40 00 4d+11:42:36.429 READ FPDMA QUEUED 60 00 d6 00 70 00 00 75 ef 1e 48 40 0e 4d+11:42:36.429 READ FPDMA QUEUED 60 00 d6 00 b8 00 00 75 ef 1c 9b 40 17 4d+11:42:36.429 READ FPDMA QUEUED Error 1281 [0] occurred at disk power-on lifetime: 10338 hours (430 days + 18 hours) When the command that caused the error occurred, the device was active or idle. After command completion occurred, registers were: ER -- ST COUNT LBA_48 LH LM LL DV DC -- -- -- == -- == == == -- -- -- -- -- 40 -- 51 00 18 00 01 38 b0 4c 82 40 00 Error: UNC at LBA = 0x138b04c82 = 5246045314 Commands leading to the command that caused the error were: CR FEATR COUNT LBA_48 LH LM LL DV DC Powered_Up_Time Command/Feature_Name -- == -- == -- == == == -- -- -- -- -- --------------- -------------------- 60 00 33 00 18 00 00 38 b0 4c 82 40 03 16:47:07.954 READ FPDMA QUEUED 60 00 34 00 10 00 00 38 b0 4c 4e 40 02 16:47:07.954 READ FPDMA QUEUED 60 00 33 00 08 00 00 38 b0 4c 1b 40 01 16:47:07.954 READ FPDMA QUEUED 60 00 33 00 00 00 00 38 b0 4b e8 40 00 16:47:07.954 READ FPDMA QUEUED 60 00 33 00 98 00 00 38 b0 4b 81 40 13 16:47:07.954 READ FPDMA QUEUED SMART Extended Self-test Log Version: 1 (1 sectors) Num Test_Description Status Remaining LifeTime(hours) LBA_of_first_error # 1 Short offline Completed without error 00% 10429 - # 2 Extended offline Aborted by host 90% 4911 - SMART Selective self-test log data structure revision number 1 SPAN MIN_LBA MAX_LBA CURRENT_TEST_STATUS 1 0 0 Not_testing 2 0 0 Not_testing 3 0 0 Not_testing 4 0 0 Not_testing 5 0 0 Not_testing 256 0 65535 Read_scanning was never started Selective self-test flags (0x0): After scanning selected spans, do NOT read-scan remainder of disk. If Selective self-test is pending on power-up, resume after 0 minute delay. SCT Status Version: 3 SCT Version (vendor specific): 256 (0x0100) Device State: Active (0) Current Temperature: 29 Celsius Power Cycle Min/Max Temperature: 23/46 Celsius Lifetime Min/Max Temperature: 21/50 Celsius Specified Max Operating Temperature: 70 Celsius Under/Over Temperature Limit Count: 0/0 SMART Status: 0xc24f (PASSED) SCT Temperature History Version: 2 Temperature Sampling Period: 10 minutes Temperature Logging Interval: 10 minutes Min/Max recommended Temperature: 0/70 Celsius Min/Max Temperature Limit: 0/70 Celsius Temperature History Size (Index): 128 (59) Index Estimated Time Temperature Celsius 60 2024-09-22 23:50 26 ******* 61 2024-09-23 00:00 26 ******* 62 2024-09-23 00:10 26 ******* 63 2024-09-23 00:20 25 ****** ... ..( 73 skipped). .. ****** 9 2024-09-23 12:40 25 ****** 10 2024-09-23 12:50 26 ******* ... ..( 38 skipped). .. ******* 49 2024-09-23 19:20 26 ******* 50 2024-09-23 19:30 27 ******** ... ..( 3 skipped). .. ******** 54 2024-09-23 20:10 27 ******** 55 2024-09-23 20:20 26 ******* 56 2024-09-23 20:30 27 ******** 57 2024-09-23 20:40 28 ********* 58 2024-09-23 20:50 29 ********** 59 2024-09-23 21:00 29 ********** SCT Error Recovery Control: Read: Disabled Write: Disabled Device Statistics (GP Log 0x04) Page Offset Size Value Flags Description 0x01 ===== = = === == General Statistics (rev 1) == 0x01 0x008 4 116 --- Lifetime Power-On Resets 0x01 0x010 4 10960 --- Power-on Hours 0x01 0x018 6 77827970952 --- Logical Sectors Written 0x01 0x020 6 4806379445 --- Number of Write Commands 0x01 0x028 6 367756285030 --- Logical Sectors Read 0x01 0x030 6 3015277969 --- Number of Read Commands 0x01 0x038 6 2160000 --- Date and Time TimeStamp 0x04 ===== = = === == General Errors Statistics (rev 1) == 0x04 0x008 4 1284 --- Number of Reported Uncorrectable Errors 0x04 0x010 4 2 --- Resets Between Cmd Acceptance and Completion 0x05 ===== = = === == Temperature Statistics (rev 1) == 0x05 0x008 1 29 --- Current Temperature 0x05 0x020 1 50 --- Highest Temperature 0x05 0x028 1 21 --- Lowest Temperature 0x05 0x058 1 70 --- Specified Maximum Operating Temperature 0x06 ===== = = === == Transport Statistics (rev 1) == 0x06 0x008 4 862 --- Number of Hardware Resets 0x06 0x010 4 0 --- Number of ASR Events 0x06 0x018 4 0 --- Number of Interface CRC Errors 0x07 ===== = = === == Solid State Device Statistics (rev 1) == 0x07 0x008 1 1 N-- Percentage Used Endurance Indicator |||_ C monitored condition met ||__ D supports DSN |___ N normalized value Pending Defects log (GP Log 0x0c) not supported SATA Phy Event Counters (GP Log 0x11) ID Size Value Description 0x0001 2 0 Command failed due to ICRC error 0x0002 2 0 R_ERR response for data FIS 0x0003 2 0 R_ERR response for device-to-host data FIS 0x0004 2 0 R_ERR response for host-to-device data FIS 0x0005 2 0 R_ERR response for non-data FIS 0x0006 2 0 R_ERR response for device-to-host non-data FIS 0x0007 2 0 R_ERR response for host-to-device non-data FIS 0x0008 2 0 Device-to-host non-data FIS retries 0x0009 2 65535+ Transition from drive PhyRdy to drive PhyNRdy 0x000a 2 5 Device-to-host register FISes sent due to a COMRESET 0x000b 2 0 CRC errors within host-to-device FIS 0x000d 2 0 Non-CRC errors within host-to-device FIS 0x000f 2 0 R_ERR response for host-to-device data FIS, CRC 0x0010 2 0 R_ERR response for host-to-device data FIS, non-CRC 0x0012 2 0 R_ERR response for host-to-device non-data FIS, CRC 0x0013 2 0 R_ERR response for host-to-device non-data FIS, non-CRC Die TBW mit ca 100TB Written pro drive liegen weit unterhalb der Grantie von 2400TBW des Herstellers. Schuld bin ich mir keiner bewusst. keine übermässige Nutzung, Zuerst betrieben in einem UNraid Server. Im Augenblick in einer UbuntuWorkstation an einem ASUS Rog Strix X570-E Gaming mainboard mit den Onboard sata Anschlüssen. Immer hinter einer UPS, keine Stromspitzen etc. Nun die Fragen: - Ist dies ein Garantiefall? -> Die Festplatten haben noch Garantie bis 2.8.2026 - Gibt es "defekte" Serien? - Mache ich irgend etwas falsch? Wie geht man am besten vor mit einem Lieferanten. Die Disks laufen ja noch . Aber eine grosse Zukunft scheinen sie nicht mehr zu haben. Was empfehlt ihr mir, bzw. was würdet ihr machen? Gruss und Danke für die Hilfe!! Andi P.S. Gerne kann ich bei Bedarf auch noch die outputs der anderen Drives machen sind alle 6 ähnlich.
-
Hallo zusammen Gerne stelle ich hier kurz die Frage zu ZFS, da ich ZFS für snapshot restore etc brauche mich aber auf Poolstufe nichtso auskenne. Ich möchte wie im Titel beschrieben die NVME Disk mit einem ZFS Pool (Pool Name = nvme) drauf auf eine neue gösserer NVME DISK umziehen. Der Pool Name muss bleiben. Auf der Disk sind all meine VMS und Docker von unraid drauf. Folgend die aktuelle Ausgabe von "zpool status nvme": root@unraid2:~# zpool status nvme pool: nvme state: ONLINE config: NAME STATE READ WRITE CKSUM nvme ONLINE 0 0 0 nvme0n1 ONLINE 0 0 0 errors: No known data errors root@unraid2:~# zfs list nvme NAME USED AVAIL REFER MOUNTPOINT nvme 1.30T 467G 1.75M /mnt/nvme Der Pool hat kein Raid, keine Sicherheit und ist nur auf einer Disk, da ich eigentlich nur die Funktionalität "snapshot restore" und dazu sanoid und syncoid brauche .... Folgend mein gedachter Arbeitsablauf: Pool "nvme" (mit allen ZFS auf Festplatte (es stehen 16TB auf dem Server zur Verfügung) "sichern" (ich habe nur einen NVME Slot auf dem Motherboard) 2TB drive durch 4TB drive ersetzen Pool "nvme" von Festplatte auf neues drive zurückspielen Ziel ist es, das alle "ZFSs" drauf bestehen belieb und ich in Unraid nichts ändern muss ..... Jetzt die einfache Frage: Wie geht das? Gibt es da einen einfachen (oder anderen) Weg? Habe nur für mich kryptisches auf dem Netz gefunden .... Danke für den Wegzeiger/ die Hilfestellung Andi _________ Vielleicht einfach noch ein wenig Hintergrund -> Ich bin ein Windowskind, und dachte ich können die Festplatte (Samsung-NVME-Disk) mit Samsung Magiscian clonen und danch die Partition von 2 auf 4 TB vergrössern ..... diesen Weg habe ich aber nicht gefunden .... Magiscian kann nur mit wenigen definierten Partitionsformaten umgehen ..... ist eingeschränkt .... oder ich habs wieder einmal nicht gefunden wie ....
-
@Rysz i have just tried it again and now it (command line & Reboot) works wonderful! Thank you for your help!! @steini84 Please bring back the wonderfull Sanoid plugin for Unraid7 🙏


