





Domotics
Members
-
Joined
-
Not sure if it is useful anymore. i downloaded the Intel NVM updater and updated the NVM to latest version 3.70 and after that the card is back up again. don't know it will stay trouble free. the dmesg looks good as far as i can see. Also attched the latest diagnostics. root@HOME-SERVER-01:~# dmesg | grep -i ixgbe [ 27.361295] ixgbe: Intel(R) 10 Gigabit PCI Express Network Driver [ 27.361582] ixgbe: Copyright (c) 1999-2016 Intel Corporation. [ 28.036206] ixgbe 0000:01:00.0: Multiqueue Enabled: Rx Queue count = 12, Tx Queue count = 12 XDP Queue count = 0 [ 28.134046] ixgbe 0000:01:00.0: 32.000 Gb/s available PCIe bandwidth (5.0 GT/s PCIe x8 link) [ 28.246146] ixgbe 0000:01:00.0: MAC: 4, PHY: 0, PBA No: H88630-002 [ 28.246148] ixgbe 0000:01:00.0: 9c:69:b4:66:9f:80 [ 28.407110] ixgbe 0000:01:00.0: Intel(R) 10 Gigabit Network Connection [ 28.407298] ixgbe 0000:01:00.0: Firmware logging not supported [ 29.084765] ixgbe 0000:01:00.1: Multiqueue Enabled: Rx Queue count = 12, Tx Queue count = 12 XDP Queue count = 0 [ 29.182127] ixgbe 0000:01:00.1: 32.000 Gb/s available PCIe bandwidth (5.0 GT/s PCIe x8 link) [ 29.294107] ixgbe 0000:01:00.1: MAC: 4, PHY: 0, PBA No: H88630-002 [ 29.294155] ixgbe 0000:01:00.1: 9c:69:b4:66:9f:81 [ 33.272152] ixgbe 0000:01:00.1: Intel(R) 10 Gigabit Network Connection [ 33.272539] ixgbe 0000:01:00.1: Firmware logging not supported [ 35.670084] ixgbe 0000:01:00.1: complete [ 35.693128] ixgbe 0000:01:00.0: complete [ 36.082129] ixgbe: Intel(R) 10 Gigabit PCI Express Network Driver [ 36.082131] ixgbe: Copyright (c) 1999-2016 Intel Corporation. [ 36.756763] ixgbe 0000:01:00.0: Multiqueue Enabled: Rx Queue count = 12, Tx Queue count = 12 XDP Queue count = 0 [ 36.854124] ixgbe 0000:01:00.0: 32.000 Gb/s available PCIe bandwidth (5.0 GT/s PCIe x8 link) [ 36.966109] ixgbe 0000:01:00.0: MAC: 4, PHY: 0, PBA No: H88630-002 [ 36.966123] ixgbe 0000:01:00.0: 9c:69:b4:66:9f:80 [ 37.130987] ixgbe 0000:01:00.0: Intel(R) 10 Gigabit Network Connection [ 37.131080] ixgbe 0000:01:00.0: Firmware logging not supported [ 37.812791] ixgbe 0000:01:00.1: Multiqueue Enabled: Rx Queue count = 12, Tx Queue count = 12 XDP Queue count = 0 [ 37.910123] ixgbe 0000:01:00.1: 32.000 Gb/s available PCIe bandwidth (5.0 GT/s PCIe x8 link) [ 38.022107] ixgbe 0000:01:00.1: MAC: 4, PHY: 0, PBA No: H88630-002 [ 38.022121] ixgbe 0000:01:00.1: 9c:69:b4:66:9f:81 [ 41.999989] ixgbe 0000:01:00.1: Intel(R) 10 Gigabit Network Connection [ 42.000089] ixgbe 0000:01:00.1: Firmware logging not supported [ 42.339292] ixgbe 0000:01:00.0: registered PHC device on eth0 [ 42.478734] ixgbe 0000:01:00.0 eth0: entered allmulticast mode [ 42.479455] ixgbe 0000:01:00.0 eth0: entered promiscuous mode [ 47.042766] ixgbe 0000:01:00.0 eth0: NIC Link is Up 10 Gbps, Flow Control: None [ 50.779285] ixgbe 0000:01:00.1: registered PHC device on eth1 home-server-01-diagnostics-20260725-1729.zip
-
Google AI suggest if i upgrade the NVM using https://www.intel.com/content/www/us/en/download/19359/non-volatile-memory-nvm-update-utility-for-intel-ethernet-adapters-550-series-windows.html, it might fix it. not sure about this yet. will anyway.
-
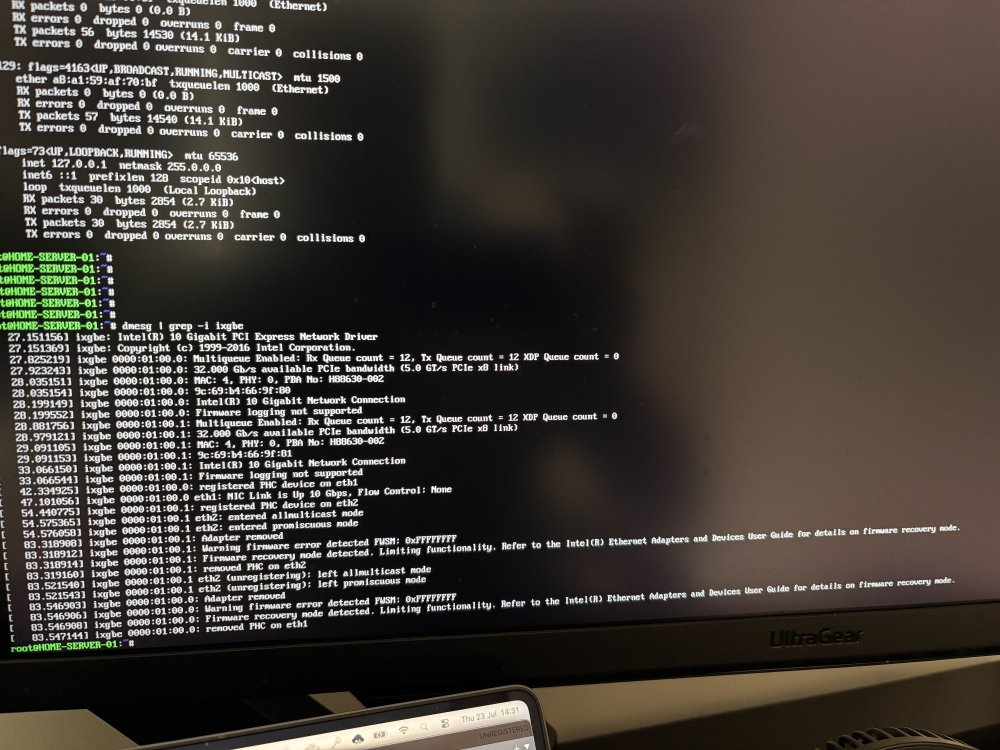
Hi Folks, I recently upgraded the network to Intel X550-T2B card hoping to use my 10G home network. Initially when installed the server was on 7.3.0 i beleive and it worked (at least detected and worked for few days). And recently upgraded to latest version 7.3.2. initially the card showed up on the system and i was able to use it as my main network. recently the card disappeard from the system and i can no longer get it to work. looks like a driver problem. anyone know if there is a fix for this ? i think intially the system booted on onboard NIC, and i made some changes on network settings page which let me move br0 interface to the 10GB port. since the card disappeard, i can no longer open the UI using static IP assigned to the system I am using an AsRock B560 PRO-4 motherboard with Intel 10400 CPU and the Network card is installed on PCIE1 not sure if i can pull diagnostics without UI access. attached some info about the error from card/driver. the card was purchased from Ali Express.
-
Hello friends, Am running the latest stable version on UnRaid 6.10.3. I have been observing an issue with my Unraid server lately. At times the WebUI goes offline and I cannot login anymore. after several tries, it comes back but very very slow to load the UI. then, I tried to stop a few containers (namely PiHole, UnRaid-API, Grafana-Unraid-Stack etc) and then the server slowly comes back. Last time it happened, I permanently stopped `Pi-Hole`, thinking that was the culprit. But it happened again this morning, and I stopped `UnRaid-API` and the server started responding again, it took a while to stabilize, though. I also checked the “htop” during this time, and found some processes under “/usr/local/emhttp/WebGui/nchan/*” running very high on CPU. Anybody faced this issue before ? I took a diagnostics (after the fact), not sure if it helps.. fusion-diagnostics-20220809-0928.zip
-
I have narrowed it down to windows VM running BlueIris, has anyone managed to solve this disk activity problem?
-
I don't know if it really helped, but since i moved the frigate.db from share to cache , it is running fine so far. haven't crashed since last few days. of course i don't consider it as stable yet. i will monitor for another week or so...
-
You mean the temperature monitoring ? yes i have that installed. for now it is running fine and the temperature is shown below 50 most times. As part of the troubleshooting, I have moved the frigate.db to nvme (it was on the share before and the share was setup with cache enabled). Now the DB should always stay on the nvme, hopefully it will make some differance.
-
This is pretty much the case. I opend this issue a while ago and closed it thinking my issue was fixed. https://github.com/blakeblackshear/frigate/issues/3283 Appears like it is not. now it is pretty much clear the the sudden hike in the coral module temperature is causing shutdown of TPU and this is leading frigate to crash. i am almost sure it is not caused by an unassigned device because i don't have one and it still fails. am scratching my head to figure out what triggers the sudden increase of TPU temperature.. In my case, am using a mini PCIE module attched on a miniPCIE to PCI express card (specifically this one). This is a cheap device so it could be the reason (possibily).. waiting for some more people facing this issue to come up with their theory.. My system is well ventilated and have 5 FANS running to keep things under low temp.. my CPU/MoBo, Disks etc, run below the threshoulds.. it is just this TPU going crazy at times.
-
I know this is a very old post, but just wondering if you found a solution to this ?i have similar situation where BI is running on a Windows VM and its keeping the disk busy. if I shutdown the VM, the disk will spin down eventually and stay.
-
Is there anyway i can use the included influxDB in Grafana-Unraid-Stack for other purposes, for example with homeassistant ? i tried to open the influxdb with <ip>:8086 but i get 404 page not found error.
-
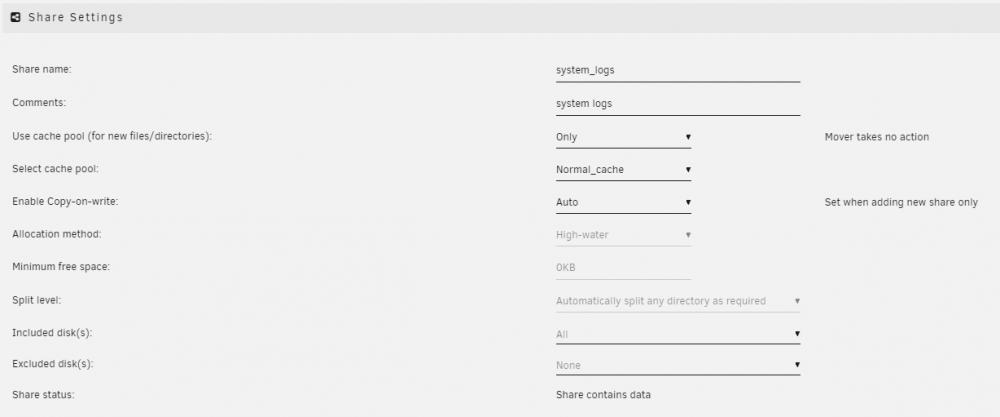
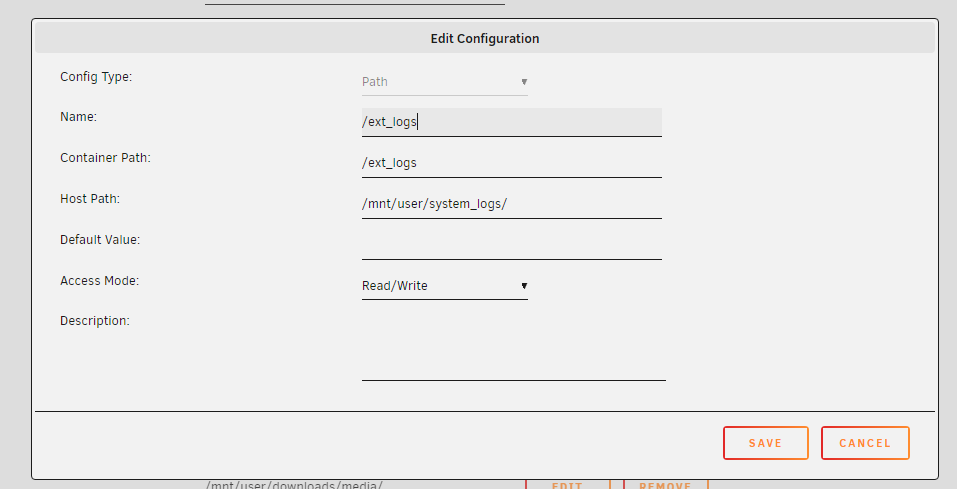
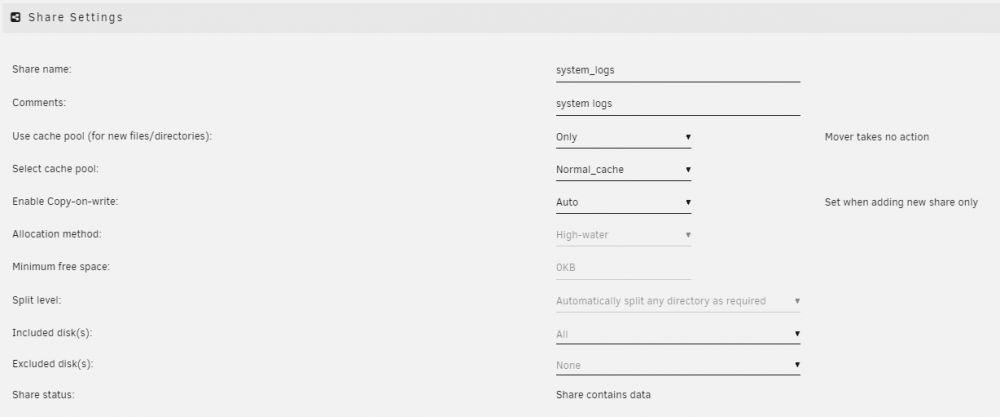
That is a fair point. posted couple of screenshots above. more more clarity i will mentioned the details again below. 1. setup a new share for storing log files (preferably set to cache only so it will not harm the spinning disks) - example screenshot below 2. Edit nextcloud container settings and add an additional path and point it to the share created in the previous step. 3. edit the config.php (normally located on /mnt/user/appdata/nextcloud/www/nextcloud/config/config.php) and add the below lines somewhere in between the other configs there. 'logfile' => '/ext_logs/nextcloud_logs/nextcloud.log', 'logfile_audit' => '/ext_logs/nextcloud_logs/audit.log', 4. restart the nextcloud container. 5. verify the disk with nextcloud data is spinning down after the timeout you set. Hope this helps.
-
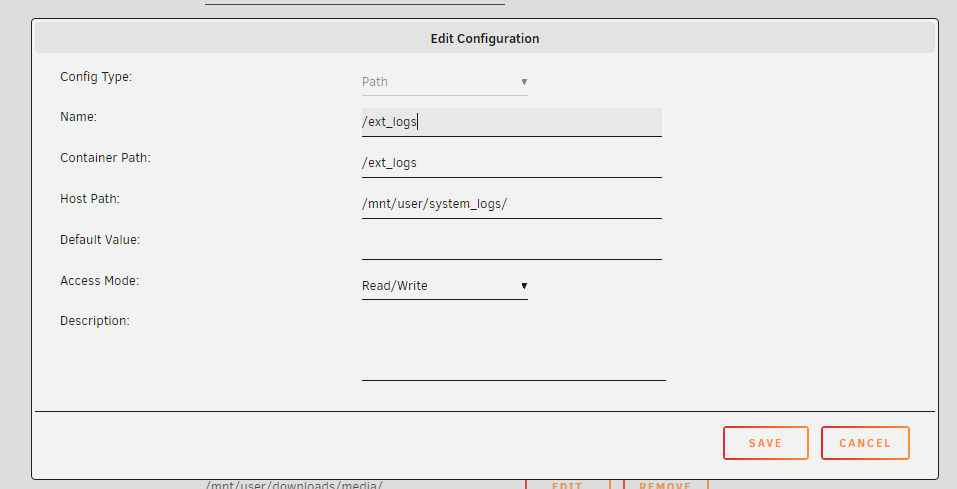
this is how is it setup on nextcloud and this is the share settings.
-
ext_logs is share with cache (only) and this share is mounted as an external path on the nextcloud container. so this is not on the docker itself.
-
my nextcloud issue is solved by adding these two lines to the config.php 'logfile' => '/ext_logs/nextcloud_logs/nextcloud.log', 'logfile_audit' => '/ext_logs/nextcloud_logs/audit.log', More details on it here and here
-
my nextcloud issue is solved by adding these two lines to the config.php 'logfile' => '/ext_logs/nextcloud_logs/nextcloud.log', 'logfile_audit' => '/ext_logs/nextcloud_logs/audit.log', More details on it here and here


