





Free Man
Members
-
Joined
-
Last visited
Everything posted by Free Man
-
Wow! Without stopping Docker or VMs first, just hitting "Stop" and "Proceed", it took 3:12 (192 seconds) to stop the array. The miracle is that I've had only 2 unclean shutdowns. I'll move the timeout from 90 to 230 seconds. I did a "Stop All" on the container page and that took 3:06 (186 seconds). I'll definitely add 30 seconds to that timeout as well. Follow up question, though: The setting (Settings | Docker| Docker Stop Timeout) appears to be the timeout for a single container stop. It's a default of 10, which seems very short to me. Do I want to test shutting down each individual container and set it to a comfort margin above the slowest recorded shut down time, or does this also apply to a bulk shut down, such as on a restart, therefore it needs to be larger than the combined time? For now, I've bumped the timeout from 10 seconds to 45, assuming my first theory is correct and it's not a total timeout.
-
I've rebooted my server twice in the last week or two. First time, I hit the "Reboot" button under Array Operations on the Main tab, the second time, I clicked the "Reboot now" button after installing the 7.3.1 upgrade (from 7.3.0). I have no idea what might have caused these unclean shutdowns, since I asked the server to do it, and it wasn't the result of a power outage or other unexpected situation. This afternoon, I tried shutting down the VM service, then rebooted, and it came up clean. I don't know if that had anything to do with it or not. Diagnostics are from after this most recent (successful/clean) reboot, though I don't know if they'll be all that helpful. I'm also attaching the copy of the syslog that's being written to a pool by the Syslog Server (don't know if that's got any older info that may not be included in the diagnostics). The upgrade & reboot happened on 1 June with the reboot starting at "Jun 1 16:54:29" (to make searching easier). If anyone can find a reason that the shutdown was unclean, I'll at least have an idea of what to watch for before doing a restart in the future. As it stands, it seems that shutting down the VM service (I only have one VM running) "fixes" the problem, so maybe it's not waiting long enough for the VM to stop and it still has files open, leading to the "unclean" tag when the server restarts? nas-diagnostics-20260603-1648.zipsyslog-192.168.1.5.log
-
Thank you!! I'm new to USB manager and enabled HUB Processing to see what it would do and got that message. Didn't realize that I must have also enabled USBIP at the same time. I was wondering what I broke... What is USBIP? Does that allow a VM to access a USB device that's elsewhere on the network?
-
Took me about as long to note your reply as it did you to note my post, so I'd say we're even. 😀 Thanks for the info. I'll try to remember that the next time I have an "issue" with DiskLocation. Note that issue is in quotes because I don't think I've had any other than of my own doing.
-
Fix Common Problems has alerted me that I'm getting Out Of Memory errors. I've noted that the dashboard shown RAM usage at ~75% for a while now, but I've not seen it hit 100%. Of course, that may be happening when I'm not looking. nas-diagnostics-20260503-1457.zip Open to recommendations, suggestions, fixes, whatever you got! TIA
-
For the record: I did shutdown VM & Docker, run mover, and start them back up.
-
Thanks for the tip! Both domains & system are now set to live on the 'apps' share (with the mover set to move array -> apps), along with my appdata share that was already there. I'm using barely 100GB out of the 1TB of space in that array, so I'm sure there will be plenty of space. I can stop the VM service and shut down all containers except the disk speed test to run it clean, if you think that would be of benefit. Otherwise, I'll just wait until 1 May to see what happens...
-
Is it recommended to have this on cache somewhere? I've got space on an SSD pool that I could easily move it.
-
Not yet - I wanted to let the check finish since I was so many hours into it. I'm pondering now, though, how do I use the Disk Speed Test container when the array is in Maintenance mode? Doesn't that prevent Docker & VM from running, which means I can't run a container?
-
Well, it finally finished! My last parity builds/checks since I installed this 14TB parity drive: Scheduled Non-Correcting Parity-Check 2026-04-07, 03:48:18 (Tuesday) 14 TB 2 day, 7 hr, 32 min, 8 sec 70.0 MB/s OK 0 2 day, 8 hr, 36 min, 4 sec 5 Scheduled Correcting Parity-Check 2026-04-03, 19:11:09 (Friday) 14 TB 1 day, 13 hr, 13 min, 57 sec 104.5 MB/s Canceled 0 1 day, 14 hr, 31 min, 59 sec 3 Parity-Check 2026-04-01, 11:53:25 (Wednesday) 14 TB 3 hr, 17 min, 2 sec Unavailable Canceled 0 Parity-Sync 2026-03-08, 12:48:33 (Sunday) 14 TB 20 hr, 32 min, 53 sec 189.3 MB/s OK 0 1 day, 20 hr, 56 min, 54 sec 4 I don't get it. I guess we'll see how it goes next month...
-
Well, I've just let it run. It's now 10TB and running around 120MB/s, though I did note one brief drop to about 20MB/s. I wish there was a way to record the speed every second/minute & graph it and see if the graph at all looked like the disk speed test graph...
-
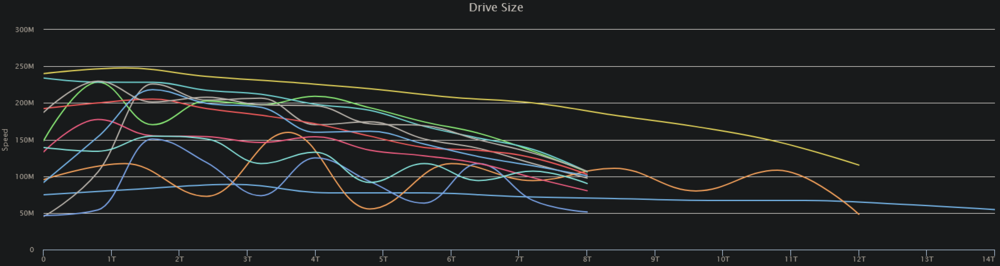
It finished just as I posted that. Overall, it's a pretty bleak picture without the Speed Gap detection. Again, though, on March 8th was one of my fastest parity checks ever, including this 14TB drive as the parity drive. Disk 11 (the wavy orange line extending to 12TB) is the only drive added since that last check, but it shouldn't be impacting the 1st TB speed this severely.
-
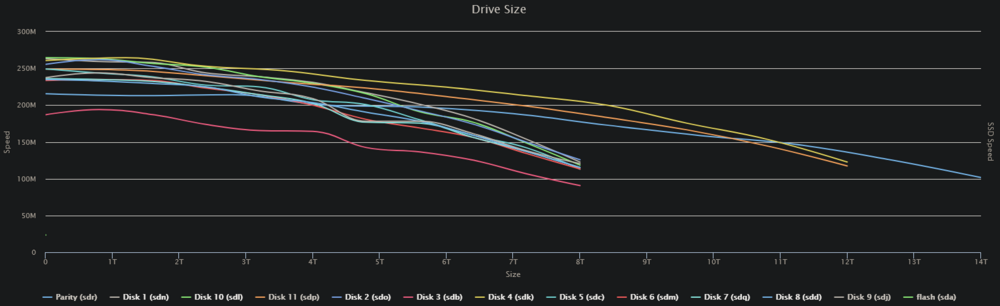
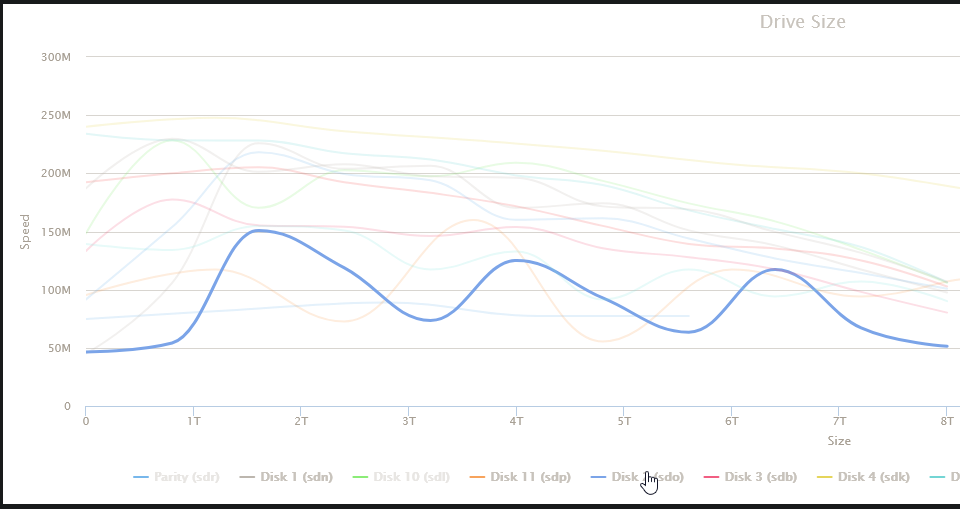
I even rebooted my desktop machine and I'm still getting the writes on 5 & 2. Then I realized I've got a VM running! 🤦♂️ I've shut it down, but I'm still getting some writes. I'm also getting some all-drive reads and a parity drive/drive 2 write combos. Something is still active on the server, but I'm at a loss... Diskspeed test results: The comments on the run: Disk 3 is a bit of an outlier and slower than the rest, but none of them are 50MB/s slow! The test is completed and something is still pushing little blips to disk2, and my parity check is still running at 57MB/s... I was getting a number of Speed Gap warnings, so I decided to run it with that disabled. I think I found my problem: The question now: Why has Disk 2 suddenly decided to read so slowly??? My last parity check last month: Hard to believe that the overall speed would have climbed to 189MB/s after a start like this from disk2. There's nothing in the SMART data that indicates there are any issues, at least not to my untrained eye. I'm open to any & all suggestions/fixes.

-
Thanks for looking! I've stopped all containers. Didn't make any difference to read speed, well, it had recovered from the 25MB/s range back up to the 50s, and now it's in the 55-58MB/s range, and I'm still getting random writes to disk 5. I've shut down every application on the 3 computers that would be accessing the server. I don't have a clue where those writes are coming from. Can I run the diskspeed test while the parity check is running or should I pause it? I'd presume I should pause for accuracy...
-
Now it's slowed down to 24-26MB/s! 😢
-
My last dozen parity checks have run at 123.1MB/s at the slowest to 189.3MB/s at the fastest. Eyeball average around 130-135ish. My start-of-month parity check kicked off on the 1st and is running at about 55MB/s! I paused all docker containers, and that didn't made a lick of difference in the speed, so I don't think it was them to begin with. I recently added a new disk and it's a bit slower than the existing ones but it's not this slow! The disk speed test in the Disk Location plugin indicates the slowest of my drives is around 167MB/s (eyeball avg of last 12 test speeds), and my new Parity drive is sluggish at 184MB/s. The rest (eyeball) average about 220-230MB/s. My parity rebuild (when I added a new drive and a new, larger parity drive) was somewhere in the 100+MB/s range (don't recall, but it was a reasonable number - nothing to raise any concern). Almost all my disk access would be through one of the docker containers (immich, Emby, Jellyfin, etc.), so I don't think I had anything actively reading/writing (when I paused containers) other than the parity check. I've got a couple of File Explorer windows open to unraid locations, but that's it, and certainly not anything I wouldn't have had open on previous runs. I stopped the parity check yesterday out of frustration. It kicked off again overnight (there was an unclean shut down due to power outage - I guess the UPS battery life isn't as optimist as the screen reports) and today it's running at about the same speed. nas-diagnostics-20260404-1211.zip Any thoughts/ideas on why this is suddenly running at ~1/3 to 1/4 the speed it normally runs? Any possibility that a reboot might fix it? If a reboot fixes it, any suggestions on what to do to prevent this slowdown again in the future? I don't recall ever having a parity check run this slowly...
-
Very sad, indeed, and hopes thoroughly dashed. However, your reasons are sound and legitimate, no matter how much I don't like the result. I'll thank you again for your decade of development and support! I presume that there's nothing that will immediately break, but that, as unRAID evolves, controlr is likely to fail, based on the details you shared.
-
Maybe the issue is just that I don't know what the default colors are, so having to push the "Reset All Custom Colors" button is a bit scary because I don't know how much work I'd have to do to get it back to the way it is (with the exception of the incorrectly colored drive). Maybe something that indicates that a color is changed from the default might be helpful. I ended up selecting all the colors and screen shotting the hex codes for them in case I needed to reset everything to these colors because I decided I didn't like the defaults...
-
I just did a Ctrl-F5 in Firefox (which should force a full refresh, IIUC) and it's still that way. I'm using FF 148.0.2 on Win11 No compose manager plugin (maybe I should investigate that to see what it does for me... 😀) Yes, I usually have Advanced View on - I like the per-folder load stats as a quick hint of where to look if things seem odd Version 2026.03.28.1 HAS fixed the issue! Thanks for such quick work! And thanks again for picking this up - it's greatly appreciated!!
-
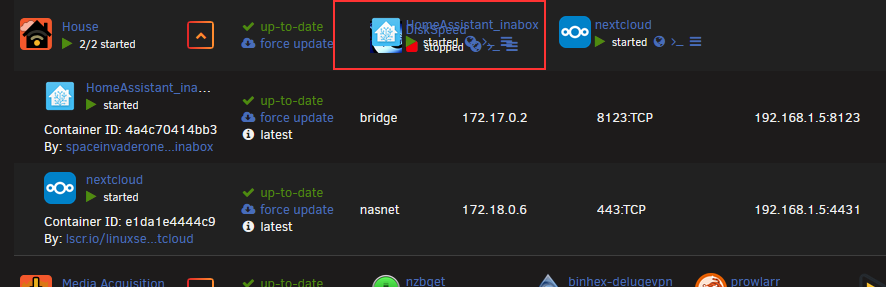
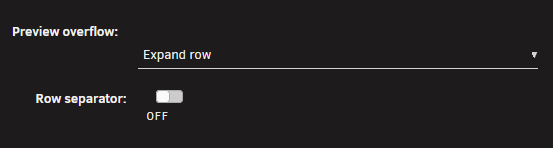
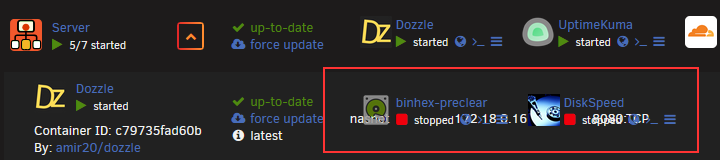
Just updated to 2026.03.27 and there are a couple of display anomalies. TL;DR: When Preview Overflow is set to Expand Row, the icons wrap, but the rows do not expand vertically to accommodate them. They all seem to be related to the Preview Overflow field being set to Expand Row, and it actually needing to expand the row height due to overflow. The formatting is a bit weird here, because I thought I had 3 different issues, but now I realize they're all tied to the same thing. 1) In one folder, there are 3 Containers displayed, two of them are piled on top of each other. However, there are only 2 containers in this folder: I just realized that the 2nd container listed here an overflow from the folder above 2) In a second folder, the first 3 containers are overlaid with an additional 3. There are a total of 9 containers in this folder, and the Preview overflow is set to "expand row". 3) In that same folder, when I click the orange drop down icon to expand the folder, the 3 containers that should be on row 2 now appear on a second row, but they overlap the text of the first container in the folder: These are definitely new and weren't there yesterday, prior to the update. I almost forgot to add: THANK YOU chodeus for picking this up and running with it! It was a great piece of work that has been abandoned by others. Thank you for fostering it back to health and I hope it has a permanent home with you.



-
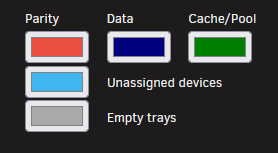
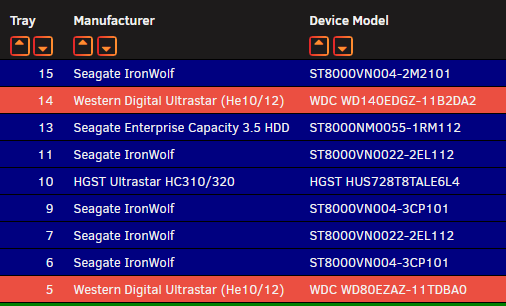
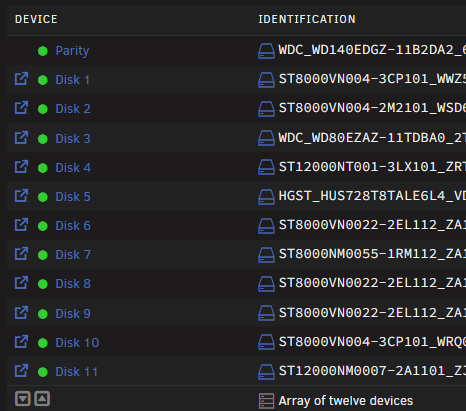
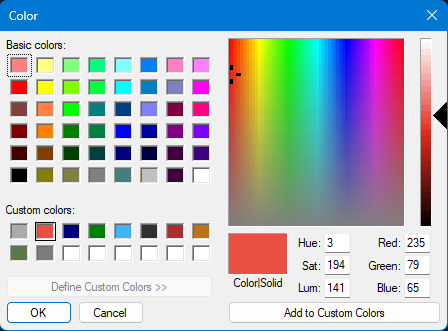
I've been using DiskLocation for ages and really appreciate it! Unfortunately, I have an issue with the drive color display. I have this peach/orange color for the parity drives And my device information screen shows Which seems cool, except that I only have 1 parity drive (the bottom WD in tray 5), not 2! On the Tray Allocations page, there's a "Reset All Custom Colors" button and it also says "or choose "Empty" color (first color listed) per device under "Custom Color" to reset, and then hit the "Save" button." but I'm not sure where this "Empty" color is. When I click one of the color buttons on the Config page, I get the standard (really old) Windows color chooser Is one of these supposed to be the "Empty" color? I did just try the "Reset All Custom Colors" button and it did reset the tray 14 color to blue (it used to be my parity drive, so it's not totally unreasonable that it would have been the parity color). I've spent 15 minutes or more messing with this and being confused by it. I guess there isn't any issue per se, but I think that maybe the button could use a title text change (maybe I didn't have custom colors, because they didn't change - I've had this running for ages and am very appreciative of your work!), and the additional text could use some additional clarity - maybe it was written on a non-Windows based system that presents the user with an "empty" color option. Or.... it just hit me, the "Empty" color is the grey color. Was I supposed to chose that one? Would that have reset just the one parity drive? Maybe I'm just being dense, but this is a bit confusing to me and there is no help around this particular option.
-
I will note that posting the question here seems to have resolved the issue. Always happens that way...

-
Glad to hear you're still working on this, @jbrodriguez! I've used this for years and really appreciate it. AIUI, you've worked around some limitations by writing your own plugin and you've invested a lot into that over the years. I'd think that the pain of rewriting the app once to use the unraid-api and take advantage of everything LT is doing would outweigh the ongoing pain of maintaining both the app and the plugin. But... I'm not the one writing & maintaining the code, so that's just a SWAG from my end. If you go that route, you might offer the opportunity to continue with the plugin (as is, potentially no more development) or switch to the ur-api... Whichever way you chose to go forward, know that your efforts are appreciated!
-
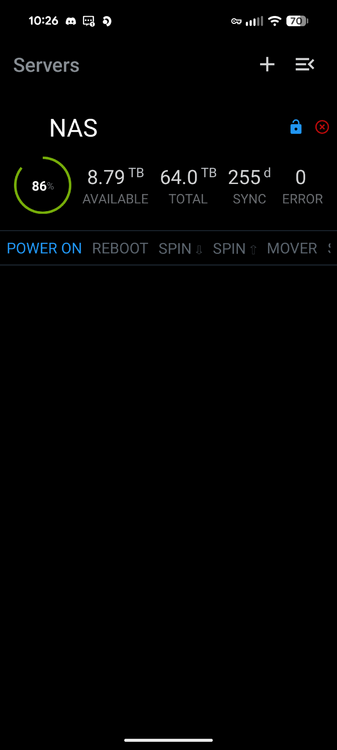
This hasn't worked for me for quite a while. I see the last posts were 9 months ago. Is this still being supported? Does this still work? All that happens when I run the app is I get the main screen, but nothing happens when I click on my server - it doesn't take me to the details page, it doesn't indicate that it's trying, nothing. Weirdly, I just thought I'd try this... I hit the Spin Down button- it said it was waiting for the process to finish, then the red x turned into a green check mark, my disk utilization updated, and I was able to click into the server details. Any hints or clues as to why this happened? I'm glad I've figured it out for future use, but I'd think it should update itself every time I launch the app. Google Pixel 8, Android 16, security update March 5, 2026
-
I see that there were some issues with permissions and losing data on upgrade, but that these were from 2023, and it's now early 2026. Have these all been fixed, or do I still need to worry about permissions? Do I need to worry about loosing data if/when there's an update?





