stanger89
Members
-
Joined
-
Last visited
Everything posted by stanger89
-
Yeah really all I'm trying to do is be able to access certain photos from my phone/away from home. I have a lot of photos that I've "developed" from my DLSR that are stored on my unraid server and I run as slideshows on my TVs. I'd like to be able to get at those on my phone. Don't need them stored in the cloud (I've already got a backup solution). Sounds like Immich is worth a shot. I wasn't sure if there was something simpler/less overkill.
-
So I've searched around and I found a number of threads about photo backup but I'm looking for something simpler. What I'm looking for is something that will let me view a set of pictures on my unraid server remotely (notably from my Android phone). I'm not necessarily looking for backup, I'm still using google for backing up my phone photos, and I've also got resilio sync syncing those to my server as well. What I have is pictures I took with my DSLR and processed that I'd like to be able to view from my phone. I've thought about using resilio sync to sync those to my phone but I don't need them all stored on my phone, so I was hoping to find something that will pull down photos/previews on demand. I've already got wireguard setup to let my phone access my LAN for other apps like Home Assistant. I thought maybe I could use plex, but it requires and account (which I don't have) for the VPN connection. Immich seems like it would work, but also seems like massive overkill for what I'm looking for. Any other ideas? Thanks
-
Hey, I just installed the nodered container (wanted to try and mess with it in home assistant) but I'm having some trouble installing any nodes. Anyone have any thoughts, here's the install log: --edit - I found an issue on docker hub, the issue was hard links need to be enabled under Global Share Settings: https://github.com/node-red/node-red-docker/issues/332 0 verbose cli /usr/local/bin/node /usr/local/bin/npm 1 info using [email protected] 2 info using [email protected] 3 timing npm:load:whichnode Completed in 0ms 4 timing config:load:defaults Completed in 1ms 5 timing config:load:file:/usr/local/lib/node_modules/npm/npmrc Completed in 0ms 6 timing config:load:builtin Completed in 1ms 7 warn config production Use `--omit=dev` instead. 8 timing config:load:cli Completed in 1ms 9 timing config:load:env Completed in 0ms 10 timing config:load:file:/data/.npmrc Completed in 0ms 11 timing config:load:project Completed in 1ms 12 timing config:load:file:/root/.npmrc Completed in 0ms 13 timing config:load:user Completed in 0ms 14 timing config:load:file:/usr/local/etc/npmrc Completed in 1ms 15 timing config:load:global Completed in 1ms 16 timing config:load:validate Completed in 0ms 17 timing config:load:credentials Completed in 1ms 18 timing config:load:setEnvs Completed in 1ms 19 timing config:load Completed in 9ms 20 timing npm:load:configload Completed in 9ms 21 timing npm:load:mkdirpcache Completed in 3ms 22 timing npm:load:mkdirplogs Completed in 1ms 23 verbose title npm install [email protected] 24 verbose argv "install" "--no-audit" "--no-update-notifier" "--no-fund" "--save" "--save-prefix" "~" "--production" "--engine-strict" "[email protected]" 25 timing npm:load:setTitle Completed in 1ms 26 timing config:load:flatten Completed in 3ms 27 timing npm:load:display Completed in 5ms 28 verbose logfile logs-max:10 dir:/data/.npm/_logs 29 verbose logfile /data/.npm/_logs/2023-12-03T18_08_57_891Z-debug-0.log 30 timing npm:load:logFile Completed in 6ms 31 timing npm:load:timers Completed in 0ms 32 timing npm:load:configScope Completed in 0ms 33 timing npm:load Completed in 27ms 34 timing arborist:ctor Completed in 0ms 35 silly logfile done cleaning log files 36 timing arborist:ctor Completed in 0ms 37 timing idealTree:init Completed in 12ms 38 timing idealTree:userRequests Completed in 4ms 39 silly idealTree buildDeps 40 silly fetch manifest [email protected] 41 http fetch GET 200 https://registry.npmjs.org/node-red-contrib-home-assistant-websocket 148ms (cache miss) 42 silly placeDep ROOT node-red-contrib-home-assistant-websocket@ OK for: [email protected] want: 0.59.0 43 timing idealTree:#root Completed in 153ms 44 timing idealTree:node_modules/node-red-contrib-home-assistant-websocket Completed in 1ms 45 timing idealTree:buildDeps Completed in 155ms 46 timing idealTree:fixDepFlags Completed in 0ms 47 timing idealTree Completed in 172ms 48 timing command:install Completed in 181ms 49 verbose type invalid-json 50 verbose stack FetchError: invalid json response body at https://registry.npmjs.org/node-red-contrib-home-assistant-websocket reason: Invalid response body while trying to fetch https://registry.npmjs.org/node-red-contrib-home-assistant-websocket: ENOSYS: function not implemented, link '/data/.npm/_cacache/tmp/5fb7a063' -> '/data/.npm/_cacache/content-v2/sha512/5c/6d/39a29f9624fe29b833e5a3f0c7dc3114b8613d3a6d9a560353079424535eb1bd68d551124c1d71926d968f2a89210a200a36d2c820c3a018123ffac54037' 50 verbose stack at Response.json (/usr/local/lib/node_modules/npm/node_modules/minipass-fetch/lib/body.js:79:13) 50 verbose stack at async RegistryFetcher.packument (/usr/local/lib/node_modules/npm/node_modules/pacote/lib/registry.js:99:25) 50 verbose stack at async RegistryFetcher.manifest (/usr/local/lib/node_modules/npm/node_modules/pacote/lib/registry.js:124:23) 50 verbose stack at async Arborist.[nodeFromEdge] (/usr/local/lib/node_modules/npm/node_modules/@npmcli/arborist/lib/arborist/build-ideal-tree.js:1061:19) 50 verbose stack at async Arborist.[buildDepStep] (/usr/local/lib/node_modules/npm/node_modules/@npmcli/arborist/lib/arborist/build-ideal-tree.js:930:11) 50 verbose stack at async Arborist.buildIdealTree (/usr/local/lib/node_modules/npm/node_modules/@npmcli/arborist/lib/arborist/build-ideal-tree.js:211:7) 50 verbose stack at async Promise.all (index 1) 50 verbose stack at async Arborist.reify (/usr/local/lib/node_modules/npm/node_modules/@npmcli/arborist/lib/arborist/reify.js:154:5) 50 verbose stack at async Install.exec (/usr/local/lib/node_modules/npm/lib/commands/install.js:145:5) 50 verbose stack at async module.exports (/usr/local/lib/node_modules/npm/lib/cli.js:78:5) 51 verbose cwd /data/.npm 52 verbose Linux 6.1.63-Unraid 53 verbose node v16.20.2 54 verbose npm v8.19.4 55 error code FETCH_ERROR 56 error errno FETCH_ERROR 57 error invalid json response body at https://registry.npmjs.org/node-red-contrib-home-assistant-websocket reason: Invalid response body while trying to fetch https://registry.npmjs.org/node-red-contrib-home-assistant-websocket: ENOSYS: function not implemented, link '/data/.npm/_cacache/tmp/5fb7a063' -> '/data/.npm/_cacache/content-v2/sha512/5c/6d/39a29f9624fe29b833e5a3f0c7dc3114b8613d3a6d9a560353079424535eb1bd68d551124c1d71926d968f2a89210a200a36d2c820c3a018123ffac54037' 58 verbose exit 1 59 timing npm Completed in 278ms 60 verbose unfinished npm timer reify 1701626937983 61 verbose unfinished npm timer reify:loadTrees 1701626937989 62 verbose code 1 63 error A complete log of this run can be found in: 63 error /data/.npm/_logs/2023-12-03T18_08_57_891Z-debug-0.log
-
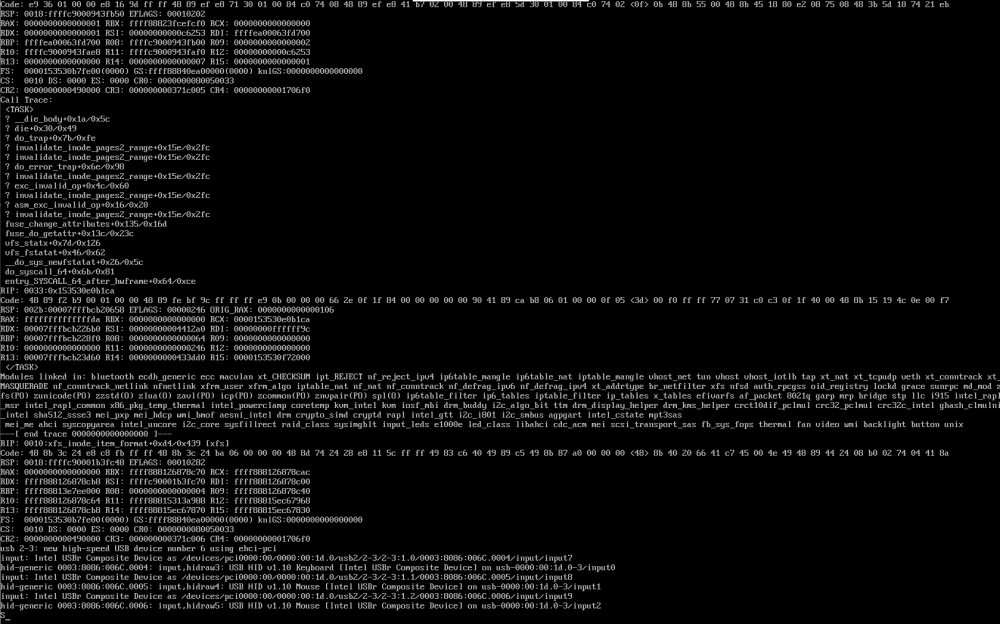
So far I've managed to verify it's "stable" with Community Applications and Check For Common Problems plugins enabled. I had an issue once after installing Disk Location, but was not able to capture any useful data and haven't taken the time to try again. Now I say "stable" in quotes because after a number of days of solid operation things started going unresponsive again. I did capture diagnostics before it was completely unresponsive, but once it was unresponsive I capture the following from the console: It looks like this might be different than what I was previously running into, since I wasn't seeing the call traces before. Unfortunately I probably won't be able to get back to debug for a while, but I wanted to collect the data before I lost it. unraid-diagnostics-20230925-1315.zip
-
Thanks, the rename was the part I was missing.
-
Dumb question, reinstall while I'm in safe mode?
-
OK, so minor update, I'm still in safe mode, but back to all my normal containers running and everything seems OK, so I guess it's time to start enabling plugins. Apparently I'm not using the correct search terms, but what's the "proper" way to test re-enabling plugins?
-
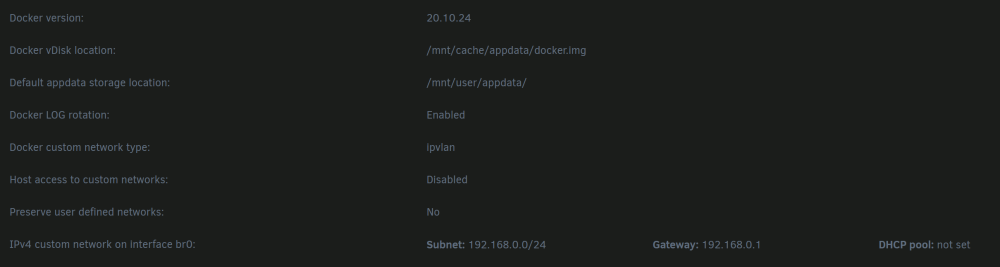
Yeah, it's a little complicated. You're right, it's not totally frozen and does respond to a keyboard/mouse, however, if you're not already logged in locally on the console, you can't log in, it times out after 60 seconds from entering the username. That was what I tried above with the remote syslog (with all the USB cruft in the logs from the IPMI periodically reconnecting), I logged in to the console before the apparent network issues, and yes it wasn't completely frozen. This is also evidenced by the fact that eventually the shutdown/powerdown sequence completed after hitting the power button, but it was on the order of 9 hours later it finally completed. I do agree that it seems network related, and currently the leading suspect is something docker related. Right now my system is still up in safe mode with Home Assistant and zwave-js-ui running both with host network config. I've also started plex, which is also host networking and LMS which is one of my containers which are custom IPs on br0. I have several other containers that also use custom IPs on br0. I'm wondering if there's something wrong with how I've got that setup that's not compatible with 6.12. Here's my docker config:
-
Alright, hopefully good news for debugging. I updated to 6.12.4 again this morning, unfortunately as expected it went unresponsive after less than an hour. This time I hit the power button hoping it would eventually shut down and capture diagnostics. Turns out after about 9 hours or so, eventually the server had finally shut itself down and appears to have captured diagnostics. I've attached the diagnostics. Right now I'm running in safe mode, I started the array and disabled docker we'll see what happens. Unfortunately nothing is jumping out at me in the syslog before I pressed the power button (server was unresponsive). unraid-diagnostics-20230903-1158.zip
-
Pretty sure those are all from being connected via IPMI/AMT remote desktop, for some reason that connection seems to timeout/reconnect periodically which causes all it's redirected devices to reconnect. I'm not normally connected with that when things are running smoothly so I can't say for sure if that's something that happens in 6.11, but I can fire that up for a while and see. I don't recall it being normal, except when the server's in it's "unresponsive" state. --edit Yeah, I see the same thing with 6.11.5 if I leave IPMI/AMT remote desktop connected.
-
I saw 6.12.4 came out in the last day or so with a lot of networking fixes for people with "similar" (server unresponsive to some degree), so I gave it a shot today. Unfortunately within about an hour I had the same issue, the server became basically totally unresponsive, the web UI wouldn't respond, I couldn't log in to the shell either via ssh or local (would get a timeout trying to log in). I was unable to get diagnostics with the system in that state, I tried logging in to the console before the issue would occur and staying logged in which did allow me to run the diagnostics command, but after it hadn't returned for several hours I had to reboot the system and revert back to 6.11.5. I have a couple of diagnostics zips, unfortunately they are both from just shortly after a reboot after the system went unresponsive. I do have a syslog from a syslog server, attached below. Unfortunately as noted I reverted back to 6.11.5 because I won't have time to babysit/debug this weekend, but any help and suggestions for me to try next week when I have more time would be great. unraid-diagnostics-20230901-1525.zip unraid-diagnostics-20230901-1053.zip syslog_2023-09-01.txt
-
I'll give it a shot. I know a bunch of those nginx errors were from a browser tab I didn't log back into after rebooting.
-
Thanks for the clarification, unfortunately I'm still having issues, which I am documenting in my prior thread to not derail this one:
-
Unfortunately 6.12.3 doesn't appear to have resolved my issues though I've managed to capture better data this time. Firstly diagnostics is from restarting the server last night, it's still running today but I'm starting to see errors in the logs. Perhaps more interesting, since I'd failed to capture diagnostics in the past due to the maching being completely unresponsive to external user input (web gui or local shell), I setup a an external syslog server and configured my unraid box to log to that, so syslog.zip contains that. To enumerate a bit what's in there: 6.12.3 was installed and the reboot at Jul 16 09:04:52. Sometime around Jul 16 17:32:48 is where I returned to find the system unresponsive again and had to forcefully power off by turning off the power supply (after maybe an hour waiting for a "graceful" shutdown from the power button. At that reboot, I (due to misunderstanding) disabled all my Docker containers using fixed IP addresses (I don't have custom macs), but then ran into trouble and after finding out that shouldn't be an issue reset lms to it's prior fixed IP. That was sometime later in the evening (before July 16 22:00) What stand out to me, other than the ata kernel errors which I have not seen before, is a large number of "unRAID daemon warning php-fpm[7216] [WARNING] [pool www] child 4069 exited on signal 9 (SIGKILL) after 17.999238 seconds from start" errors in the log from when the system was unresponsive, and which have resumed again overnight. At the moment the server is still responsive if there is anything I can try to either resolve the issue or additionally debug it. Thanks unraid-diagnostics-20230717-0627.zipsyslog.zip
-
Interesting, so what was it that we can't do with static IP addesses? I really thought this might be my issue with my server going unresponsive with 6.12 after updating.
-
I'd been having some major trouble with 6.12 (and slightly less after going back to 6.11), which I think seeing this thread is due to this. First, I want to make sure I'm understanding correctly, with 6.12, we can't use macvlan (I switched to ipvlan), and because of that we can't setup dockers with br0 and a custom/fixed IP? So assuming that is correct, then I have an issue/question. I had been using custom IPs on a couple dockers, so I started reconfiguring my containers back to bridge and ran into an issue. I have Plex and Jriver Media Center and both want port 1900 for UPnP. Is there a way to get both working? Either way, hoping this resolves my issues.
-
Have you been brave enough to try 6.12.1 or .2?
-
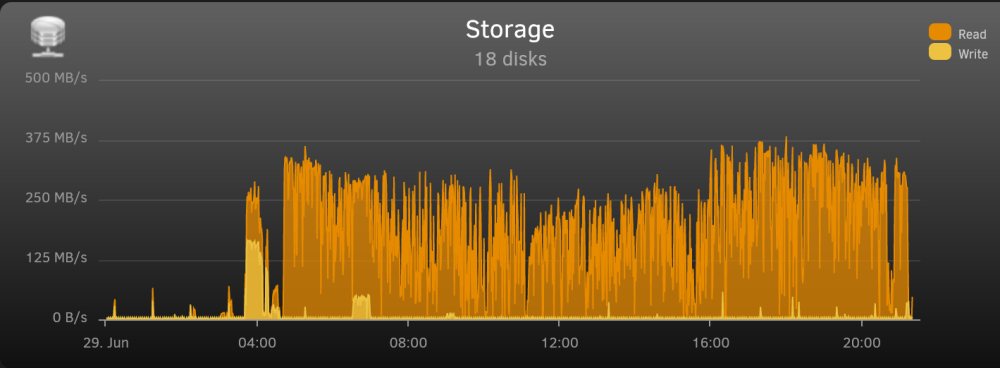
Is anyone else seeing really high, essentially constant disk reads with Crashplan? I'm not sure how long this has been going on but I've noticed in the last few days, there's a near constant "incredible" amount of disk reads going on on my server. I installed itop and narrowed it down to crashplan (by tracing the PID with ps). The crashplan process is almost always at the top of the iotop disk read list. And iotop -a show a ton of accumulated reads several GB after only a couple minutes: I've logged into the web GUI and it says all backups have been completed for several hours, and I haven't written to any of the backup sets in the mean time. I've confirmed that stopping the Crashplan container stops the excessive reads. Has anyone else seen anything like this? Or have any ideas. I have 3 backup sets but they only account for about 2TB and most of it rarely changes.


-
Update, happened again around 11CDT this morning. I let the diagnostics run for a couple hours but had to forcibly restart and revert back to 6.11.5 to have something working til I have more time to investigate.
-
Hey, I upgraded to 6.12 over the weekend (Saturday morning I believe), and initially everything looked OK, however I found Saturday night that the server became nearly unresponsive, shares were largely inaccessible, web GUI was inaccessible, and most concerning, even trying to log in locally via the console would result in a login timeout after 60 seconds. I forced a reboot and on restart noticed that I had docker set to macvlan, so I stopped the service, changed it to ipvlan, and restarted Docker (but perhaps notably didn't restart the server). This morning I found the server in a similar state. This time as I was forcing the power down, I managed to allow it to capture diagnostics (which took well over an hour I'd guess). The only thing suspicious I notice in the logs is: Jun 19 03:04:14 unRAID winbindd[30865]: [2023/06/19 03:04:14.631987, 0] ../../source3/winbindd/winbindd_samr.c:71(open_internal_samr_conn) Jun 19 03:04:14 unRAID winbindd[30865]: open_internal_samr_conn: Could not connect to samr pipe: NT_STATUS_CONNECTION_DISCONNECTED[/CODE] Fix Common Problems shows no errors, just some warnings for dockers that I haven't updated yet (seems they were updated since yesterday) and I haven't had a chance yet, and I don't have UD+ installed but I don't use that. I have Docker host access to custom networks disabled. Is there something else I need to look at/fix? Dare I hope it was the fact that I didn't restart the server after fixing the macvlan->ipvlan thing that caused the problem a second time? Thanks unraid-diagnostics-20230619-0722.zip
-
I don't think so. My unraid box has probably the oldest board I have.
-
OK, now I'm kinda stuck, I can't get it to boot UEFI (tried using RUFUS, set to FreeDOS) and it just won't boot off that. And if I boot into DOS I get the "PAL cannot be initialized" from sas2flsh.exe which according to this, says you need to use UEFI. I also tried formatting the stick GPT/Fat32 and still no luck getting it to boot.
-
Stupid questions alert! OK not stupid, but definitely somewhat uninformed. Long story short, I've got 2 8-port LSI cards in my server, and in looking into something else, I checked the firmware version on my cards (something I should have done a long time ago). I found two things, first, one of the card appears to have really old firmware, and second is that both cards are in IR mode. here's sas2flash -listall Num Ctlr FW Ver NVDATA x86-BIOS PCI Addr ---------------------------------------------------------------------------- 0 SAS2008(B2) 11.05.02.00 0a.03.00.1a 07.21.04.00 00:01:00:00 1 SAS2008(B2) 20.00.07.00 14.01.00.09 07.39.02.00 00:02:00:00 root@unRAID:/lsi# ./sas2flash -list LSI Corporation SAS2 Flash Utility Version 20.00.00.00 (2014.09.18) Copyright (c) 2008-2014 LSI Corporation. All rights reserved Adapter Selected is a LSI SAS: SAS2008(B2) Controller Number : 0 Controller : SAS2008(B2) PCI Address : 00:01:00:00 SAS Address : 500605b-0-0557-29d0 NVDATA Version (Default) : 0a.03.00.1a NVDATA Version (Persistent) : 0a.03.00.1a Firmware Product ID : 0x2713 (IR) Firmware Version : 11.05.02.00 NVDATA Vendor : LSI NVDATA Product ID : SGX-SAS6-INT-Z BIOS Version : 07.21.04.00 UEFI BSD Version : 07.18.02.11 FCODE Version : 01.00.60.00 Board Name : SGX-SAS6-INT-Z Board Assembly : H3-25104-03A Board Tracer Number : SP23819718 Finished Processing Commands Successfully. Exiting SAS2Flash. root@unRAID:/lsi# ./sas2flash -c 1 -list LSI Corporation SAS2 Flash Utility Version 20.00.00.00 (2014.09.18) Copyright (c) 2008-2014 LSI Corporation. All rights reserved Adapter Selected is a LSI SAS: SAS2008(B2) Controller Number : 1 Controller : SAS2008(B2) PCI Address : 00:02:00:00 SAS Address : 500605b-0-0810-c2d0 NVDATA Version (Default) : 14.01.00.09 NVDATA Version (Persistent) : 14.01.00.09 Firmware Product ID : 0x2713 (IR) Firmware Version : 20.00.07.00 NVDATA Vendor : LSI NVDATA Product ID : SAS9211-8i BIOS Version : 07.39.02.00 UEFI BSD Version : 07.02.04.00 FCODE Version : N/A Board Name : SAS9211-8i Board Assembly : H3-25250-02H Board Tracer Number : SP43428856 Finished Processing Commands Successfully. Exiting SAS2Flash. Controller 0 is the main one in question, with the 11.0 firmware (current seems to be 20.0). Both cards are 9211-8i's. I guess mainly what I'm curious about is, I guess obviously I should update the firmware, but should I flash them to IT mode given they're both in IR mode? Second, I was reading the other LSI flashing thread, and it suggests not cross flashing from unRAID, does that still apply? Does IR->IT mode count as crossflashing (or is that more referring to something like Dell->LSI)? And if I shouldn't do this from inside unRAID, I found a thread about using the UEFI flasher, is that the way to go? Only reason I hesitate is I've been running these cards for several years and don't want to unnecessarily break things. Thanks
-
Looks like that's what's happening in my case above (not sure why it worked for a time): Uncaught Error: Highcharts error #16: www.highcharts.com/errors/16/ f highcharts.src.js:220 E highcharts.src.js:1660 f highcharts.src.js:242 <anonymous> highcharts.src.js:20 <anonymous> highcharts.src.js:24 highcharts.src.js:220:34 f highcharts.src.js:220 E highcharts.src.js:1660 f highcharts.src.js:242 <anonymous> highcharts.src.js:20 <anonymous> highcharts.src.js:24
-
And, now it shows, so nevermind... Hey, I'm having a problem similar to a couple folks from a few pages back. When I bring up the diskspeed page, I see no graph of the previous results: I get the same thing if I click on any of the controllers. Interestingly, if I click on any of the drives, I do see the graph of all the previous results. And when I just benchmarked everything this morning, when it completed I was take the page with the graph of all the results. Anything I should try, or info that might help resolve this?