





mikeyosm
Members
-
Joined
-
Last visited
Everything posted by mikeyosm
-
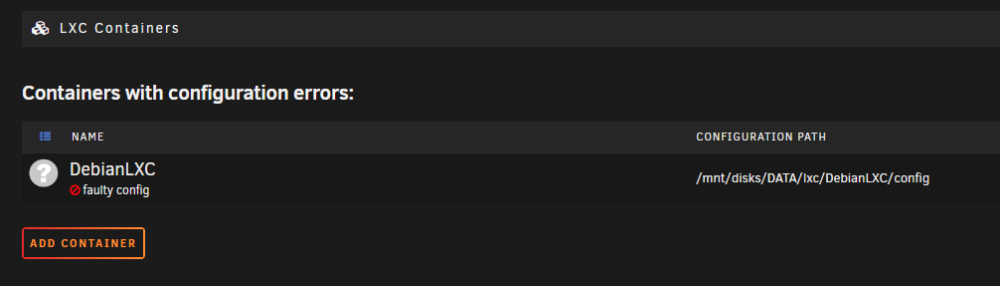
Getting an error after editing config to allow nesting # Template used to create this container: /usr/share/lxc/templates/lxc-download # Parameters passed to the template: --dist debian --release bullseye --arch amd64 # Template script checksum (SHA-1): 78b012f582aaa2d12f0c70cc47e910e9ad9be619 # For additional config options, please look at lxc.container.conf(5) # Uncomment the following line to support nesting containers: lxc.include = /usr/share/lxc/config/nesting.conf # (Be aware this has security implications) # Distribution configuration lxc.include = /usr/share/lxc/config/common.conf lxc.arch = linux64 # Container specific configuration lxc.rootfs.path = dir:/mnt/disks/DATA/lxc/DebianLXC/rootfs lxc.uts.name = DebianLXC # Network configuration lxc.net.0.type = veth lxc.net.0.flags = up lxc.net.0.link = br0 lxc.net.0.name = eth0 lxc.net.0.hwaddr=52:54:00:99:D2:F0 lxc.start.auto=0 ~ Reason for allowing nesting, trying to install snap/LXD in debian but keep getting - error: system does not fully support snapd: cannot mount squashfs image using "squashfs": mount: Read somehwere I need to enable nesting and allow FUSE. Not sure what all this means to be honest. Any ideas?
-
How did you get on with this, all working?
-
For anyone that wants to give this a try, here are the docker instructions - https://ravada.readthedocs.io/en/latest/docs/INSTALLfromDockers.html I managed to get the front/back/mysql containers to run but the WEB UI for RAVADA does not pass the admin login and eventually times out. I suspect there's some post config required to get this to work under UNRAID.
-
Since the vmware/broadcom announcement, I have been looking at alternatives to Horizon 8 for my VDI needs. Currently I have numerous Windows/Linux VMs streamed across my household and thought about using UNRAID/KVM to achieve a similar set up. At which point, I stumbled across a company and some software called Ravada. https://ravada.upc.edu/index.html It uses KVM and acts a VDI broker with the ability to share USB devices too! Before I jump right in, has anyone seen this before and have some experience with it? My plan is to deploy it as a docker container and create a pool of Windows 11 VMs.
-
Can you please advise what software I would need on my Windows 11 PC to be able to get this to work? Thanks
-
Is it possible to use this plugin to 'share' a webcam connected to my desktop PC with a VM running on UNRAID?
-
UPDATE - I got it working!
-
UPDATE - I have narrowed down the freeze/lock-up to only happening when a VM is powered on. My first test was to just leave a bunch of docker containers running and nothing else, the system stayed up for 24hrs+. The second test was to leave a VM powered on and wait until the system crashes. Approximately 1-2hrs later, the host froze. Anything I can do to log the VM/libvirt usage and work out what's causing the crash?
-
Force scan is a workaround but sometimes when I reboot the unraid host, the temps are not showing on the dashboard and I have to force scan each time, very annoying.
-
--RESOLVED Turned out to be a bad VM XML config. Hello I have just installed and set up my 6.12.6 UNRAID server from scratch, created 2 VMs and some dockers and everything seemed to be working well. That is until I leave the server idling for a few hours. At completely random intervals, the UNRAID web ui and display console become unresponsive suggesting the host has crashed. I am not able to ping the server either so the only option I have at this point is to hard reset the host. I have disabled global c-states in the BIOS (intel Z490 mobo) and run a memtest, no issues there. To rule out my hardware, I booted in to windows and ran some stability/stress testing tools on the mem and cpu for about an hour, no problems reported. Please can someone take a look at the logs and help me diagnose the problem? Thank you. diagnostics-20240103-0851.zip syslog-previous-unraid-crash
-
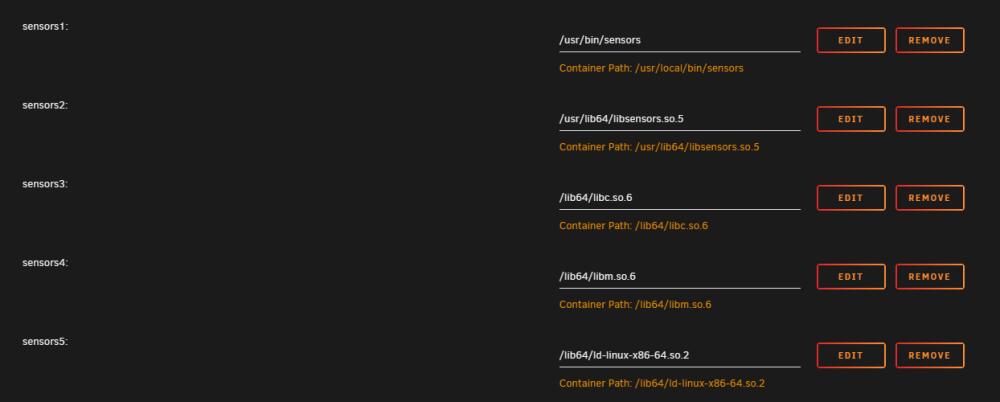
Thanks for the docker, I just started messing about with Zabbix for monitoring all of my homelab, really like it. Lots of nice stats that I can import as graphs as you can see from the pic below... One thing that is missing is the output from sensors (lmsensors) from the UNRAID host. Is it possible to configure the docker to grab sensors output? I have a USB corsair PSU and temperatures that I would like to add to Zabbix. Thank you.

-
Any chance we can get the Mellanox temperature in to the main UNRAID dashboard instead of having to go to the plugin each time?
-
yeah i had to disable power draw to remove the fan from the dash. Maybe you could change it so disabling fan removes the label?
-
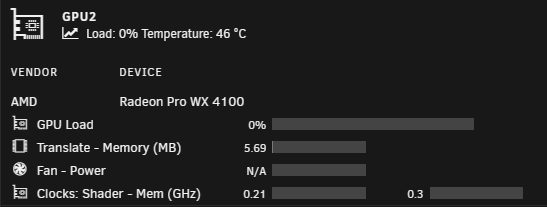
@SimonF Disabling the fan/power for nvidia/amd in settings does not remove the fan stat from the dashboard.

-
No, not on the Z490D4U-2l2T motherboard.
-
on the latest bmc and set all fans to auto (Default) in BMC fan settings. I only have one pwm fan connected to header (fan 7).
-
here you go. fan.cfg ipmi.cfg ipmi.config ipmi-sensors.config
-
~# ipmi-raw 3a 02 Invalid number of hex bytes
-
Yes I do have PWM fan. ~# ipmi-raw 00 3a 02 rcvd: 02 C1
-
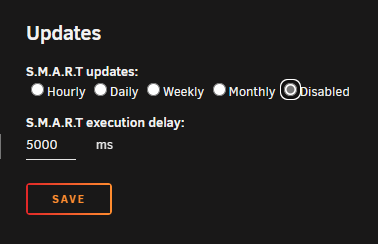
Apologies if this has been mentione before or addressed already, however, my array SSD temperature is not show in the dashboard whenever i restart my UNRAID host. I have to force scan all each time after a reboot for the temperature to be detected. It only does this for the single SSD that I have connected and not the NVME drive. Any ideas? Log attached. After reboot - After 'force scan all' Also - update is always set to disabled after reboot. I have to set to hourly each time. diagnostics-20231208-1459.zip


-
@SimonF any ideas on what could be wrong, need some more logs from me?
-
Awesome, thanks for implementing this so quickly!
-
1.4 works
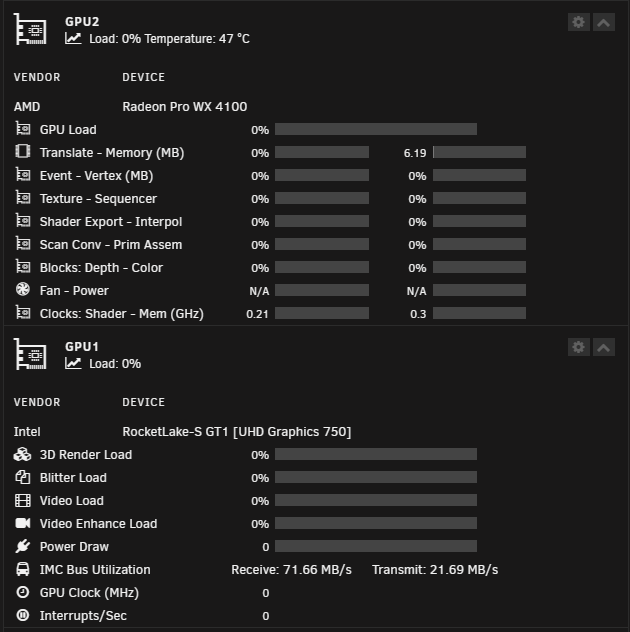
-
I ran that command, the terminal window showed information as per the screenshot but then clears itself. Also00 running timout tihe longer values produces output..... ~# timeout -k 2 2 intel_gpu_top -J -s 250 -d pci:slot=0000:00:02.0 [ { "period": { "duration": 3.415733, "unit": "ms" }, "frequency": { "requested": 0.000000, "actual": 0.000000, "unit": "MHz" }, "interrupts": { "count": 0.000000, "unit": "irq/s" }, "rc6": { "value": 99.783736, "unit": "%" }, "imc-bandwidth": { "reads": 2223.097022, "writes": 428.065719, "unit": "MiB/s" }, "engines": { "Render/3D": { "busy": 0.000000, "sema": 0.000000, "wait": 0.000000, "unit": "%" }, "Blitter": { "busy": 0.000000, "sema": 0.000000, "wait": 0.000000, "unit": "%" }, "Video": { "busy": 0.000000, "sema": 0.000000, "wait": 0.000000, "unit": "%" }, "VideoEnhance": { "busy": 0.000000, "sema": 0.000000, "wait": 0.000000, "unit": "%" } }, "clients": { } } { "period": { "duration": 253.163464, "unit": "ms" }, "frequency": { "requested": 0.000000, "actual": 0.000000, "unit": "MHz" }, "interrupts": { "count": 0.000000, "unit": "irq/s" }, "rc6": { "value": 100.000000, "unit": "%" }, "imc-bandwidth": { "reads": 22.638583, "writes": 4.282721, "unit": "MiB/s" }, "engines": { "Render/3D": { "busy": 0.000000, "sema": 0.000000, "wait": 0.000000, "unit": "%" }, "Blitter": { "busy": 0.000000, "sema": 0.000000, "wait": 0.000000, "unit": "%" }, "Video": { "busy": 0.000000, "sema": 0.000000, "wait": 0.000000, "unit": "%" }, "VideoEnhance": { "busy": 0.000000, "sema": 0.000000, "wait": 0.000000, "unit": "%" } }, "clients": { } } { "period": { "duration": 263.521650, "unit": "ms" }, "frequency": { "requested": 0.000000, "actual": 0.000000, "unit": "MHz" }, "interrupts": { "count": 0.000000, "unit": "irq/s" }, "rc6": { "value": 100.000000, "unit": "%" }, "imc-bandwidth": { "reads": 126.327066, "writes": 41.667721, "unit": "MiB/s" }, "engines": { "Render/3D": { "busy": 0.000000, "sema": 0.000000, "wait": 0.000000, "unit": "%" }, "Blitter": { "busy": 0.000000, "sema": 0.000000, "wait": 0.000000, "unit": "%" }, "Video": { "busy": 0.000000, "sema": 0.000000, "wait": 0.000000, "unit": "%" }, "VideoEnhance": { "busy": 0.000000, "sema": 0.000000, "wait": 0.000000, "unit": "%" } }, "clients": { } } { "period": { "duration": 257.942399, "unit": "ms" }, "frequency": { "requested": 0.000000, "actual": 0.000000, "unit": "MHz" }, "interrupts": { "count": 0.000000, "unit": "irq/s" }, "rc6": { "value": 99.999289, "unit": "%" }, "imc-bandwidth": { "reads": 169.002916, "writes": 34.752376, "unit": "MiB/s" }, "engines": { "Render/3D": { "busy": 0.000000, "sema": 0.000000, "wait": 0.000000, "unit": "%" }, "Blitter": { "busy": 0.000000, "sema": 0.000000, "wait": 0.000000, "unit": "%" }, "Video": { "busy": 0.000000, "sema": 0.000000, "wait": 0.000000, "unit": "%" }, "VideoEnhance": { "busy": 0.000000, "sema": 0.000000, "wait": 0.000000, "unit": "%" } }, "clients": { }

-
Correct ~# timeout -k .500 .600 intel_gpu_top -J -s 250 -d pci:slot=0000:00:02.0 ~# intel_gpu_top -J -s 250 -d pci:slot=0000:00:02.0 [ { "period": { "duration": 3.895288, "unit": "ms"





