


WannabeMKII
Members
-
Joined
Everything posted by WannabeMKII
-
Just a quick update from my side, but totally out of the blue, the graphs have all updated? A few dockers have updated over the last few days and I hadn't checked before now, but great to see all the data populating!
-
Ouch, that sounds complicated. I'm hoping there's a more 'straightforward' solution...
-
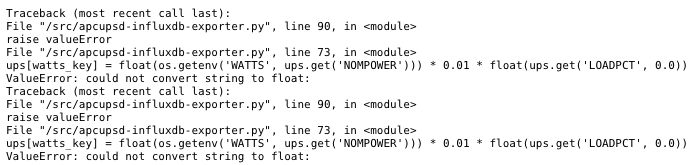
The old one I did, but this one I don't. If I add it, it now lets the docker start, but the charts don't update and I still see this in the logs;

-
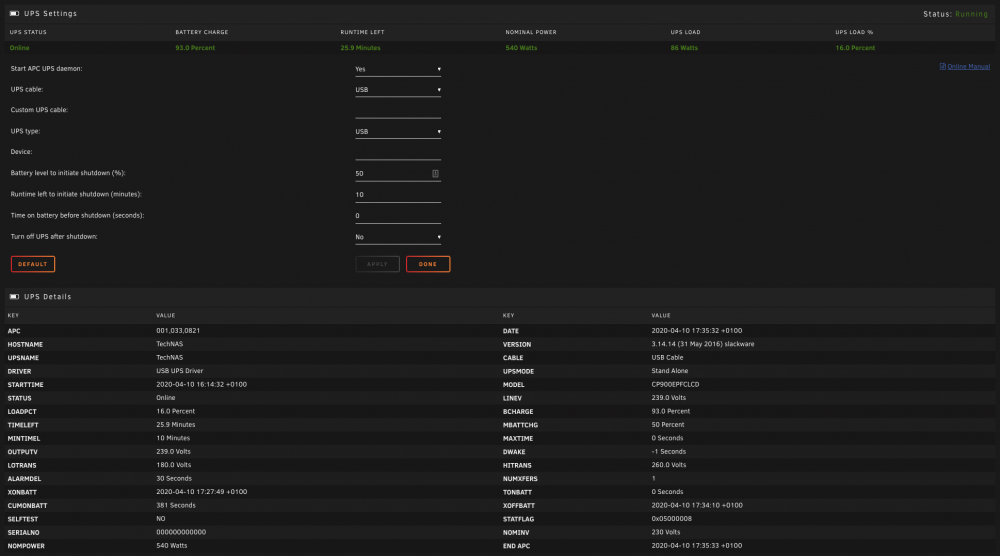
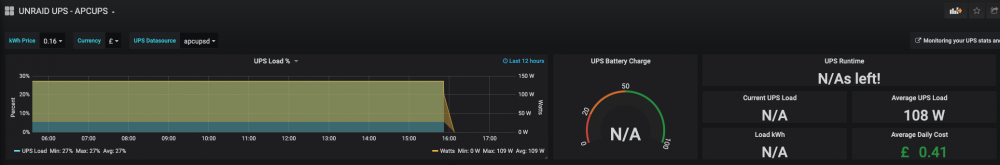
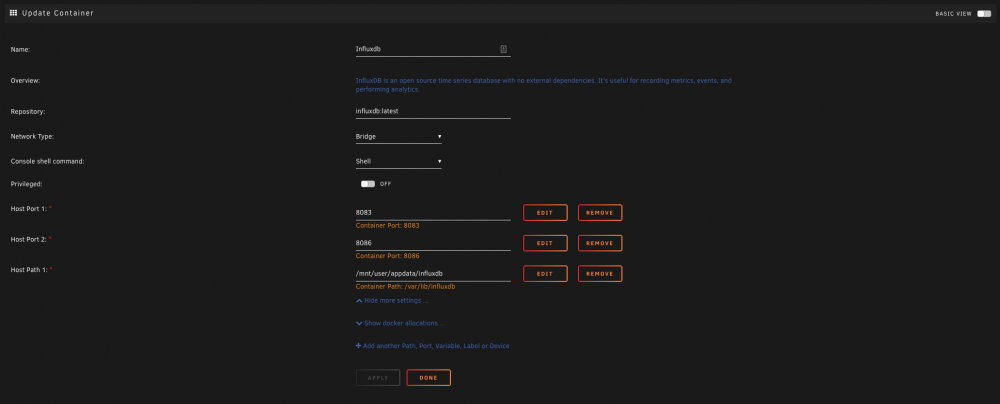
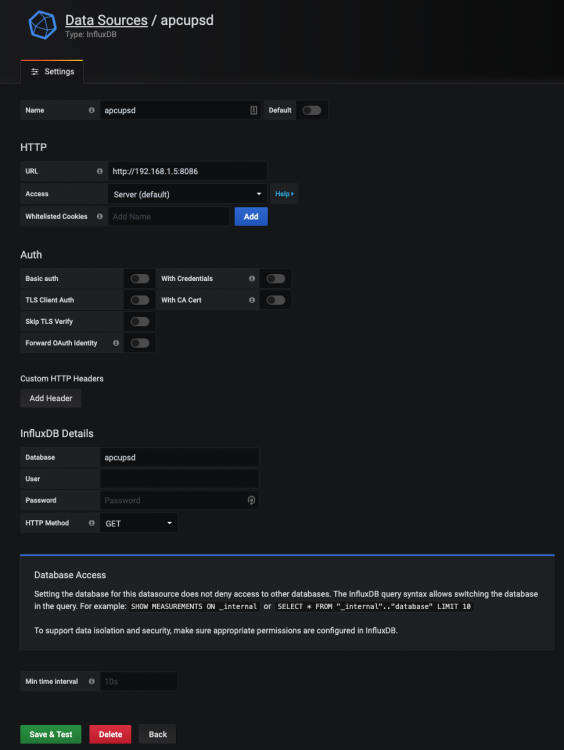
I've just replaced my UPS and the new UPS provides information that the old one didn't so Grafana should be more accurate. For example, nompower, loadpct, timeleft etc. However, something isn't quite right, as Grafana is actually reporting less and I'm thinking it's something to do with apcupsd still reporting the old information from the old UPS and not updating Influx with the new information? I've added a number of screenshots from what apcupsd shows, Grafana, Influx set up, Influx data sources and if I remove the nompower from the apcupsd-influx-exporter (this UPS reports nompower, the old on didn't), the log file. Can anyone assist please? Many thanks and stay safe!
-
Quick update as I've managed to get it back up and running. Basically, I removed the container along with the appdata folder and started again. On starting again from scratch, everything is now back up and running! Many thanks for the help offered, appreciated!
-
Thanks for coming back. I've just deleted one of the SSL certificates and tried to re-create it and it came back with an 'internal error'? What else can I try?
-
Alternatively, is there a way I can create a new one?
-
Stupid question, but how would I test I can read it? Krusader is reporting the file as 0 bytes in size? Also, if I go into the webgui and try to edit one of the hosts and hit save, it comes back with a 'Internal Error'? Does any of that help?
-
I appear to have an issue with nzbhydra2 in that the nzbhydra.mv file grows out of control. I've posted across on Reddit too, but hoping someone here might be about to help? Here's the problem I'm having - Click me Any ideas?
-
I had an issue with another Docker image, so carried out a restore and I'm now seeing the following error in the logs; [nginx] starting... nginx: [emerg] PEM_read_bio_X509_AUX("/etc/letsencrypt/live/npm-1/fullchain.pem") failed (SSL: error:0909006C:PEM routines:get_name:no start line:Expecting: TRUSTED CERTIFICATE) Any ideas?
-
Sorry, beginner question, but how do I verify it? Ignore this - I started again from scratch and all is now working fine.
-
I can't even delete and create new keys?
-
I needed to carry out an AppData restore last night, but since then, I'm seeing the following in the nginx logs; [nginx] starting... nginx: [emerg] PEM_read_bio_X509_AUX("/etc/letsencrypt/live/npm-22/fullchain.pem") failed (SSL: error:********:PEM routines:CRYPTO_internal:no start line:Expecting: TRUSTED CERTIFICATE) Any ideas what's caused this and how to resolve it, as I can't access remotely at the moment? Thanks.
-
Will do. Thanks for your help on this, MUCH appreciated!!!
-
Ah ha, that's got it! Superb! What was causing the issue? I'm guessing permissions, but how or why? Will I get it again if I add other scripts?
-
I'm running them in terminal from the menu bar of unraid.
-
Sorry, I missed that minor detail. Still no scripts. It appears the deletesamples didn't work correctly as there's an error message too?
-
As requested; root@*****:~# wget https://raw.githubusercontent.com/nzbget/nzbget/develop/scripts/EMail.py -O /mnt/user/appdata/nzbget/scripts/EMail.py --2019-05-06 19:05:12-- https://raw.githubusercontent.com/nzbget/nzbget/develop/scripts/EMail.py Resolving raw.githubusercontent.com (raw.githubusercontent.com)... 151.101.0.133, 151.101.64.133, 151.101.128.133, ... Connecting to raw.githubusercontent.com (raw.githubusercontent.com)|151.101.0.133|:443... connected. HTTP request sent, awaiting response... 200 OK Length: 10475 (10K) [text/plain] Saving to: ‘’ 100%[==============================================>] 10.23K --.-KB/s in 0s 2019-05-06 19:05:13 (169 MB/s) - ‘’ saved [10475/10475] --2019-05-06 19:05:13-- http:///mnt/user/a%EF%BB%BFppdata/nzbg%EF%BB%BFet/scripts/%EF%BB%BFEMail.py Resolving ()... failed: Device or resource busy. wget: unable to resolve host address ‘’ FINISHED --2019-05-06 19:05:14-- Total wall clock time: 1.2s Downloaded: 1 files, 10K in 0s (169 MB/s) root@*****:~# wget https://raw.githubusercontent.com/clinton-hall/GetScripts/master/DeleteSamples.py -O /mnt/user/appdata/nzbget/scripts/DeleteSamples.py /mnt/user/appdata/nzbget/scripts/DeleteSamples.py: No such file or directory
-
As requested; root@*****:~# chown nobody:users -R /mnt/user/appdata/nzbget/scripts/ root@*****:~# ls -la /mnt/user/appdata/nzbget/scripts/ total 420 drwxrwxrwx 1 nobody users 123 May 6 17:51 ./ drwxrwxrwx 1 nobody users 76 May 6 17:51 ../ -rw-rwxrw-+ 1 nobody users 6148 May 6 17:51 .DS_Store* -rwxrwxrwx 1 nobody users 78620 Sep 1 2017 Completion.py* -rwxrwxrwx+ 1 nobody users 95770 May 6 17:28 DeleteSamples.py* -rwxrwxrwx+ 1 nobody users 127057 May 6 17:31 EMail.py* drwxrwxrwx 1 nobody users 4096 Oct 29 2017 Subliminal/ -rwxrwxrwx 1 nobody users 90119 Oct 29 2017 Subliminal.py* Still not showing up in nzbget and I've restarted the docker just in case...?
-
Here you go; root@*****:~# ls -la /mnt/user/appdata/nzbget/scripts/ total 420 drwxrwxrwx 1 nobody users 123 May 6 17:51 ./ drwxrwxrwx 1 nobody users 76 May 6 17:51 ../ -rw-rwxrw-+ 1 chris users 6148 May 6 17:51 .DS_Store* -rwxrwxrwx 1 nobody users 78620 Sep 1 2017 Completion.py* -rwxrwxrwx+ 1 chris users 95770 May 6 17:28 DeleteSamples.py* -rwxrwxrwx+ 1 chris users 127057 May 6 17:31 EMail.py* drwxrwxrwx 1 nobody users 4096 Oct 29 2017 Subliminal/ -rwxrwxrwx 1 nobody users 90119 Oct 29 2017 Subliminal.py* So the two that don't work appear to be owned by me rather than 'nobody'?
-
Hmm, I've just run that and also checked in Krusader and the permissions don't seem to update? Is there another way of updating the permissions or what's blocking the permission change?
-
Ah ha perfect, that's bought 'subliminal' and 'completion' up, but not 'email' or 'deletesamples? Why would that happen?
-
Perfect, thanks! Archive.zip
-
I've just run that too; root@*****:~# docker exec -it nzbget chmod +x /config/scripts/*.py chmod: cannot access '/config/scripts/*.py': No such file or directory What is strange is they've been working fine for a good couple of years, then they just dropped off?
-
Thanks for the response; root@*****:~# docker exec -it nzbget ls -la /config/scripts/ total 372 drwxr-xr-x 1 abc abc 106 May 4 11:50 . drwxrwxrwx 1 abc abc 76 Feb 20 2018 .. -rwxrwxrwx 1 abc abc 78620 Sep 1 2017 Completion.py -rw-rw-rw- 1 abc abc 65536 Feb 20 2018 DeleteSamples.py -rw-rwxr--+ 1 abc abc 127037 May 4 11:50 EMail.py drwxr-xr-x 1 abc abc 4096 Oct 29 2017 Subliminal -rw-rw-rw- 1 abc abc 90119 Oct 29 2017 Subliminal.py


