


guy2545
Members
-
Joined
-
Last visited
-
Pretty much out of ideas. What is the output of ls -l /mnt/user/appdata/plex/Library/ If it is not nobody:users, then maybe try running: chown -R nobody:users /mnt/user/appdata/plex/* This will step into each sub folder and set the permission to nobody:users. Shouldn't blow anything up, but can't make any promises Also, found this reddit thread that one user seems to indicate the preferences.xml file was empty. They were able to recover it from a backup and got the server up again.
-
This is how I would do it. Not sure if it is the right way thought. chown nobody:users /mnt/user/appdata/plex/Library/Application Support/Plex Media Server/* That will set the owner to "nobody" and the group to "users", which is the same as mine currently:
-
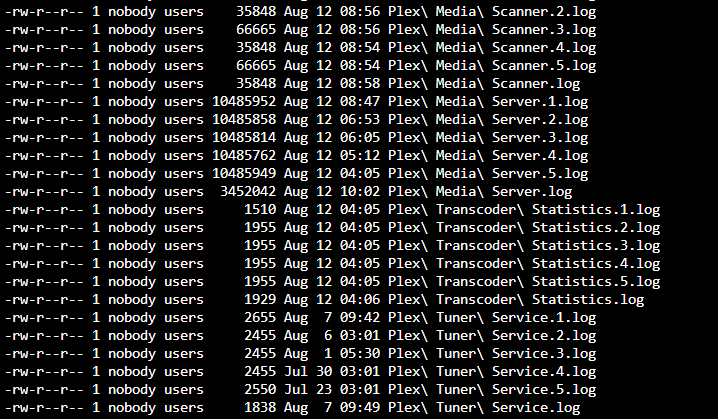
My structure looks just like that, however I do not have the "Startup Crash.log". I'm guessing its a permissions issue and Plex can't write to the logging folder.
-
I'm out of ideas, since the docker is starting up correctly. Just a purely random thought, but I assume you are on the same 10.0.0.0/24 subnet for whatever you are trying to connect to plex on? Outside of that, I would start looking at the plex specific logs. Mine are located here and I assume yours would be similar? /mnt/user/appdata/plex/Library/Application Support/Plex Media Server/Logs Specifically within there, probably look at "Plex Media Servier.log". I assume that the start of that log will/should give some indication of what is going on. If it is any help, this is the start of mine. (The [XXXX] is a hex code that I don't know if is server specific, and the [some token blah blah] maybe server specific). After this it jump immediately into scanning the library for any changes.
-
Not sure if this is the best spot, but here it is. Had some issues with some *rarr dockers where the database was corrupted. The web interface worked just fine, so I was not aware of any issues at first. I got the first issue right before my CA appdata backup ran, and I was able to restore the backup DB. Also, discovered that I miss configured where it only stored one week of backups. Second time it happened, I had multiple backups I was able to recover from. This lead me to looking for some sort of docker based log analysis tool that can send out either a Unraid UI notification if key words/phrases are found or sending something to pushover/whatever. I already have the syslog server running, but not really finding anything outside of Graylog in the app store. Any recommendations, or advise? I've ran the free version of Splunk before in a VM, and while it did work great, it was a little overkill. I was looking to see if there was another solution outside of a VM? Thanks!
-
Are you able to connect to the Plex web interface directly from the IP address? Either: ip_for_plex:32400 or ip_for_unraid:32400 depending on how you have the docker container setup.
-
Thank you to the wonderful team on the Discord server this has been sorted out! Fix listed below: /boot/config/ident.cfg look for the line "USE_SSL="false" and change it to USE_SSL="no"
-
Installed the my servers plugin this afternoon, with no issues. Saw the "My Servers Error, Graphql is offline", and did a quick forum search, which indicated running: unraid-api restart was the next thing to do. It hangs with the "Value 'false' is not auto/no/yes.". Okay easy enough, with everything computers I apply the reboot method of resolving issues. However, upon reboot the web GUI will not load. I'm able to SSH in, and see that nginx never started. So I start it and get the GUI back. I tried to change the SSL in the my server setting to "auto" (version 6.9.2) and made sure all plugins were updated. SSL, was already set to "auto", so change to "no", then back to "auto" to activate the "Apply" button. Click it, and it basically hangs on the fancy "I'm applying your settings" wave thingy. I give about 30 minutes, and nothing. Still waving at me. Try to run the unraid-api restart again, but it hangs at the same point. I feel I am certainly missing something, but it is late and I'm lost. Attached are some diagnostics from my reboot (I believe) when I had to manually start nginx. I have also restarted the system again, and attaching the current state of diagnositics (had to manually start nginx as well). If I boot into safe mode, can I remove the my servers plugin even though all plugins are disabled? Or is there a config file I can edit via SSH/CLI to change the "false" to "no" that unraid-api is looking for? Thanks! tower-diagnostics-20211123-2240.zip tower-diagnostics-20211123-2317.zip
-
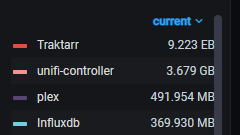
So this is interesting, apparently my Traktarr Docker is basically a super computer and is using >9EB of RAM: I don't even remember installing that much RAM and it seems to be holding the entirety of the internet in memory...
-
Changing the temp setting (apply) then changing it back worked great for me. Thanks for the great plug-in!


