


GilbN
Community Developer
-
Joined
-
Last visited
Everything posted by GilbN
-
In the terminal what does apcaccess | grep 'NOMPOWER\|LOAD' output
-
I think that is because you saved the current variables as default when saving. Are you selecting "Export for sharing externally" ?
-
Yea, it's in the name "Array Data Growth Today" and /mnt/cache is not part of the array Yea, AMD cpus can't report temps correctly on the current kernel unraid 6.8.3 is using, iirc. But on v6.9 it should work better. Better to use IPMI if your board supports that. Most consumer boards doesn't though.

-
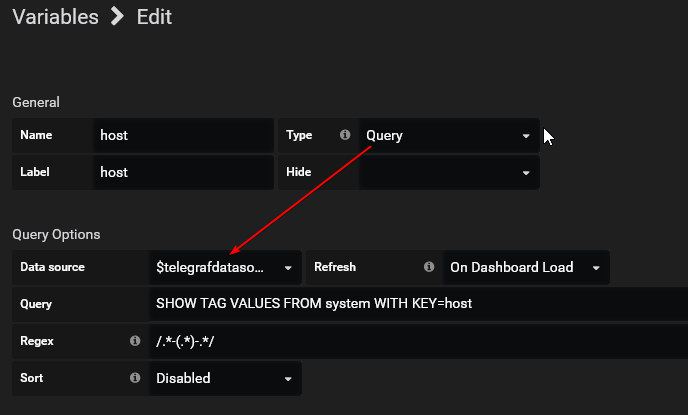
Nice! Yea regex is crazy cool.. Btw, this is what I meant when fixing the host variable. If that datasource is set to something that doesnt exits instead of the variable above, it will break it. Thats probably why it doesnt work. So by using that variable, when you set the Telegraf datasource The host variable should then work, as the HOST query runs on the correct data source.
-
That too!! lol
-
@falconexe Remember to eat.. 😁
-
You screenshot the network panel. That wouldn't show anything when copying data internally. SMB is sometimes smart enough to see that it's internal. And the disk growth panels are only displaying the array growth. It does not take in account the cache drives. Are you using an AMD cpu? I made the dashboard on an Intel system, so that's probably why it's showing wierd.
-
🤔 thought I switched "all" to last() And when I selected metric(IEC) my drives shows up as 8TB, 4TB ect not 3.75TB ect ect..hmm Edit: nope I was just blind. Switched to metric
-
Check that all panels are using a variable as datasource
-
Not there, I meant when you create the variable.
-
Think I know the host variable bug. On the datasource select the $telegrafdatasource variable. I have the same bug on mine iirc. I think my dash is set to use a datasource called Telegraf on the host variable.
-
@falconexe @FreeMan Take a look at https://grafana.com/grafana/dashboards/7233 I updated it 1 hour ago. I have switched about all panels to use regex where I can. I heading to bed now, but you should be able to recreate the variable from my dash. >A recommended better way of doing it? - Dont hardcode anything @falconexe Since you're the db expert, isn't this more effective than the 20 queries to the left? The result is the same.
-
Yeah, I stopped doing it that way. Got tired of updating it everytime.. lol
-
I dont have rootfs there and I know other users that dont get the /rootfs paths prepended. Not sure why. Yea, yours. I just downloaded the lastest, and if I try and edit the variable it doesnt display the query when you click edit on it. https://selfhosted.app/f3c10/GIwIGOSa20.mp4
-
Probably because of the hardcoded paths @falconexe uses on those panels. Falc, you should switch those to some regex. /.*user0/ will match /rootfs/mnt/user0 and /mnt/user0. And your host variable is broken. It should list the host in that drop down.
-
My telegraf smart plugin looks like this: # # Read metrics from storage devices supporting S.M.A.R.T. [[inputs.smart]] # ## Optionally specify the path to the smartctl executable # # path = "/usr/bin/smartctl" # # # ## On most platforms smartctl requires root access. # ## Setting 'use_sudo' to true will make use of sudo to run smartctl. # ## Sudo must be configured to to allow the telegraf user to run smartctl # ## with out password. # use_sudo = false # # # ## Skip checking disks in this power mode. Defaults to # ## "standby" to not wake up disks that have stoped rotating. # ## See --nocheck in the man pages for smartctl. # ## smartctl version 5.41 and 5.42 have faulty detection of # ## power mode and might require changing this value to # ## "never" depending on your disks. # # nocheck = "standby" # # # ## Gather detailed metrics for each SMART Attribute. # ## Defaults to "false" # ## attributes = true # # # ## Optionally specify devices to exclude from reporting. # # excludes = [ "/dev/pass6" ] # # # ## Optionally specify devices and device type, if unset # ## a scan (smartctl --scan) for S.M.A.R.T. devices will # ## done and all found will be included except for the # ## excluded in excludes. # # devices = [ "/dev/ada0 -d atacam" ] I only have [[inputs.smart]] and attributes = true uncommented
-
Yeah you should really run telegraf as host, as you want it to get all the host metrics
-
You can. I use it. As long as telegraf runs as host that should work. Is the deamon running on the host?
-
/bin/sh -c 'apk update && apk upgrade && apk add ipmitool && apk add smartmontools && telegraf
-
Again, great job on the dash!! I'll be checking it out later this evening 😁
-
Looking great!
-
@falconexe And option 3 sound good to me! Great work!
-
Yeah I noticed that too. I think you missed to select the datasource in the variable. Set it to the other variable where you select the database
-
You didn't see the big red warning box? 😛 I'll add a note on how to fix if you skip that step, thanks 👍🏻
-
Well all this is setup by using 3 containers. Telegraf, InfluxDB and Grafana. You can take a look here https://technicalramblings.com/blog/how-to-setup-grafana-influxdb-and-telegraf-to-monitor-your-unraid-system/ Though I'm gonna rewrite parts of that guide when I'm finished with the dashboard. But the installation and setup of the containers will be the same.


