





CriticalMach
Members
-
Joined
-
Last visited
-
First noticed this problem a few weeks ago with 6.11.0 rc4. After rebooting into rc4 a few hours went by and then I started getting email alerts that multiple drives were overheating. I came downstairs and was met with complete silence. ALL of the fans in my server case were off. I rebooted and the fans spun up upon reboot but a few hours later it happened again. I reverted to rc 3 and it did not happen again. When rc5 came out I upgraded to it to see if it would happen again and sure enough a few hours later it did. Reverted to rc3 and no issues for about a week. I upgraded to 6.11 final when it was released and the issue happened again. At that point I reverted to 6.10.3 and have been running it for the past week with zero issues. This morning I went into my bios to ensure that nothing has changed with my fan settings. My fans are set to run 100% all the time. I then upgraded to 6.11 again and a few hours later the issue repeated. I am not running a fan controller nor do I have my fans on any kind of curve, they run at 100% all the time.. I can 100% replicate the bug by upgraded to 6.11 and waiting a few hours. Diagnostics are attached. I received the overheat alert email at 18:55 Sep 29th and immediately shutdown the server. I would appreciate any help! tower-diagnostics-20220929-1855.zip
-
Same problem here. Diagnostics attached. tower-diagnostics-20220717-0129.zip
-
Same error and this fixed it for me, thanks!
-
Gotcha thanks, I saw that right after I posted and finally got it working. The tooltip was throwing me off, maybe a slight tweak in the ui to "Full path to a file that contains a list of files/directories you want ignored from being moved off the cache pool." Thanks for the help!
-
How about a way to exclude a folder from being moved? I have a usenet directory under my data share and a media directory also under data. I obviously want the mover to run on media directory but would like to be able to exclude the usenet directory.
-
Disabling DOCP is what seems to have resolved the issue.
-
I'll make that change as well. I just wanted to check here if the errors that were in my syslog right as the crash happened might point to something specifically. Thanks.
-
So I've been experiencing the hard freezes of unraid that come with having a Ryzen cpu (2700x). I've read the FAQ and made the specified changes in my bios as well as adding "/usr/local/sbin/zenstates --c6-disable" to my go file. I went about five days without a crash and then got one a day or two ago at 720pm. Here is the relevent portion of my syslog, file starts a little before 720pm but it went down at that time which is exactly when the errors start, reboot happpened at 8:33 pm. I would appreciate any help in determining if this freeze is associated to my system being ryzen or if this is something else entirely. Diagnostics are from after reboot, thanks! EDIT: Issue seems to be solved. The FAQ for Ryzen is there for a reason, follow it. Disabled c-states, idle power, and disable the DOCP memory profile and I haven't had a hard crash in a week. syslog.txt tower-diagnostics-20210714-1718.zip
-
Thanks! I'll for sure check that out. Any reason why it's just now started? I've been running Ryzen with unRaid for almost 2 years at this point and this just starting happening about 2 weeks ago.
-
I've had this happen a handful of times on the past week or two. Basically everything locks up, webui, all dockers, ssh, smb shares, everything. I can only regain access by a hard reboot. I have attached diagnostics knowing that they'll probably be useless since I had to hard reboot and theyre from after that, but I have also attached syslog from setting up the syslog server so hopefully it will be in there. The latest lockup, from what I can tell, happened sometime after 745ish am eastern time. Thanks for the help! tower-diagnostics-20210706-0912.zip syslog-192.168.1.10.log
-
Yup, already done as well.
-
Thanks for taking a look, I'll disable them all and take your advice!
-
Looking through syslog i see a lot of network interfaces entering disables and blocking state, maybe thats it? If so, what does that mean, exactly? Edit 1: In unraid network settings, br-91d2e3e16125 is assigned the subnet 172.19.0.0/16 which is my custom docker network. However now that I looked that up I'm seeing way more entries in network settings that I believe there should be. Screenshot attached. Edit 2: the wg0 interface are associate with wireguard and the wireguard peers I have setup so those are good. Thanks! tower-diagnostics-20210705-0916.zip
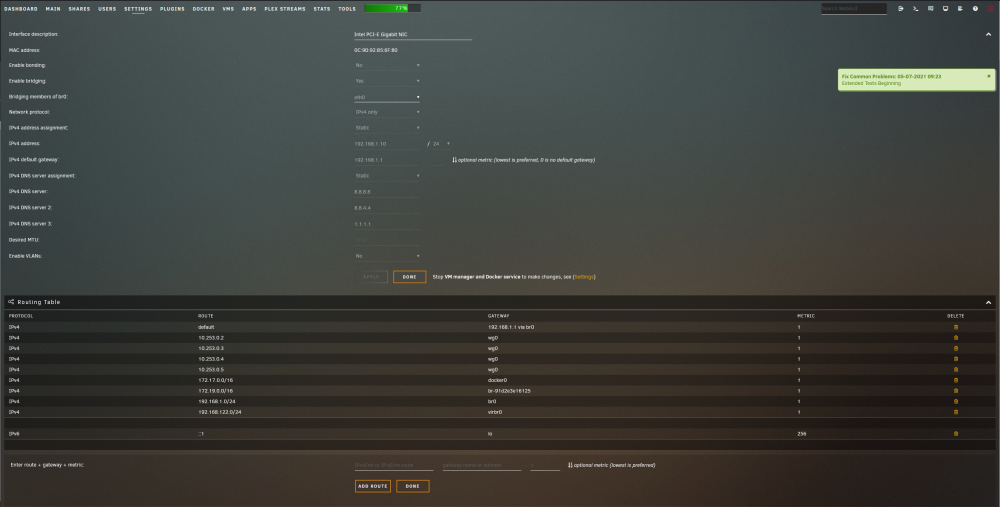
-
Server Version#: 1.23.3.4706 Player Version#: 4.57.4 Plex Media Server 5 Plex Media Server 4 Plex Media Server 3 Plex Media Server 2 Plex Media Server 1 Plex Media Server LSIO Plex Docker Log Starting with the last attachment, the plex docker log, I started getting "decoder information: 249" messages repeating several hundred times, followed by "unsupported format change", and finally "udc input failed with 1001" with a few of the unsupported format and no data written messages sprinkled in. I've attached the unraid plex docker log as well as all of my plex media server logs going back to about 1am eastern time. I do not have automatic library updates turned on. My OS is unraid 6.9.2 with the linuxserver plex docker container set to latest and I am a plexpass subscriber. I am also using an nvidia GTX 1660 with the container for hardware transcoding. My transcode directory is /tmp. I'll appreciate any help that I can get! Plex Media Server.log plex docker log.log Plex Media Server.1.log Plex Media Server.2.log Plex Media Server.3.log Plex Media Server.4.log Plex Media Server.5.log
-
A few nights ago I had the top of my server off and using an electric blower to clear out dust while the server was on and building hashes for the File Integrity plugin. While doing this I get a notification of 8 pending sectors on 2 separate 8TB shucked reds, disk 1 and 2, in the physical 3 and 4 spots on my supermicro case. I immediately go to the webui and run a quick smart test on both, both pass. I then run an extended smart test on both and they both pass. After that, a non correcting parity sync just finished with zero errors, however both drives still have 8 pending sectors. Shouldn't the parity sync have either had errors when it got to the pending sectors, or if no errors and been able to read them cleared the pending sectors? What logs would anyone need to take a look at this and let me know if they can tell what happened? I've already attached the smart reports for the drives in question. Other than the pending sectors everything else with the drives are working great. Thanks! WDC_WD80EFZX-68UW8N0_VK1DRDXY-20210523-1237 - Disk 2.txt WDC_WD80EFZX-68UW8N0_VJGMAU6X-20210523-1236 - Disk 1.txt

