





jbartlett
Community Developer
-
Joined
-
Last visited
Everything posted by jbartlett
-
That would be awesome! If you wouldn't mind, please execute this command against such a drive from a command line. It'll read the entire drive, 1 GB at a time, logging how long it took to read that GB to a file. Replace the two "sdx" with the Drive ID and email it to [email protected] along with the make & model. dd if=/dev/sdx of=/dev/null bs=1GB skip=0 iflag=direct status=progress conv=noerror 2> /mnt/user/appdata/sdx.scan
-
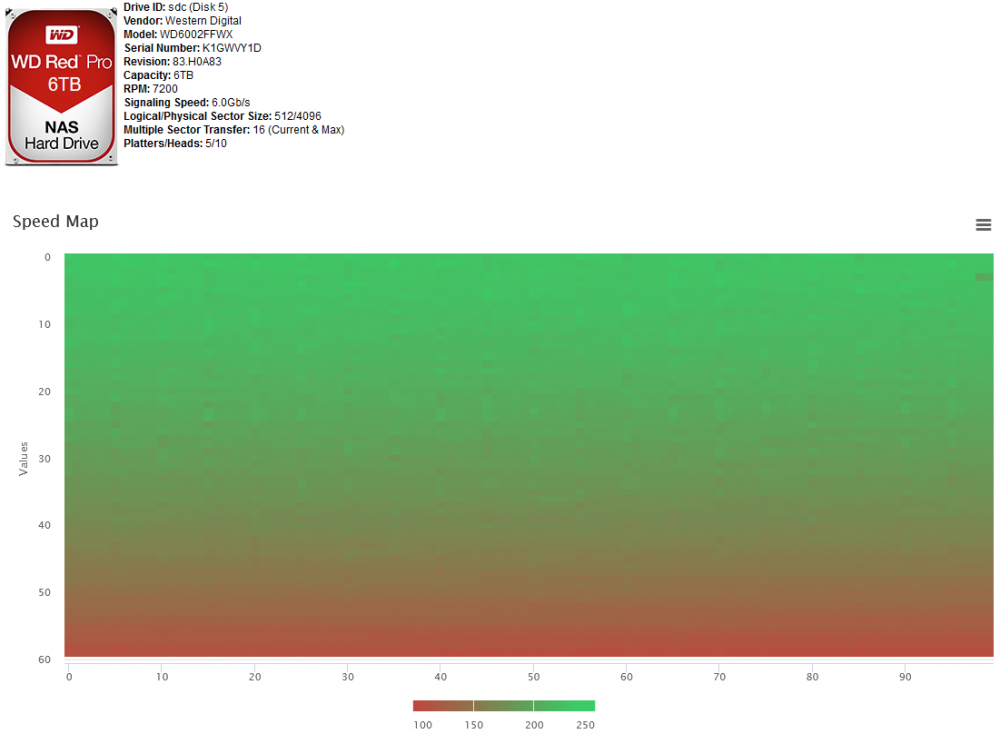
Currently in development - Drive Heat Maps. Each square = 1GB. Each line here is 100GB. Color represents MB/s read over that GB. And it looks like I'll be able to tell you what file is located where on the drive. Initial prototype. I'm currently going through my old drives trying to find one with a speed dip.
-
Thanks! Have you tried swapping out your lan cables & switches? Try connecting with only one switch between a PC & the server?
-
Ah. Legacy mode / booting by the old BIOS & boot record method. Gotcha!
-
I've no idea what "boot into legacy mode" means. We have normal mode, safe mode, and GUI mode. If I had to guess, might mean normal mode where you boot to a command prompt and no GUI.
-
Can you create a debug file by clicking on "Create Debug File" link on the bottom of the page and clicking "Create Debug file with Controller Info" and then email the file it creates in your appdata/DiskSpeed share to [email protected]. I need to take a deeper look into your system.
-
View the drive(s) in question and click on the "Manage Benchmarks" button. Hide the benchmarks you want to get rid of (or make visible the ones you want to restore).
-
First, have you updated the docker since last night? If not, please do so as I did a lot of rework around the logic that builds the history files for display. The graph data on each drive is stored independently of each other. To verify, please navigate to appdata/DiskSpeed/Instances/local/driveinfo on your NAS. You should see four directories representing these Toshiba drives hdwn180_gx2m_3942k0gjfavg_8tb hdwn180_gx2m_3992k0nqfavg_8tb hdwn180_gx2m_399fk0g3favg_8tb hdwn180_gx2m_79iuk0vufavg_8tb If that is the case, please kick off a benchmark on them (or benchmark all drives from the main menu) on version 2.7+ which will rebuild the history files and should fix your problem.
-
I was looking at the implementation comparing this lancache with the other three. While the docker file seems to be in line with the others, the overlay files do not - notably missing the files in the "hooks" directory of monolithic on github. Also the overlay directory doesn't have the subdirectories created correctly, I don't know if that impacted the docker or not.
-
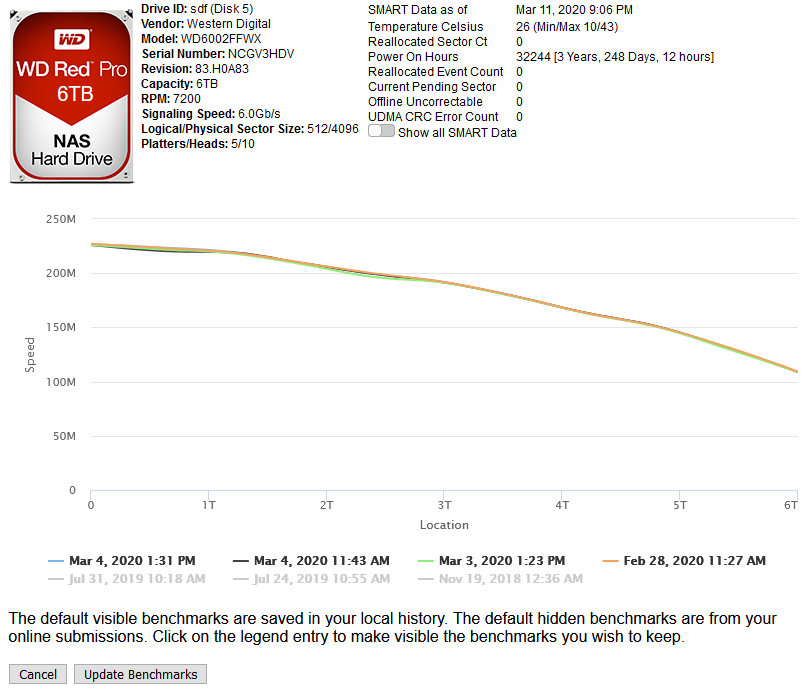
Version 2.7 pushed. Open up the permission on the created debug file Added SMART drive information on Drive data view (brief by default, per-drive toggle for displaying all data) Reworked the logic on the Drive information benchmark graph to display the benchmarks in descending order Sorted benchmark graphs on drive information by date descending Reworked the logic on the main page for displaying the most recent benchmarks for each drive to actually display the most recent benchmarks Some history files weren't being saved with open permissions, updated to open them up A "Manage Bookmarks" button is now displayed on the drive info page showing the following. Existing saved Benchmarks are displayed first and visible. Any previous benchmarks that were submitted to the HDDB will be displayed as hidden. Click on the drive label to toggle visibility. Any that are visible when you save are kept, the hidden ones are not. This will allow you to restore benchmarks if you did a full purge of data or if you have a LOT of benchmarks, allows you to delete all but the newest and oldest for example. The SMART data will display lifespan & critical information by default and the rest can be seen by clicking the toggle under. This is a per-drive persistent toggle. If there's values that aren't displayed in the short list that you think should be, open a telnet session to your unraid box and change to the directory "/var/local/emhttp/smart" and cat the file for the drive in question and send me the label and why it should be displayed. Get the label from the file because the web version is "cleansed" to remove underlines/etc.
-
If that is the case, then perhaps test it using the 3 official lancache containers separately rather than this one. That would prove once and for all that it is a fault with the lancache-bundle image. This is what I was thinking of trying. I'll post updates.
-
I have the same speed issue (or lack thereof) that had me wondering if it was really caching. I haven't done any recent tests on it but I'm still not 100% convinced. There's a script inside the docker itself that tests if the cache is working. Open up a container terminal and type in: ./cache_test.sh This reports that it's working for me (technically, you can only run it once to test).
-
Enabled the "Advanced View" for the docker so it looks like the following If it says "By: jbartlett777/diskspeed", click on the "force update" link.

-
When I was checking out this docker, I downloaded a new game on both steamcache & lancache and then checked to see if the files existed in both. They did not. I then assumed it was not compatible and I dumped the 2TB of steamcache files.
-
Thank you for bringing it to my attention. I recently moved the backend of the DiskSpeed docker off my web server at home to "the cloud" and I missed that. It's fixed. I'm also updating the HDDB to give better graphs where it shows only the last benchmark per person per drive. What's out there now can be messy. Also working on cleaning up the crap drive manufacturers use for their identifications and adding newer drives & their images to ones that people haven't already contributed to the HDDB.
-
Check the solder pin layout on the back of the board (may need to look up the board online), that'll tell you how the slots are actually wired regardless of how the physical slot size is.
-
The controller benchmark tests in drive over, then sdx order. The all drive benchmark does it in port order which should also be sdx order. If you click around on the period at the end of the "Click on a drive label to hide or show it", there's a hidden link on it that will unhide the iframes that are doing the actual work and you can see the debug messages it's printing out or error log if it seems to be hanging.
-
I can duplicate the home page graph not showing the most recent which is odd since I didn't change that logic in a long time. I'll look into it. I've got one drive that shows the same erratic benchmark, on my backup system which should have zero outside activity against it. I removed the cache popping logic and that changed the results though it still shows some erratic hills but didn't throw the speed gap warning. Version 2.6 pushed to remove cache popping logic.
-
I'd try setting up lancache to use different ports (under show more settings) and point it to the Pi-Hole IP for it's DNS.
-
Version 2.5 pushed. Due to internal server logs being stored in the container, I recommend to update to reduce Docker container bloat. Modified new drive detection logic to submit to the top frame for rescanning drive hardware Added Vendor cleanup to match case of known vendors. "SEAGATE" becomes "Seagate" for example. Added cache popping logic for systems that don't respect the cache bypass command on dd Purge internal tomcat & lucee logs which could cause Docker bloat If an incomplete drive scan leaves a partial hardware profile due to a timeout from a spun down drive, rescan the hardware Display drive ID on benchmark random/sequential seek & latency tests Added informational message that is displayed if a Speed Gap was detected
-
Here's what I did to discover which Docker app was bloating up the docker.img file - and found out it was one of my own created Dockers that the app server was creating internal log files. This method works at least 1 day after the Docker app was created/installed. Shelled into the Docker container and changed to the root directory. Executed: du -h --time -d 1 Reviewed the time stamps looking for a directory with today's date & time. Switched to a suspect directory and repeated the du command. Rinse & repeat.
-
Interesting. I'll add this to the cache popping logic. Cache sizes are in MB which should be exhausted in just a couple seconds of read time and each location on the drive is read for 15 seconds.
-
While I do not see any utilization of the cach on my system when I use iflag=direct, the data is still being cached. I also verified that executing "dd if=/dev/[device] iflag=nocache count=0" also dropped the cache for the drive. I'll add that command prior to any dd read.
-
Yes. All calls to dd use the iflag=direct parameter. Can you show the evidence that leads you to think that things are being cached?
-
Set up the share to only use the drive(s) you wish. Use MC to move it off the undesireable share to the other.




