





jbartlett
Community Developer
-
Joined
-
Last visited
Everything posted by jbartlett
-
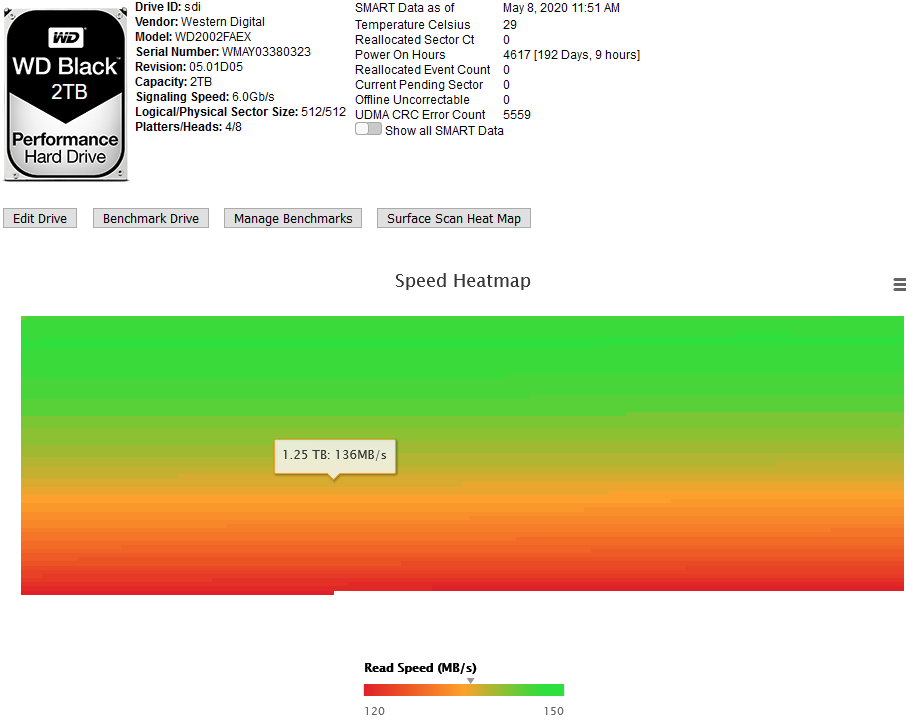
That would be better represented by a color change. The heat map will be a something like an 800x200 grid where the drive size and read speeds are scaled to fit in that. The more times a spot gets hit, the brighter that spot would become. The line between the 11 spots (scanned every 10% plus the start) would be interpolated. Here is a demo that shows a heat map tracking temperatures throughout the year.
-
I am having issues with the docker honoring the CACHE_SLICE_SIZE setting. I added a setting to the Docker app for this CACHE_SLICE_SIZE variable, setting it to 8m. As expected, the docker refused to start since it detected a change to the CONFIGHASH file. I removed it from the lancache directory and the Docker started up, recreating the CONFIGHASH with: GENERICCACHE_VERSION=2;CACHE_MODE=monolithic;CACHE_SLICE_SIZE=8m;CACHE_KEY=$cacheidentifier$uri$slice_range; However, all of my cache slices are still being limited to 1m. Any ideas?
-
I have two data points, drive location and speed. I'd need a 3rd data point for a 3D representation, what would that be?
-
That's basically describing a heatmap. Interesting concept that I'll likely explore - notably because I added a graph with all of the benchmarks using the same revision & RPM and it was just a hot mess of lines.
-
Sorry about this. This has been resolved.
-
I just noticed that the two graphs with the multiple groupings both have the same revision number which tells me that Western Digital used the same circuitry with different number of platters. A quick query shows this same trend over multiple vendors. There might be some insight into seeing how the same revision fairs on different drive media configurations.
-
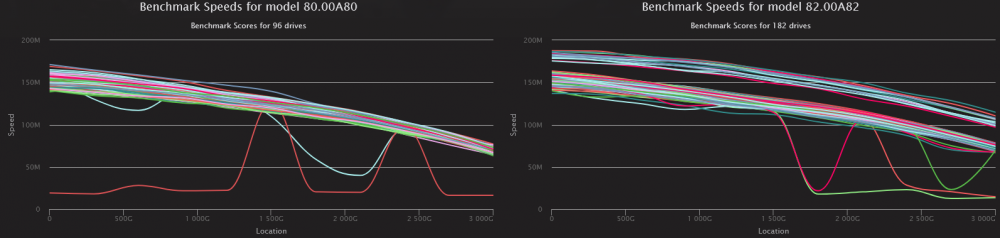
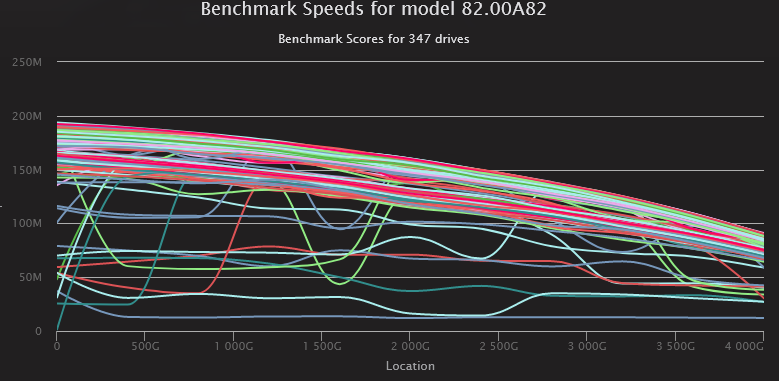
Docker Version 2.8 has been pushed Don't include floppy devices Multiply the SMART LBA Read/Written values by the Logical Sector Size instead of the Sector Size Add more validation logic to clean up Vendor/Model combinations I have rewritten from the ground up the Hard Drive Database website at http://strangejourney.net/hddb/ to display meaningful benchmark graphs. When viewing benchmark data for a particular drive, a graph line is drawn for each unique drive's most recent benchmark is displayed. If 100 people own a given drive and they've all done one or more benchmarks against that drive and uploaded them, the HDDB would have 100 graph lines for those drives. It gives you an idea as to how stable that model is on performance. Take Western Digital model WD30EFRX. It has two revisions, 80.00A80 & 82.00A82. The 1st one is has a slightly wide speed variance up to 30MB/sec at the start of the drive but the 2nd revision has two distinct groupings which indicates that something changed between the two sets but no indication of which drive you got. This graph for a WD40EFRX is indicative of frequent drive failures as well as a fairly wide variance of possible speeds (and also looks like multiple groupings). The speed grouping could be the result of the storage controller it was attached to but I kinda doubt that.
-
I've made some changes to the image search routine to make a log. If you still do not get any images, please comment with the time that you ran your scan (with time zone) so I can find your specific logs.
-
With the latest updates, the plugin is fulfilling my needs nicely. I've verified the miss/hit logic and upon re-install of a Steam game, the download speeds were blistering.
-
Not yet. I haven't had time to do so yet. Personal time on the PC has been limited of late. I'll post an update when it is.
-
I see that in mine too, I'll investigate. I'm assuming the app works fine otherwise?
-
Open a telnet prompt and type in "lshw -c disk" which will list most of the storage media attached. Look for your USB media. Mine looks like the following *-disk description: SCSI Disk product: USB Flash Drive vendor: Lexar physical id: 0.0.0 bus info: scsi@0:0.0.0 logical name: /dev/sda version: 1100 serial: AA00000000000489 size: 29GiB (32GB) capabilities: removable configuration: ansiversion=6 logicalsectorsize=512 sectorsize=512 *-medium physical id: 0 logical name: /dev/sda size: 29GiB (32GB) capabilities: partitioned partitioned:dos configuration: signature=c3072e18 Look at the size on both the disk & medium. If they match, your drive was mislabeled. If the Medium is smaller, than the entire device isn't partitioned to it.
-
Hrm. Nothing stands out as being potentially invalid
-
I don't suspect it is. The only information being passed is a list of vendors & model numbers. ETA: This got me thinking - what is the manufacture & model number of the drive displayed in the app?
-
Thank you. For some reason, you are getting back basically an empty packet with no data. I'll need to add some debugging on my end that'll log the requests coming in and the responses. I'll reply to your email when it's done though I don't have an ETA for when it'll be ready as I'm getting married on the 27th at my home and we're doing basically everything 'cause of COVID-19.
-
This is the 2nd report I've gotten of this. I'll look into it further. I moved the whole back-end system off my private server and onto "the cloud" a couple months ago and there might be something with that. Can you check the following share: "\\tower\appdata\DiskSpeed\Instances\local" and email the file DriveImageHTTPResult.json to [email protected] - this will help me see if there's a transport issues. In the meantime, you can visit http://strangejourney.net/hddb.cfm?View=images to look for brand images. I haven't updated this in about a year so if your drive isn't found, you can typically check the site you ordered it from to get an image to use. Clicking any drive image will download it to your PC. In the DiskSpeed app, click on the drive you want to update the image for and then click the "Edit" button under it. Click the "Upload Image" button. Click on the upload area or drag the downloaded file to it. On the edit screen, set the viewable range or click the expand button to use all and click "Save"
-
It's worth a try only if you care enough to see if it's the controller or not. The "dd" utility is doing all the reporting, my app just takes what it spits out. The graph is indicative of the real performance you're getting but it's not likely something you'd actually ever notice.
-
It's not an error, it means that the read speed over a span was basically the same which hints that the drive can output data faster than the controller can ingest it. When the app analyzes the dd progress log, it saves the min & max read speeds. A "SpeedGap" means there is a larger than expected gap (or span) between these two numbers. This typically is indicative that the drives were accessed while the scan was running. Since this app is inside a Docker container and only can run while the array is up and available, this check is to mitigate such occurrences. It can also be representative of a drive that is failing if it keeps having to retry reading an area while increasing the SpeedGap range after each attempt. Try swapping which drives are on which controller. This may help determine if it is tied to the controller or not.
-
I'll add some debugging to the scanning process that'll hopefully help pinpoint your issue. You'll find it eventually at http://strangejourney.net/hddb.cfm?View=models&Vendor=Western Digital&Model=WD20EFAX but I haven't added graphs for the current version of the benchmark. The previous version averaged out all scans and it was misleading because scans with bad drives & drives not able to go full speed due to the interface was throwing things off. I'll be adding a graph that shows scans for each individual drive uploaded vs an average.
-
Drive images are downloaded when you scan the hardware. Do you see the following message: "There was an error fetching the initial drive images"
-
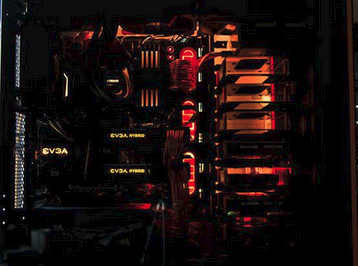
That's the great thing about having more air flow in than out, positive pressure that keeps dust out. I really like the BeQuiet case line. I used it in my personal "Clu" build based on the Tron: Legacy movie https://www.facebook.com/john.bartlett/media_set?set=a.10154927934780590&type=3
-
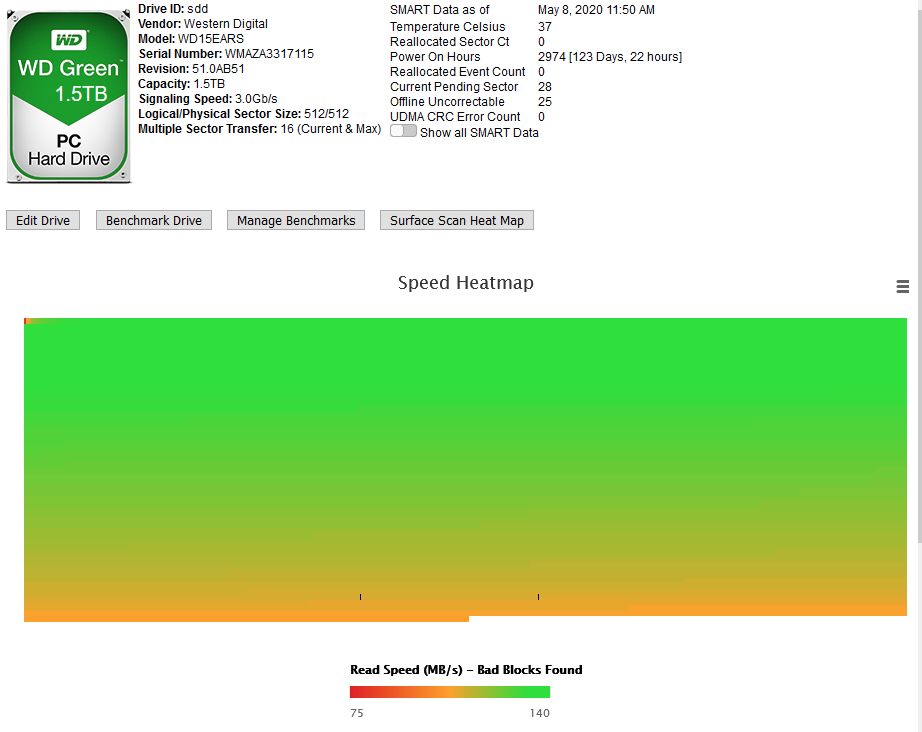
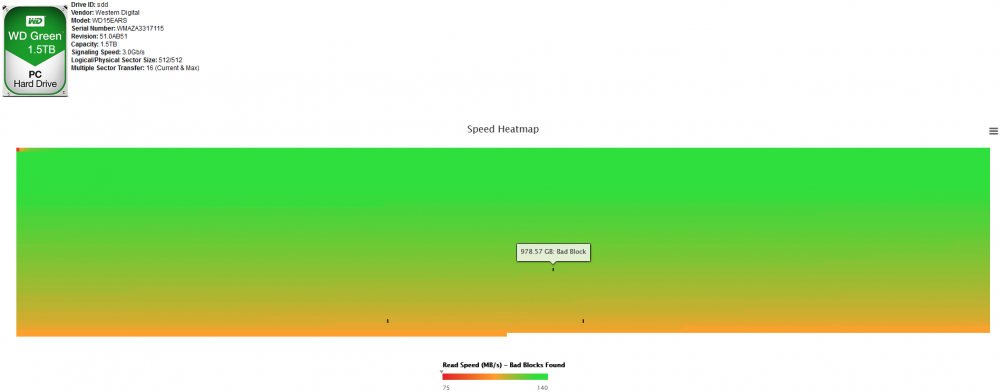
Nope, not yet. I'm working on a surface read speed heatmap right now, then plan on working on a drive utilization map which can help pinpoint what files are located on bad sectors.
-
See the period at the end of the line "Click on a drive label to hide or show it." ? There's a hidden link on that period that when clicked on will make visible the hidden iframes that are doing all the actual work. You'll be able to see if there's an error or not or what's happening. It sounds like the drives are properly being detected but there's an error happening when it's trying to do read tests against the drives on that controller. Copy-n-paste any error message. You do not need to copy-n-paste the Java stack trace.
-
Looks like the file /proc/mdstat gives me the linking information I need. diskNumber.1=1 diskName.1=md1 diskSize.1=9766436812 diskState.1=7 diskId.1=WDC_WD100EFAX-68LHPN0_JEGTUUVM rdevNumber.1=1 rdevStatus.1=DISK_OK rdevName.1=sdg rdevOffset.1=64 rdevSize.1=9766436812 rdevId.1=WDC_WD100EFAX-68LHPN0_JEGTUUVM rdevNumErrors.1=0 rdevLastIO.1=0 rdevSpinupGroup.1=0 I can loop over that to map out the md mounts.
-
Interesting! The filefrag command reports on the information (documenting here so I don't have to rediscover it again in another week like I had to do today) but only works against a direct mounted drive and not against a combined directory such as in /mnt/user. root@NASBackup:/mnt/disk1/Movies/xXx# filefrag -e -b512 xXx.m4v Filesystem type is: 58465342 File size of xXx.m4v is 6129442384 (11971568 blocks of 512 bytes) ext: logical_offset: physical_offset: length: expected: flags: 0: 0.. 262015: 15548729960..15548991975: 262016: 1: 262016.. 1048447: 15539024720..15539811151: 786432: 15548991976: 2: 1048448.. 4194175: 15530636232..15533781959: 3145728: 15539811152: 3: 4194176..11971567: 15444185408..15451962799: 7777392: 15533781960: last,eof The issue I'm trying to work through now is being able to tell what physical drive is mounted where on the file system. We may know that sdb is mounted at /mnt/disk1 but every unix command I've been able to find so far shows that "/dev/md1" is mounted. I haven't found a way yet to trace back to find the physical drive sdb from md1 or take sdb and see how it's linked to the virtualfs md1. The purpose of this is to be agnostic in case the Docker is ran on a non-unraid OS.




