


Rusty6285
Members
-
Joined
-
Last visited
Everything posted by Rusty6285
-
JunctionRelay Unified Data Orchestration & IoT Device Management Documentation: https://junctionrelay-docs.onrender.com GitHub Repo: https://github.com/catapultcase/JunctionRelay
-
Thanks for following up @ich777, yes everything is fine after a complete reinstall/deleting appdata. I did not have to clear browser cache for things to start working again - the total wipe of appdata restored functionality. By unresponsive, what I mean is I saw the same behaviour as posted earlier - the following would be displayed in the log (briefly) before it would go into a reset loop. I am running Unraid Version: 6.12.4 and I updated the luckybackup docker manually this morning - which immediately made it unusable. I was upto date on the prior version, if that helps debugging.
-
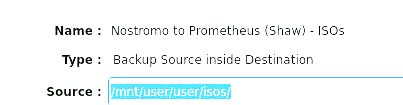
I'm having this same issue where luckybackup is unresponsive after last update. Same log errors as @dataslayerposted. I don't think I have a recent backup of my profiles... is there a way for me to roll back to the prior version so I can save my profiles, before removing/cleaning my config? Edit - By copying out the contents of my 'profiles' folder inside the appdata, then removing both the image and the appdata folder for a reinstall, luckybackup is now working again on a fresh install... Edit 2 - placing the saved profile files back in the new appdata seems to have restored my profiles, however they all are requiring a manual fix to the path, since it's doubled up on 'user/user' where it should only be once... Edit 3 - I seem to have lost the ability to map to remote shares? they are correctly mounted but the path /remotes/ is completely absent in the interface as of this last update. Edit 4 - I found the solution to my profile issues in edit 2 & 3 - seems in my prior install I had 'Container Path: /mnt/user' mapped to just '/mnt/' instead of '/mnt/user' to allow me access to remote shares. Mapping it back to '/mnt/' solved the double user issue, and allowed me to access remotes again.
-
Thanks for the suggestions @Rysz, I tried a variety of settings there and a different USB socket, but no joy - I did however confirm that the "nut_libusb_get_string: Input/Output Error" error appears at whatever frequency the polling rate is set to. For next steps, I will try a PCIe USB card to see if the controller on my motherboard is possibly at fault, and I can also try using my 2nd unraid server as the master. As a last option, I can try making my TrueNAS scale server the master, however I'm not sure if that can act as a NUT master. Will report back with any progress made, thanks again
-
hey folks, really appreciate the work to make this plugin exist! not sure if this is a feature request of perhaps evidence I need to debug my issue further, but my log is filled with the following repeating error: From what I can tell, everything is working properly despite these errors, and after searching forums, the only advice I can find related to these errors is to ignore them. I believe I have verified that I am using the correct driver for my USP (CyberPower CP1500PFCRM2U) Would it be possible to have an option to suppress these errors in the syslog at the plugin level, if they are indeed 'ignorable' ? Also, on my other Unraid server that is set as slave, again.... I am receiving UPS metrics and looks good across the board, however, my log is flooded with intermittent entries like this: Is there a value I should be changing to address this? maybe it's polling too frequently and failing intermittently due to that?
-
Yes this stopped docker from filling up! seems the template side of the mapping for appdata is indeed incorrect
-
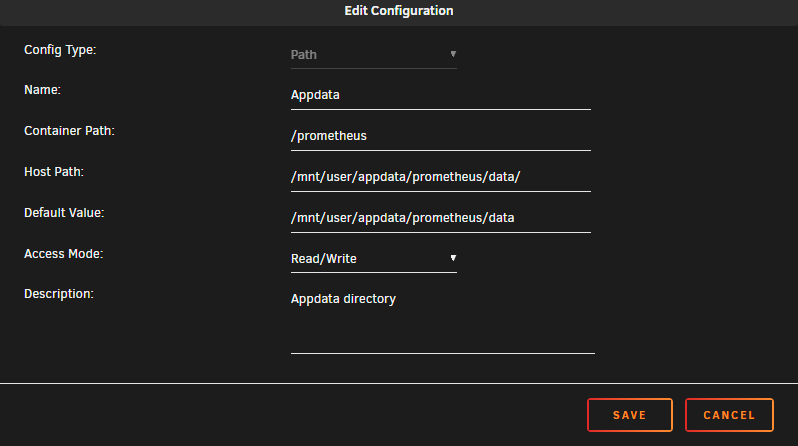
Thanks @Kilrah, I guess I had assumed this thread is where the owner of the template may see this and be able to help! FWIW, based on the doc you shared I manually changed the template path of 'appdata' container path from /prometheus/data to just /prometheus, and I now see files populating as I'd expect inside of the 'data' folder, inside my appdata folder. I'll monitor if this edit resolves the docker image growth issue. This is a bit of trial & error on my part, so hopefully the template owner will verify this action if they see this!
-
hey @Kilrah, what I'm experiencing makes sense if the data is stored inside of /prometheus, but that seems to differ from the templated docker image from community applications?
-
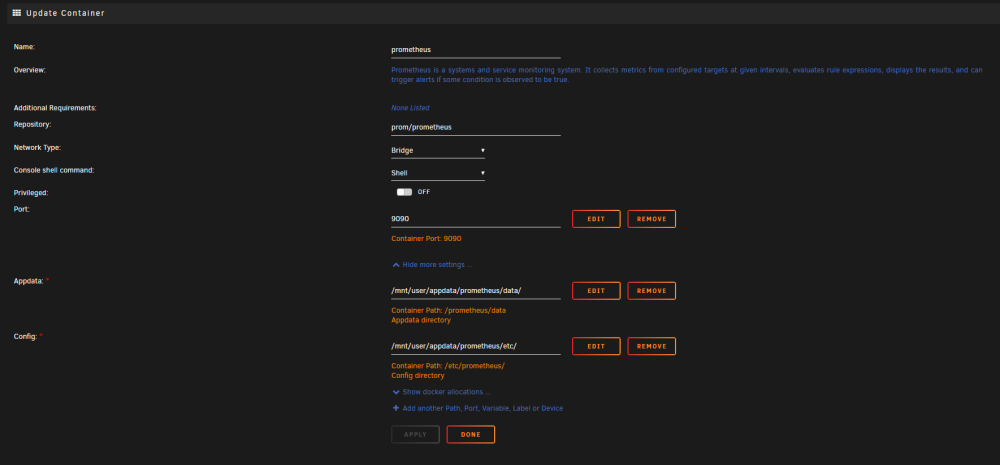
Hey folks, I'm troubleshooting an issue of my docker image filling up pretty quickly, and I believe I've traced it to the prometheus docker. With the docker enabled with 3 monitors, my docker image went from 8.2GiB to 9.2GiB over the course of just a few hours. When the docker is disabled, the size stops growing (and actually recedes slightly). Based on troubleshooting guides, I expected to find a mismatched path in the docker, however, they are set as follows: appdata: /mnt/user/appdata/prometheus/data config: /mnt/user/appdata/prometheus/etc Etc has prometheus.yml, but the data directory is empty? is that normal? Is there an additional mapping my template is missing? Or, is there some additional config inside of prometheus I am failing to configure? I'm not too familiar with the app, if it's supposed to behave this way with some kind of retention policy, is that something I can adjust? when I noticed the issue, my docker had grown to 17GiB! Many thanks
-
Seems the null value beneath it was a red herring - I remembered that I had a user script starting powertop on array start and disabling that has so far returned stability, need to monitor for a few days! thank you for your patience and the troubleshooting steps!
-
As an experiment, I replaced both 'docker.cfg' and 'network.cfg' from the clean Unraid install template, and my new docker.cfg looks quite different upon starting the array: DOCKER_ENABLED="yes" DOCKER_IMAGE_FILE="/mnt/user/system/docker/docker.img" DOCKER_IMAGE_SIZE="20" DOCKER_APP_CONFIG_PATH="/mnt/user/appdata/" DOCKER_APP_UNRAID_PATH="" DOCKER_READMORE="yes" DOCKER_NETWORK_TYPE="1" I don't see 'DOCKER_CUSTOM_NETWORKS=" "' any longer either... were the other values redundant/retired? Edit - Gah, after about 10 minutes the system froze up again. Booting into safemode now as per your suggestion. Edit 2 - After booting in safe mode, guess what's back in my docker.cfg: DOCKER_ENABLED="no" DOCKER_IMAGE_FILE="/mnt/user/system/docker/docker.img" DOCKER_IMAGE_SIZE="20" DOCKER_APP_CONFIG_PATH="/mnt/user/appdata/" DOCKER_APP_UNRAID_PATH="" DOCKER_READMORE="yes" DOCKER_NETWORK_TYPE="1" DOCKER_CUSTOM_NETWORKS=" " DOCKER_TIMEOUT="10" Maybe I'm barking up the tree with that value, but why does it so randomly appear at different stages of this debugging journey?
-
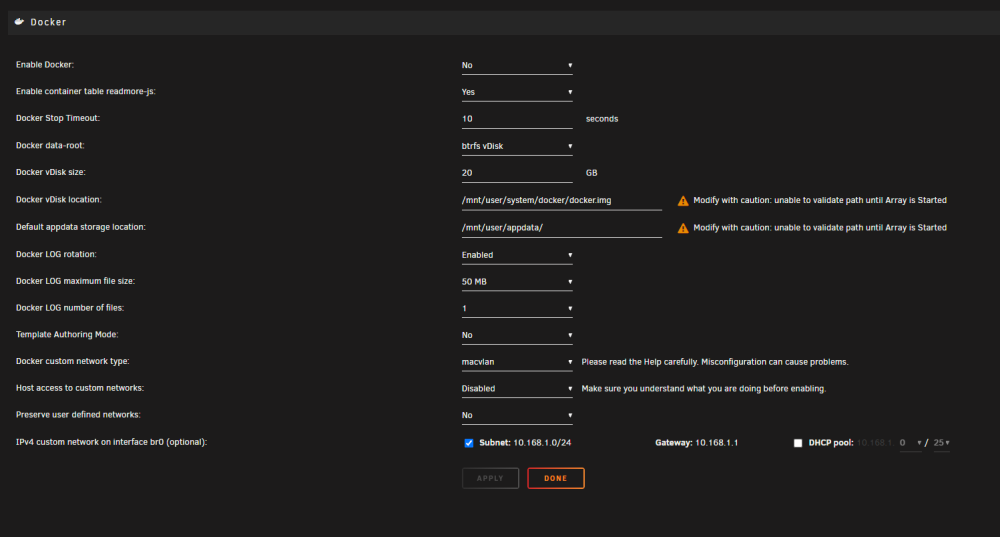
Hey @JorgeB, I replaced my PSU and USB stick again this week but the problem persists - my first boot with the new hardware, I verified that Docker was set to ipvlan and started the array. Within a few moments it crashed. On the next boot, I went back to view docker settings, and as expected, the network type has reverted to macvlan - see image below. Any possible explanation for why this in particular seems to be resetting? if my docker.cfg or network settings are somehow corrupted, is there a way to restore? not making a lot of sense to me right now. This server has been running for many years, with lots of er, tinkering throughout that time it's quite possible I've done something odd with my network configs too, per edit 2 below. Any best practice to eliminate possible issues here? Edit - added diagnostics and the docker (after).cfg file from the flash, obtained on the 2nd boot. I also included docker (before) which is a copy of what I moved to my new flash drive last night. - you can see that a bunch of the docker settings are absent in the 'after' file. Edit 2 - looking at my docker (before), is DOCKER_CUSTOM_NETWORKS=" " a valid value to have in there? seems to be where the files first differ nostromo-diagnostics-20230923-0928.zip docker (before).cfg docker (after).cfg
-
Thanks @JorgeB, I do see 'DOCKER_NETWORK_TYPE="1"' in the current docker.cfg file, so I'll keep an eye on it in future. I'm fairly sure my docker.cfg file keeps getting reset, I'v included docker.cfg from an export a week prior and it has significantly less values in the file for some reason. My syslog is sent to my 2nd unraid server, linked below - I never see meaningful syslog entries when the crash occurs, the last crash was at 'Sep 16 13:16:15'. I've also attached the syslog directly from the crashing server (Nostromo), after the last crash hope these help. volta-syslog-10.168.1.90-20230917-1330.zip nostromo-syslog-20230916-1728.zip docker.cfg
-
Hey folks, my server is inconsistently freezing a few minutes after boot/enabling docker. I've posted previously about an error in the log (here) with no response, but this seems to be related to docker/network settings. As per recommendation of upgrading to 6.12.4, I have docker configured to use ipvlan which has worked fine - when the sever does not crash within the first 10mins of booting, it will run perfectly until the next time I manually shutdown/reboot for maintenance. I have however noticed that after a reboot, the docker network setting is reverting to maclan - possibly I'm not noticing this everytime it reverts and could be the times it freezes up? not sure. I'm also suspicious of my USB flash drive which is a new replacement about 2 weeks ago after the prior seemed to become faulty. Where in the USB drive would this 'ipvlan' setting be, so I can explore closer? Any support/suggestions appreciated, diagnostics attached. nostromo-diagnostics-20230916-1220.zip
-
That is my TrueNAS server, connected via SMB shares. Has been working fine until last update.
-
Voila! nostromo-diagnostics-20230830-1040.zip
-
I don't know if this was truly the issue, but my usb boot drive died about a week after these issues started appearing. Have not appeared again after replacing. YMMV.
-
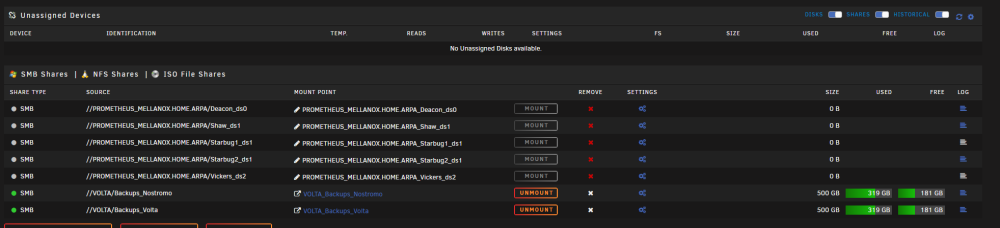
I'm having the same problem as some others here, my remote SMB shares are suddenly showing as 'remote server is offline' after last update of UD - however I can confirm these shares are actually up and running correctly, can access them no problem from other devices. Also, they show temporarily as 'online' after initial boot, then fall into this status. Happy to provide whatever files can help debug this
-
Hey folks, my server is having some trouble shutting down cleanly more often than not, and I'm observing the following error in my syslog on most (but not all) boots. I'm suspicious this mainly appears after an unclean reboot: I'm running Version: 6.12.3 and my hardware is as follows: 12600K Supermicro X13SAE-F 64 GiB DDR5 Single-bit ECC 4x NVME drives in 2xZFS pools (1 on a Startech M2 PCIe SSD Adapter PEX4M2E1) 5x WD Reds PCIe Mellanox 10-Gbe NIC (other onboard NICs disabled via jumpers) Hope someone can point me in right direction, diagnostics attached nostromo-diagnostics-20230816-0735.zip
-
Seems to be solved thanks to a post in reddit - my child datasets all had an owner of 'root' instead of 'nobody' - updated and looks good so far.
-
Hey folks, I recently installed a pair of NVME's in a ZFS mirror to move my App data to. All went fine, except I noticed the docker grafana was not working correctly, for what I assumed was a write access issue. To bypass in short term, I moved grafana back to a BRTFS cache drive, and all worked again. However, I've now noticed that Sonarr docker is also not working, and this time I seem to have confirmation it is a write issue, due to this log entry: I suspect that moving this docker back to the other BRTFS array would again bypass this issue, but I guess should solve it properly 😛 I did not enter anything in 'set permissions' when creating the datasets. Can anyone advise how to give dockers/system write access to ZFS datasets please? Thanks
-
Thanks @itimpi, I've installed the plugin to hopefully capture that info on future runs (the updated 'history' tab does show some extra cols after install, but does not suggest if it was correcting that I can see, at least for runs prior to install). Working with the information I do have though, does it suggest that the scheduled monthly run was correcting? and if so, it shouldnt have been according to the out the box setting...
-
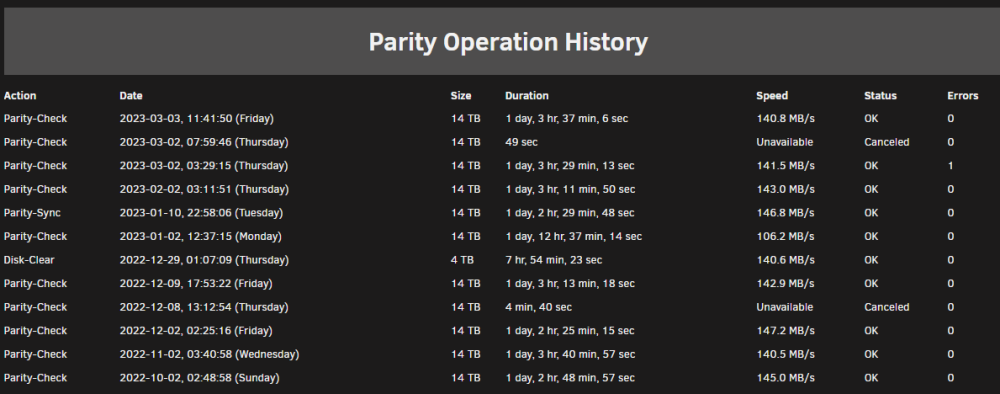
Howdy, A little confused by the behaviour from my server this month. As per title, I have a monthly non-correcting parity check that found 1 error. However, assuming this to be a bit flip or similar, I ran a correcting check the next day and it found no errors. When I look in my syslog, I see these entries from the first run: Does this suggest that the first run was actually a correcting parity check? my schedule has 'Write corrections to parity disk:' set to 'NO'. Any reason Unraid would decide itself to make a scheduled check be a correcting check, despite this setting? Edit: In the image below, the 2nd correcting parity operation I ran dated 2023-03-03.... shouldn't that say Parity-Sync if it was correcting? Thanks!
-
EDIT 11/09/2018 - This has self-corrected itself after a week of no joy. No idea what the cause was! Hello all, Like this user, my OpenVPN has stopped working as of about 6 days ago - I changed no config at all other than pulling an update it seems. I can get into Admin though, it just doesn't connect from any client. I've tried everything to resolve/reinstall and had no luck getting this going again. Is this a known issue currently? I'm surprised more people aren't reporting it if it is? My log (stripped to the essential parts) 20:22:07.638 -- UNUSED OPTIONS4 [nobind] 12 [sndbuf] [100000] 13 [rcvbuf] [100000] 16 [verb] [3] 25 [CLI_PREF_ALLOW_WEB_IMPORT] [True] 26 [CLI_PREF_BASIC_CLIENT] [False] 27 [CLI_PREF_ENABLE_CONNECT] [True] 28 [CLI_PREF_ENABLE_XD_PROXY] [True] 29 [WSHOST] [myDNS:943] 30 [WEB_CA_BUNDLE] [-----BEGIN CERTIFICATE----- certificate number...] 31 [IS_OPENVPN_WEB_CA] [1] 32 [ORGANIZATION] [OpenVPN, Inc.] 20:22:07.639 -- EVENT: RESOLVE20:22:07.970 -- Contacting [my server]:1194 via UDP20:22:07.971 -- EVENT: WAIT20:22:07.973 -- Connecting to [myDNS]:1194 (my server) via UDPv620:22:17.641 -- Server poll timeout, trying next remote entry...20:22:17.653 -- EVENT: RECONNECTING20:22:17.658 -- EVENT: RESOLVE20:22:17.665 -- EVENT: WAIT20:22:17.698 -- Connecting to [myDNS]:1194 (my server) via UDPv620:22:27.643 -- Server poll timeout, trying next remote entry...20:22:27.655 -- EVENT: RECONNECTING20:22:27.658 -- EVENT: RESOLVE20:22:27.665 -- EVENT: WAIT20:22:37.646 -- Server poll timeout, trying next remote entry...20:22:37.656 -- EVENT: RECONNECTING20:23:07.652 -- EVENT: DISCONNECTED20:23:07.655 -- EVENT: CORE_THREAD_INACTIVE20:23:07.656 -- Tunnel bytes per CPU second: 020:23:07.661 -- ----- OpenVPN Stop -----


