


Mason736
Members
-
Joined
-
Last visited
-
Does anyone have an update to know if the compatibility issue has been fixed with subsequent releases of Unraid? I’d love to go back to being able to spin down my array without dropping HDDs from the array.
-
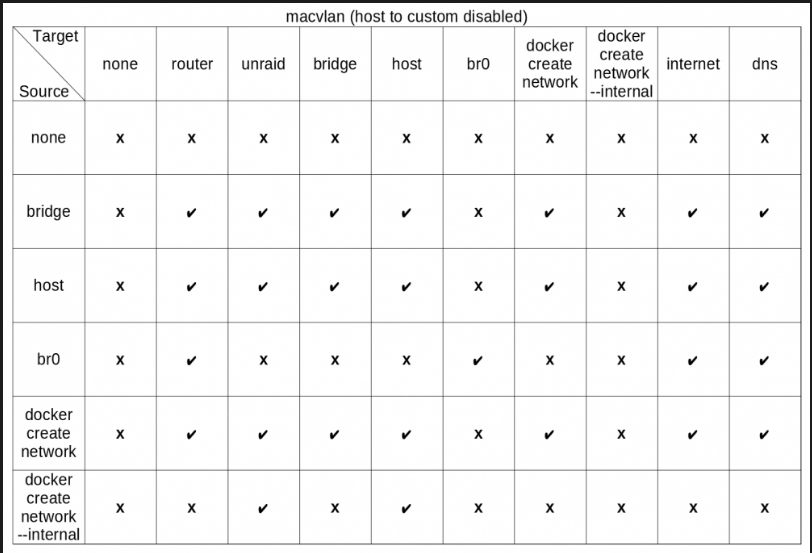
I recently installed NetData, and noticed none of my dockers are showing in the app. I mainly use a custom br0 for most of my dockers that I expose to NGINX reverse proxy, which I intended to do with Netdata. If I have Netdata on br0, rather than bridge, is that the reason its not seeing the docker containers?
-
I got it fixed! This post was so helpful to figure out the issue. I was trying to cross br0 and bridge networks.
-
So i made progress. I switched to the Official release of NGINX app. Now i'm getting the SSL cert to authorize and go through, however I'm getting the 502 Bad Gateway error now.
-
Hello fellow unraiders. I decided to setup NGINX after debating it for a while. For some reason, I can't get the final piece to work. I followed many of the tutorials, setup duckdns, setup port forwarding, created a subdomain for overseer (trial app), etc... If i go to overseer.mydomain.com, get a "the site cannot be reached" overseer.mydomain.com refused to connect. However, if I put in my ISP IP address:8080, (port number I setup), I can get to the page showing "Congratulations! You've successfully started the Nginx Proxy Manager. If you're seeing this site then you're trying to access a host that isn't setup yet." I'm not sure what else to do to troubleshoot. Additionally, I keep getting "internal error" when trying to setup the SSL for the host (overseer).
-
I can confirm this. Over since I changed the ST8000VN004 drives (4 of them) to never spin down, always be spun up, they have been fine, and have not dropped from the array.
-
awesome. i'll start the RMA process again, for a brand new drive. Starting to really not like Seagate. Separately, on a good note, I changed the spin-up of all of the ST8000VN004 drives to never spin down, and none of them have dropped from the array. The drop/error has something to do with the spin-up, but I'm not technically advanced enough to understand the mechanics behind it.
-
Here is a copy of the latest smart extended test. Keep in mind, this drive is brand new. I'm not sure how to interpret this. archie-smart-20210423-0922.zip
-
As of yesterday, all of the ST8000NV04 drives are dropping out of the array. The ST8000NV0022's are working perfect.
-
Update again: the ST8000V04 drives are not continuing to drop out of the array. I'm unsure how to proceed at this point.
-
Update: the updated firmware on the 9211-8i definitely helped. However, i did receive a couple new ST8000NV04 drives, and just stuck them in the array, without disabling EPC or Low Voltage Spin Up. They dropped from the array almost instantly. Once I used the seagate tools and disabled the features, they have been just fine. I'm looking forward to whatever the fix may be for the seagate drives.
-
That worked...thank you!
-
Here is the log dump: {"type":"log","@timestamp":"2021-04-13T14:58:11-04:00","tags":["info","plugins-service"],"pid":8,"message":"Plugin \"osquery\" is disabled."} {"type":"log","@timestamp":"2021-04-13T14:58:11-04:00","tags":["info","plugins-service"],"pid":8,"message":"Plugin \"osquery\" is disabled."} {"type":"log","@timestamp":"2021-04-13T14:58:11-04:00","tags":["warning","config","deprecation"],"pid":8,"message":"Support for setting server.host to \"0\" in kibana.yml is deprecated and will be removed in Kibana version 8.0.0. Instead use \"0.0.0.0\" to bind to all interfaces."} {"type":"log","@timestamp":"2021-04-13T14:58:11-04:00","tags":["warning","config","deprecation"],"pid":8,"message":"Config key [monitoring.cluster_alerts.email_notifications.email_address] will be required for email notifications to work in 8.0.\""} {"type":"log","@timestamp":"2021-04-13T14:58:12-04:00","tags":["info","plugins-system"],"pid":8,"message":"Setting up [100] plugins: [taskManager,licensing,globalSearch,globalSearchProviders,banners,code,usageCollection,xpackLegacy,telemetryCollectionManager,telemetry,telemetryCollectionXpack,kibanaUsageCollection,securityOss,share,newsfeed,mapsLegacy,kibanaLegacy,translations,legacyExport,embeddable,uiActionsEnhanced,expressions,charts,esUiShared,bfetch,data,home,observability,console,consoleExtensions,apmOss,searchprofiler,painlessLab,grokdebugger,management,indexPatternManagement,advancedSettings,fileUpload,savedObjects,visualizations,visTypeVislib,visTypeVega,visTypeTimelion,features,licenseManagement,watcher,canvas,visTypeTagcloud,visTypeTable,visTypeMetric,visTypeMarkdown,tileMap,regionMap,visTypeXy,graph,timelion,dashboard,dashboardEnhanced,visualize,visTypeTimeseries,inputControlVis,discover,discoverEnhanced,savedObjectsManagement,spaces,security,savedObjectsTagging,maps,lens,reporting,lists,encryptedSavedObjects,dataEnhanced,dashboardMode,cloud,upgradeAssistant,snapshotRestore,fleet,indexManagement,rollup,remoteClusters,crossClusterReplication,indexLifecycleManagement,enterpriseSearch,beatsManagement,transform,ingestPipelines,eventLog,actions,alerts,triggersActionsUi,stackAlerts,ml,securitySolution,case,infra,monitoring,logstash,apm,uptime]"} {"type":"log","@timestamp":"2021-04-13T14:58:12-04:00","tags":["info","plugins","taskManager"],"pid":8,"message":"TaskManager is identified by the Kibana UUID: 5d53dbcc-8093-4b66-bdf1-2a395d8bac01"} {"type":"log","@timestamp":"2021-04-13T14:58:12-04:00","tags":["warning","plugins","security","config"],"pid":8,"message":"Generating a random key for xpack.security.encryptionKey. To prevent sessions from being invalidated on restart, please set xpack.security.encryptionKey in the kibana.yml or use the bin/kibana-encryption-keys command."} {"type":"log","@timestamp":"2021-04-13T14:58:12-04:00","tags":["warning","plugins","security","config"],"pid":8,"message":"Session cookies will be transmitted over insecure connections. This is not recommended."} {"type":"log","@timestamp":"2021-04-13T14:58:12-04:00","tags":["warning","plugins","reporting","config"],"pid":8,"message":"Generating a random key for xpack.reporting.encryptionKey. To prevent sessions from being invalidated on restart, please set xpack.reporting.encryptionKey in the kibana.yml or use the bin/kibana-encryption-keys command."} {"type":"log","@timestamp":"2021-04-13T14:58:12-04:00","tags":["warning","plugins","reporting","config"],"pid":8,"message":"Chromium sandbox provides an additional layer of protection, but is not supported for Linux CentOS 8.3.2011\n OS. Automatically setting 'xpack.reporting.capture.browser.chromium.disableSandbox: true'."} {"type":"log","@timestamp":"2021-04-13T14:58:12-04:00","tags":["warning","plugins","encryptedSavedObjects"],"pid":8,"message":"Saved objects encryption key is not set. This will severely limit Kibana functionality. Please set xpack.encryptedSavedObjects.encryptionKey in the kibana.yml or use the bin/kibana-encryption-keys command."} {"type":"log","@timestamp":"2021-04-13T14:58:12-04:00","tags":["warning","plugins","fleet"],"pid":8,"message":"Fleet APIs are disabled because the Encrypted Saved Objects plugin is missing encryption key. Please set xpack.encryptedSavedObjects.encryptionKey in the kibana.yml or use the bin/kibana-encryption-keys command."} {"type":"log","@timestamp":"2021-04-13T14:58:12-04:00","tags":["warning","plugins","actions","actions"],"pid":8,"message":"APIs are disabled because the Encrypted Saved Objects plugin is missing encryption key. Please set xpack.encryptedSavedObjects.encryptionKey in the kibana.yml or use the bin/kibana-encryption-keys command."} {"type":"log","@timestamp":"2021-04-13T14:58:12-04:00","tags":["warning","plugins","alerts","plugins","alerting"],"pid":8,"message":"APIs are disabled because the Encrypted Saved Objects plugin is missing encryption key. Please set xpack.encryptedSavedObjects.encryptionKey in the kibana.yml or use the bin/kibana-encryption-keys command."} {"type":"log","@timestamp":"2021-04-13T14:58:13-04:00","tags":["info","plugins","monitoring","monitoring"],"pid":8,"message":"config sourced from: production cluster"} {"type":"log","@timestamp":"2021-04-13T14:58:13-04:00","tags":["info","savedobjects-service"],"pid":8,"message":"Waiting until all Elasticsearch nodes are compatible with Kibana before starting saved objects migrations..."} {"type":"log","@timestamp":"2021-04-13T14:58:13-04:00","tags":["warning","plugins","licensing"],"pid":8,"message":"License information could not be obtained from Elasticsearch due to [illegal_argument_exception] request [/_xpack] contains unrecognized parameter: [accept_enterprise] :: {\"path\":\"/_xpack?accept_enterprise=true\",\"statusCode\":400,\"response\":\"{\\\"error\\\":{\\\"root_cause\\\":[{\\\"type\\\":\\\"illegal_argument_exception\\\",\\\"reason\\\":\\\"request [/_xpack] contains unrecognized parameter: [accept_enterprise]\\\"}],\\\"type\\\":\\\"illegal_argument_exception\\\",\\\"reason\\\":\\\"request [/_xpack] contains unrecognized parameter: [accept_enterprise]\\\"},\\\"status\\\":400}\"} error"} {"type":"log","@timestamp":"2021-04-13T14:58:13-04:00","tags":["warning","plugins","monitoring","monitoring"],"pid":8,"message":"X-Pack Monitoring Cluster Alerts will not be available: X-Pack plugin is not installed on the Elasticsearch cluster."} {"type":"log","@timestamp":"2021-04-13T14:58:13-04:00","tags":["error","savedobjects-service"],"pid":8,"message":"This version of Kibana (v7.12.0) is incompatible with the following Elasticsearch nodes in your cluster: v6.6.2 @ 172.17.0.9:9200 (172.17.0.9)"}
-
Hi, I'm having an issue with the Kibana docker. I get both Elastisearch and Kibana setup. However when I try and use Kibana, i get a simple white page, with the message "Kibana server is not ready yet". I'm unsure how to fix this. Any help would be great. Thanks!
-
LSI 92118i HBA has been updated to 20.00.07.00. See updated diagnostics. archie-diagnostics-20210413-1259.zip

