


thrroow
Members
-
Joined
-
Last visited
Everything posted by thrroow
-
Okay finally figured it out. I had another semi-broken eth port connected that I used as a fallback in the past. For some strange reason during my upgrades, the eth0 switched which mac address it was mapped to. Swapping those in network settings fixed the issue.
-
Alright. I will break out the compressed air and some more CAT6 cables and keep trying things. The reason I was suspicious this was something else is the switch it is directly connected says 10G (as do lights on both sides of the connection) Also tried it in a different 1Gbps switch and it said negotiated to 1Gbps too (while still 100Mb in UNRAID)
-
eth0 looks more accurate, thanks. Still doesn't solve the problem. I fear it's something in the BIOS, which has been quite the pain in the past. Settings for eth0: Supported ports: [ TP ] Supported link modes: 100baseT/Full 1000baseT/Full 10000baseT/Full Supported pause frame use: Symmetric Supports auto-negotiation: Yes Supported FEC modes: Not reported Advertised link modes: 100baseT/Full 1000baseT/Full 10000baseT/Full Advertised pause frame use: Symmetric Advertised auto-negotiation: Yes Advertised FEC modes: Not reported Speed: 100Mb/s Duplex: Full Auto-negotiation: on Port: Twisted Pair PHYAD: 0 Transceiver: internal MDI-X: Unknown Supports Wake-on: umbg Wake-on: g Current message level: 0x00000007 (7) drv probe link Link detected: yes
-
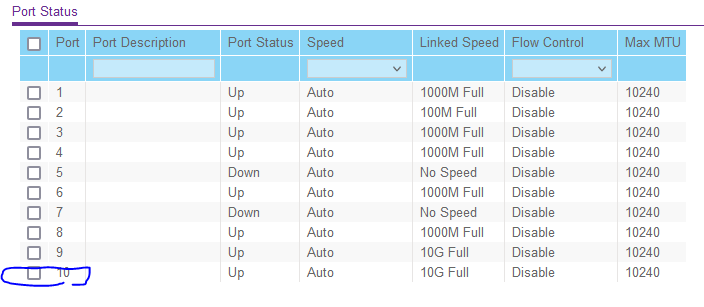
Did a small overhaul today and added some more drives and swapped around some SATA connections. Added a PCIe for 4 more SATA ports and removed a 4x1Gb networking card (I wasn't using it for anything). I turn the server back on and start clearing the drives, all is well. No problems at all. I notice web traffic seems slow in/out of the server and check the dashboard -- sure enough it says `eth0100 Mbps, full duplex, mtu 1500`. I thought it was the cable that became unseated but I tried other cables. I also checked my switch via lights & in software and both confirm the link speed is 10Gb. I feel like I am missing something obvious, but I am not sure what else to check. How can the link speed be 10Gb on the hardware, but only show 100Mb in unraid? I have the GA-7PESH2 motherboard and am using the builtin 10Gb Intel networking. Never had this problem until this upgrade. Here's the latest syslog, no mention of failing to negotiate at 1 or 10Gb before this Apr 15 21:52:57 Tower root: Verifying package rclone-2022.01.20-bundle.txz. Apr 15 21:52:57 Tower root: Installing package rclone-2022.01.20-bundle.txz: Apr 15 21:52:57 Tower root: PACKAGE DESCRIPTION: Apr 15 21:52:57 Tower root: Package rclone-2022.01.20-bundle.txz installed. Apr 15 21:52:57 Tower root: plugin: running: anonymous Apr 15 21:52:59 Tower kernel: ixgbe 0000:05:00.0 eth0: NIC Link is Up 100 Mbps, Flow Control: RX/TX Apr 15 21:52:59 Tower kernel: br0: port 1(eth0) entered blocking state Apr 15 21:52:59 Tower kernel: br0: port 1(eth0) entered forwarding state Apr 15 21:53:00 Tower ntpd[1939]: Listen normally on 2 br0 192.168.1.99:123 Apr 15 21:53:00 Tower ntpd[1939]: new interface(s) found: waking up resolver Apr 15 21:53:02 Tower root: Local rclone binary up-to-date ifconfig: br0: flags=4163<UP,BROADCAST,RUNNING,MULTICAST> mtu 1500 inet 192.168.1.99 netmask 255.255.255.0 broadcast 0.0.0.0 ether xx:xx:xx:xx:xx:xx txqueuelen 1000 (Ethernet) RX packets 3848501 bytes 5309227708 (4.9 GiB) RX errors 0 dropped 939 overruns 0 frame 0 TX packets 1790718 bytes 571169498 (544.7 MiB) TX errors 0 dropped 0 overruns 0 carrier 0 collisions 0 ethtool: ethtool br0 Settings for br0: Supported ports: [ ] Supported link modes: Not reported Supported pause frame use: No Supports auto-negotiation: No Supported FEC modes: Not reported Advertised link modes: Not reported Advertised pause frame use: No Advertised auto-negotiation: No Advertised FEC modes: Not reported Speed: 100Mb/s Duplex: Unknown! (255) Auto-negotiation: off Port: Other PHYAD: 0 Transceiver: internal Link detected: yes
-
I have upgraded to 6.9.0-rc1 and the new Nvidia drivers to keep hardware transcoding. For some reason a certain patch doesn't work, but I don't really need more than several streams at once, so no big deal. However, if I'm transcoding 3 streams, and someone goes to try and use a 4th one, it just constantly buffers / is just a black frame. Is this expected behavior? I would imagine Plex would realize that the card is at the transcode limit and fallback to CPU?
-
wow that careless of me. Thanks for the headsup, changed credentials.
-
I've got a weird problem. After months of running fine and me not touching anything, rtorrent suddently stopped being able to be used by web interface. When I would click anything it would just say error. When I add a torrent it would fail. HOWEVER, sonarr/radarr/etc still could use it fine, so I never bothered fixing it. Now weeks later it won't boot at all. So I deleted the container, used a blank config folder - the only thing I kept is the wireguard folder. Both the old and new containers now just hang on "loading" and never even let me see the GUI. No response from sonarr/radarr. I'm not sure what else to try, I would assume deleting the container and remaking with a whole new data folder should remove almost anything I could have done to it?
-
It's started and stopped happening to me, at seemingly random intervals.
-
I actually used to have this problem, then it went away for months, now it's back. No significant hardware changes in that time.
-
I was in the middle of uploading several screenshots when I saw that the container volume mapping was /data/ (as it had been), but the within qbittorrent the /data/ location had changed to /downloads/. After changing it back to /data and restarting it, it now works! When or how did those settings get changed within qbittorrent? I definitely didn't touch any of those settings.
-
I misunderstood your question. Yes both those paths are the same in each docker, and I have all identical settings (even ports). I ran one, tried to download, stopped it, started the other, and tried the same download. And again, no paths or settings of any kind have changed in months. Another odd thing I noticed, is that sometimes public trackers work slowly (like RARBG ~400kbps). But trackers that should be faster (iptorrents, xspeeds, ubuntu, etc.) don't work at all. Also tested all of these on both docker containers and on a PC using the same VPN connection. In all cases it's only this particular docker that won't download. I was talking about deleting the container files, e.g., anything pulled down from the docker repository or any container data. Or might that not help?
-
No, both containers were changed to be exactly the same, including container mounted paths, settings, etc. Also, as others have mentioned, these setups used to work just fine. All of a sudden stopped working even though I haven't even opened up the webUI in months. I just noticed radarr/sonarr downloads were stacking up. Double checked with a manual Ubuntu torrent to make sure it wasn't a tracker or VPN issue. Is there a way to delete all container info etc. so that all of it will be re-downloaded? I can try that too.
-
I didn't change the folders it was pointing to, however, the other qbitvpn docker I downloaded and tried were also pointed at the same folders with no problems. I also made sure to use the exact same ovpn credential file between the two instances. I get around 40 to 60MB/s on my VPN, so it's definitely not overhead or losses. The one thing I didn't try was to get rid of the torrent backup folder because I'd rather switch clients than stop seeding hundreds of torrents.
-
Also having the same issues as everyone else with the very slow speeds that soonafter just reach 0kbps. I tried installing the other qbittorrentVPN and copied my appdata and torrents to it - same issues. I then deleted all the config/logs/etc - everything BUT the torrents I was downloading and restarted it. This worked and behaved normally. I tried to copy the same thing to binhex-qbittorrentvpn but it didn't help, still slow speeds with everything else being identical. I guess I'm switching dockers for the time being since they're basically identical, except one works
-
In terms of featureset, this is my favorite torrent client so far. But after a few minutes of use, it becomes painfully slow. Setup with just a normal config using a VPN (PIA). Saving to download directory which is downloading to a cache drive first. Dual xeon CPU, and never high CPU usage detected. Any troubleshooting ideas?
-
Thanks, I finally got it working. I think I had other settings in CloudFlare that were messing me up. Here are some of my settings in case anyone else has to figure this out: DNS Tab: A records that point to my IP. Set to automatic (orange cloud) Crypo tab: SSL: Full Origin Cert: *.mydomain.com, mydomain.com (save both these outputs as .PEM and .KEY) Always use HTTPS: Off Auth Origin Pull: Off Min TLS: 1.0 Opportunistic Encrypt: Off Onion Routing: Off TLS 1.3: Disabled
-
Yes. I have the 80/443 ports correctly configured, and my dockers apparently correctly configured (I was up and running with LetsEncrypt docker before). Cloudflare handled my SSL certs before for some reason, could never figure out why I wasn't seeing LE certs. I assume it's the same problem I'm running into now. What do I need to check or revisit to try and get this working?
-
Yes I can (at least I think). But using cloudflare as my DNS I can't connect to any https docker. The only thing I've gotten to work is an HTML5 speedtest that is http. Another user on this thread told me to use CloudFlare generated keys in NGINX. Doing that I'm getting a 521 error now (web server down).
-
I'm struggling with certs on CloudFlare right now. I thought that's what LetsEncrypt does? Do we need to fill in all 3 fields of the Custom section? CloudFlare only gives a key and another file
-
No, I have not. You use the .key as the Certificate Key and the .PEM as the Certificate and the Intermediate Certificate?
-
I feel like I am missing a step in setting this up. LetsEncrypt docker serves works perfectly, but when I switch to this I can't reach any dockers. Here's what I did: 1) Went to CloudFlare and turned off any HTTPS on their end. Tried both auto and normal DNS forwarding to my IP for each subdomain 2) Router is forwarding ports 80/443 to 180/1443 found in the NGINX Proxy Manager docker install page. 3) Switch dockers to all be on bridge mode 4) Added entries to Proxy manager, for example: radarr.mysite.com, scheme: http or https, ip: 192.168.1.99, port: 7878, SSL cert: LE radarr.mysite.com I either get a 502 BAD GATEWAY or ERR_TOO_MANY_REDIRECTS based on what settings I play around with. The single docker I've gotten to run is the HTML5 Speedtest, and that is the only one to my knowledge that doesn't use SSL. So I believe it to be a cloudflare or LE SSL issue. Any advice? edit: also, I can head to nondockersubdomain.mydomain.com and itll bring me to the "congratulation landing page".
-
Is the proxy pass directive the .conf file within nginx?
-
Yes the container is called "speedtest" and it maps 80:6580. It's setup in the exact same manner as sonarr/radarr etc. except with the docker name and port switched out.
-
Trying to setup an HTML5 speedtest to be accessable via subdomain but I am having no luck. All other dockers work on subdomains fine, and the speedtest works on the localip:port, but for some reason nginx is having an issue serving it. My config is: server { listen 443 ssl; listen [::]:443 ssl; server_name speedtest.*; include /config/nginx/ssl.conf; client_max_body_size 0; # enable for ldap auth, fill in ldap details in ldap.conf #include /config/nginx/ldap.conf; location / { # enable the next two lines for http auth #auth_basic "Restricted"; #auth_basic_user_file /config/nginx/.htpasswd; # enable the next two lines for ldap auth #auth_request /auth; #error_page 401 =200 /login; include /config/nginx/proxy.conf; resolver 127.0.0.11 valid=30s; set $upstream_speedtest speedtest; proxy_pass http://$upstream_speedtest:6580; } } Any ideas?
-
Installed this docker successfully and went to the login page, tried to login with admin/password and it says "Login failed". Not sure if somehow the user/pass are wrong, or something else? Any ideas?

