





dk4dk4
Members
-
Joined
-
Last visited
Everything posted by dk4dk4
-
04/22/2026 - I found the root cause of this issue was a Ryzen 5700g CPU. That CPU died today, I replaced with a spare off the shelf Ryzen 1700x and the slow dashboard issue went away. Instantly loads the dashboard now. The 5700G (APU) uses integrated graphics, whereas the 1700X likely uses a dedicated GPU. The Unraid kernel may be struggling with AMD APU drivers. Hope this helps someone. After upgrading to latest 7.2.0 my dashboard screen takes over 2 minutes to load. Troubleshooting: Issue exists with Edge, Brave, and in incognito modes Renamed plugin scripts with reboot tested with both docker and vm services disabled rm /boot/config/dashboard_settings.json file then reboot updated motherboard to latest BIOS, rm dashboard file, reboot booted with safe mode (GUI and plugins disabled) I created the diagnostics file in safe mode with array stopped. NOTE: when dashboard is clicked UnRaid GUI becomes unresponsive, cannot change current window to new tab, cannot launch a new tab until the clicked dashboard process times out and finally loads this view attached... None of these steps have resulted in normal dashboard load time. I did notice once the dashboard loads (over 2 mins later) the 'SYSTEM' section is missing the details (ZFS, graphs, status, icons, images etc)... jarvis-safemode-diagnostics-20251106-1354.zip
-
Hi this is exactly what I am after. Few questions on the current state: 1. I started with testing 'history' and the result worked: curl 192.168.1.2:8787/history/AAPL | jq ... { "Date": "2024-10-15T00:00:00.000Z", "Open": 233.6100006104, "High": 237.4900054932, "Low": 232.3699951172, "Close": 233.8500061035, "Volume": 64707600, "Dividends": 0, "Stock Splits": 0 }, { "Date": "2024-10-16T00:00:00.000Z", "Open": 231.6199951172, "High": 232.1199951172, "Low": 229.8500061035, "Close": 231.7799987793, "Volume": 32657566, "Dividends": 0, "Stock Splits": 0 } ] } 2. I then tested the /info/ section as this is where I currently need a value from: root@Jarvis:~# curl 192.168.1.2:8787/info/AAPL | jq % Total % Received % Xferd Average Speed Time Time Time Current Dload Upload Total Spent Left Speed 100 64 100 64 0 0 12 0 0:00:05 0:00:05 --:--:-- 15 { "logo_url": "", "preMarketPrice": null, "regularMarketPrice": null } Looks broken: I do not get any info data back as you can see above. Also, is it possible to make it query an individual value from /info/ ? IE. curl ... /info/volume/APPL curl ... /info/dayHigh/APPL I want to be able to get a single value back from the call (parameterized as input). I could then call from excel and get the single value back for example (vs an array of stuff)... A few tweaks and this would be awesome! Thanks!
-
Hi Team, I've recently upgraded to 6.8rc1 without issue on my home network. I have WireGuard on my main router (not on unraid) and I am able to tunnel into my LAN for remote support (WG on Android client). However, I am NOT able to load any UnRaid management web pages from my phone while on the WG VPN tunnel. Though I am able to access all my Docker web pages that are running on unraid no problem while on the same WG tunnel... I tried /Main, /Dashboard, /Docker, etc. I tried Chrome, Firefox, clearing browser history, etc. Chrome times out with: This site can't be reached <IP> took too long to respond. ERR_CONNECTION_TIMED_OUT I noticed you packaged WG into this release... I'm sure more people will come to notice this issue. I can load the UnRaid pages on my phone while connected via wifi (not on the tunnel, local LAN). I'm willing to test as well if you come up with a solution or require any troubleshooting! Thanks!
-
disable upnp on your router and then restart Plex. See if that pegged cpu goes away!
-
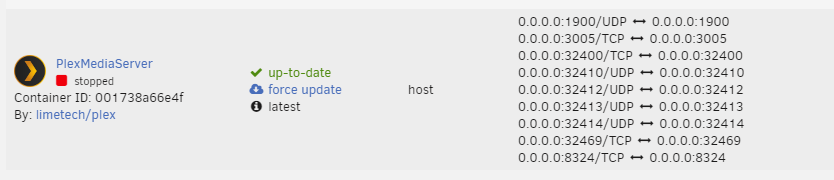
Understood perhaps I can show you another Plex container that is the same config that shows the ports:
-
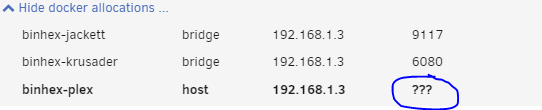
When I install and configure your Plex container I do not see the Port Mapping column completed in the list of dockers? There should be a large list of ports in use here: Any thoughts on how to populate the list of docker allocations for binhex-plex?

-
I can confirm this also works after reboot: Vulnerable, IBPB: disabled, STIBP: disabled Ver 6.7.0 (on-trial still)
-
When I removed the buttons it does not restore the placeholder at the top right back to before it was there. The placeholder is still there for a button that was removed... FYI
