light2089
Members
-
Joined
-
Last visited
-
Looks like only one of the network between br0 and br2 can have a static ipv6. With ipv6 disabled in br2, br0 ipv6 config worked as intended.
-
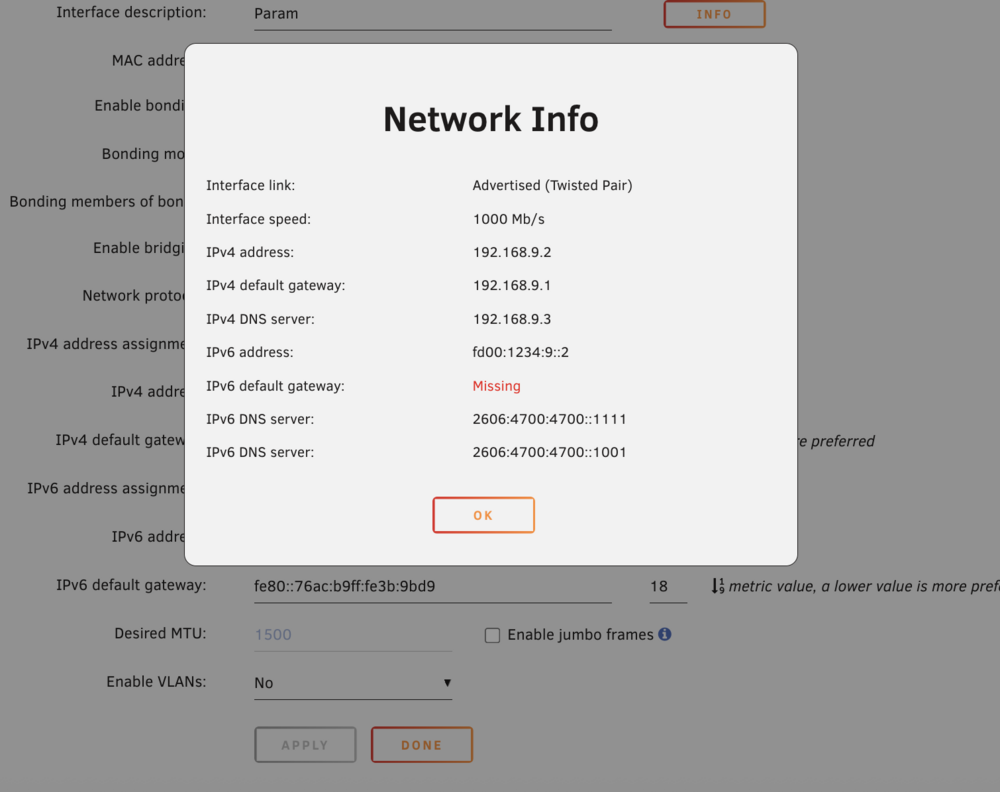
I deleted my network config file and rebooted, and set everything again because ipv6 gateway would show missing. the problem resolved, but has come back again after a reboot: Automatic assignment assigns the correct gateway address. It works fine for br2, another bonded network that I have. Started facing this issue after upgrade to 7.1.4 param-diagnostics-20250710-1721.zip
-
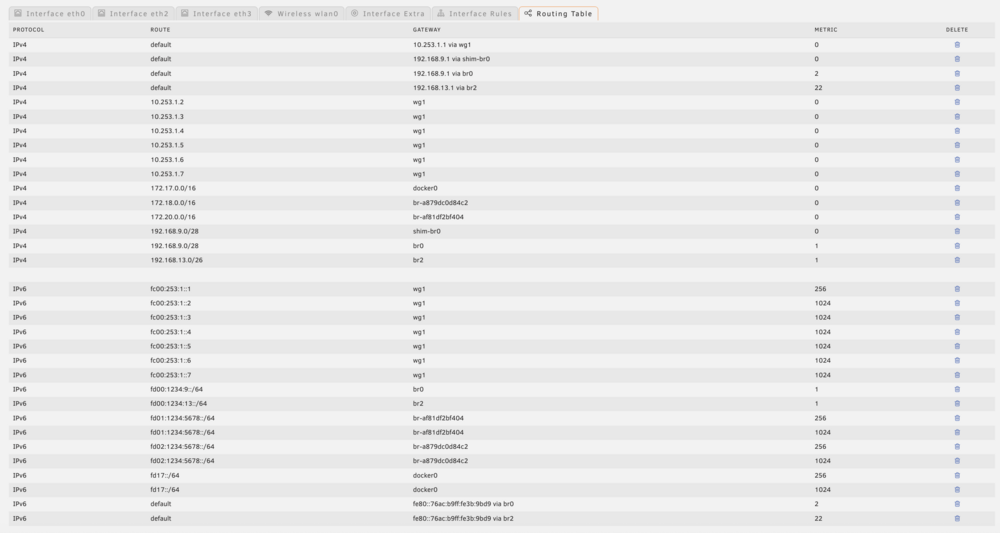
Hi host access to custom networks via ipv6 does not seem to be working. My unraid server is 192.168.9.2, and the container has ipv4 - 192.168.9.3, and ipv6 fd00:1234:9::3 From my unraid server, I cannot ping fd00:1234:9::3, but can successfully ping 192.168.9.3: root@Param:~# ip route show default via 192.168.9.1 dev shim-br0 default via 192.168.9.1 dev br0 metric 2 default via 192.168.13.1 dev br2 metric 22 10.253.1.2 dev wg1 scope link 10.253.1.3 dev wg1 scope link 10.253.1.4 dev wg1 scope link 10.253.1.5 dev wg1 scope link 10.253.1.6 dev wg1 scope link 10.253.1.7 dev wg1 scope link 172.17.0.0/16 dev docker0 proto kernel scope link src 172.17.0.1 172.18.0.0/16 dev br-a879dc0d84c2 proto kernel scope link src 172.18.0.1 172.20.0.0/16 dev br-af81df2bf404 proto kernel scope link src 172.20.0.1 192.168.9.0/28 dev shim-br0 proto kernel scope link src 192.168.9.2 192.168.9.0/28 dev br0 proto kernel scope link src 192.168.9.2 metric 1 192.168.13.0/26 dev br2 proto kernel scope link src 192.168.13.2 metric 1 192.168.122.0/24 dev virbr0 proto kernel scope link src 192.168.122.1 linkdown root@Param:~# ping 192.168.9.3 PING 192.168.9.3 (192.168.9.3) 56(84) bytes of data. 64 bytes from 192.168.9.3: icmp_seq=1 ttl=64 time=0.022 ms 64 bytes from 192.168.9.3: icmp_seq=2 ttl=64 time=0.032 ms ^C --- 192.168.9.3 ping statistics --- 2 packets transmitted, 2 received, 0% packet loss, time 1051ms rtt min/avg/max/mdev = 0.022/0.027/0.032/0.005 ms root@Param:~# ping6 fd00:1234:9::3 PING fd00:1234:9::3 (fd00:1234:9::3) 56 data bytes From fd00:1234:9::2 icmp_seq=1 Destination unreachable: Address unreachable From fd00:1234:9::2 icmp_seq=2 Destination unreachable: Address unreachable From fd00:1234:9::2 icmp_seq=3 Destination unreachable: Address unreachable ^C --- fd00:1234:9::3 ping statistics --- 4 packets transmitted, 0 received, +3 errors, 100% packet loss, time 3113msBut I can ping that container from another computer in my network: ping6 fd00:1234:9::3 PING6(56=40+8+8 bytes) fd00:1234:1:0:1853:65cd:d651:4bd1 --> fd00:1234:9::3 16 bytes from fd00:1234:9::3, icmp_seq=0 hlim=63 time=2.959 ms 16 bytes from fd00:1234:9::3, icmp_seq=1 hlim=63 time=3.777 ms 16 bytes from fd00:1234:9::3, icmp_seq=2 hlim=63 time=3.224 ms ^C --- fd00:1234:9::3 ping6 statistics --- 3 packets transmitted, 3 packets received, 0.0% packet loss round-trip min/avg/max/std-dev = 2.959/3.320/3.777/0.341 msMy unraid server can ping other ipv6 addresses, so it is not an ipv6 config issue: root@Param:~# ping6 fd00:1234:12::3 PING fd00:1234:12::3 (fd00:1234:12::3) 56 data bytes 64 bytes from fd00:1234:12::3: icmp_seq=1 ttl=63 time=0.627 ms 64 bytes from fd00:1234:12::3: icmp_seq=2 ttl=63 time=0.571 ms ^C --- fd00:1234:12::3 ping statistics --- 2 packets transmitted, 2 received, 0% packet loss, time 1058ms rtt min/avg/max/mdev = 0.571/0.599/0.627/0.028 msHere is a screenshot of my routing table. There is no equivalent ipv6 shim-br0 network. Is that the issue?
-
I often see posts automatically assuming user error in not binding logs etc. to persistent storage as the reason for a large docker volume. While that can be true, there are many cases when the docker images might be large adding up to the large docker volume. This post is to help definitively answer that. Images, Containers, Volumes... If Images are taking up most of the space, then you are running containers with large images, and it is likely not a case of incorrect mapping. Run the following command: docker system df This is the output from my system: TYPE TOTAL ACTIVE SIZE RECLAIMABLE Images 61 57 41.74GB 2.207GB (5%) Containers 65 57 4.406GB 82.56kB (0%) Local Volumes 525 7 6.082GB 6.081GB (99%) Build Cache 119 0 938.1MB 938.1MB As you can see, I do have containers that have large images. Lets see what they are List all containers in descending order of image size: docker ps --format "{{.ID}}\t{{.Image}}" | while read id image; do size=$(docker image inspect $image --format='{{.Size}}'); echo -e "$size\t$id\t$image"; done | sort -nr | awk '{printf "%.2f MB\t%s\t%s\n", $1/1024/1024, $2, $3}' Here is a sample of output in my system: 4650.39 MB 8a3dea858fc2 ghcr.io/blakeblackshear/frigate:stable-tensorrt 3891.40 MB dfe0cd71485d sameersbn/gitlab 3125.77 MB 0ecd52d154a3 ollama/ollama 2295.23 MB 6479f874c647 ghcr.io/ollama-webui/ollama-webui:main 2240.48 MB 5e76761352ec binhex/arch-qbittorrentvpn 2081.17 MB 62c422a06451 photoprism/photoprism 2081.17 MB 3e4eca35def8 photoprism/photoprism 2081.17 MB 3167b1b03e5e photoprism/photoprism 1695.60 MB b8fdf429129b binhex/arch-lidarr 1655.56 MB 2af5a08e546e binhex/arch-delugevpn:latest 1089.15 MB a59e198c391b bokker/unraidapi-re 931.06 MB dd9d56275356 linuxserver/nextcloud 695.54 MB fca5f682288e sctx/overseerr:latest 669.66 MB a74e31a4cbed metabase/metabase:latest 603.31 MB e7272f88f2fb linuxserver/sonarr:0.6.1385 562.54 MB 47f8de7efd63 ghcr.io/esphome/esphome:stable 532.10 MB 644abfadeb96 rhasspy/wyoming-whisper 490.14 MB 799d4db50a9e golift/telegraf 486.44 MB 73281bc7ba55 ghcr.io/music-assistant/server:latest 462.53 MB 8d897f0f2dce grafana/grafana:latest Based on this, I now can make an informed decision on do I want to remove/delete any of my containers, or if I have enough resources to not be bothered by it. Maybe I can explore if I should bind persistent volume for the tensor models for frigate... I did do that for openvscodeserver, where I was able to bind all binaries to persistent storage Tell me more about the container - do I have containers with volumes unintentionally bound to the docker volume? While you can also see this in Unraid UI, if you are someone like me running way too many containers, it might be easier to analyze an output from CLI. This is what I used: docker inspect --format="{{ .Name }} {{ .Mounts }}" $(docker ps -aq) Sample output in my system: /prometheus [{bind /mnt/cache_appdata/appdata/prometheus/etc /etc/prometheus rw true rprivate} {bind /mnt/cache_appdata/appdata/prometheus/data /prometheus rw true rprivate}] /jackettvpn [{volume 9fbfc9969581ff252cfc8d18626e600ae4359baf52834b1be0e5d34d42276234 /var/lib/docker/volumes/9fbfc9969581ff252cfc8d18626e600ae4359baf52834b1be0e5d34d42276234/_data /blackhole local true } {bind /mnt/cache_appdata/appdata/jackettvpn /config rw true rprivate}] /QDirStat [{bind /tmp /ram rw true rprivate} {bind /var /var_dir rw true rslave} {bind /mnt/cache_appdata/appdata/QDirStat /config rw true rprivate} {bind /mnt /storage ro false rprivate}] /crowdsec [{bind /mnt/cache_appdata/appdata/traefik/crowdsec /etc/crowdsec rw true rprivate} {bind /mnt/cache_appdata/appdata/traefik/log /var/log/traefik ro false rprivate} {bind /mnt/cache_appdata/appdata/nextcloud/log /var/log/nextcloud ro false rprivate} {bind /mnt/cache_appdata/appdata/traefik/crowdsec/log /var/log rw true rprivate} {bind /mnt/cache_appdata/appdata/bitwarden/bitwarden.log /var/log/bitwarden/bitwarden.log ro false rprivate} {bind /mnt/cache_appdata/appdata/traefik/crowdsec/data /var/lib/crowdsec/data rw true rprivate}] /nextcloud [{bind /mnt/cache_appdata/appdata/nextcloud /config rw true rprivate} {bind /mnt/user/nextcloud /data rw true rprivate}] Lastly, some basic housekeeping: Prune dangling images ie. images that are no longer needed because you removed the container: docker image prune If you want to prune images of any container that is currently stopped/paused: docker image prune -a Hope this is helpful!
-
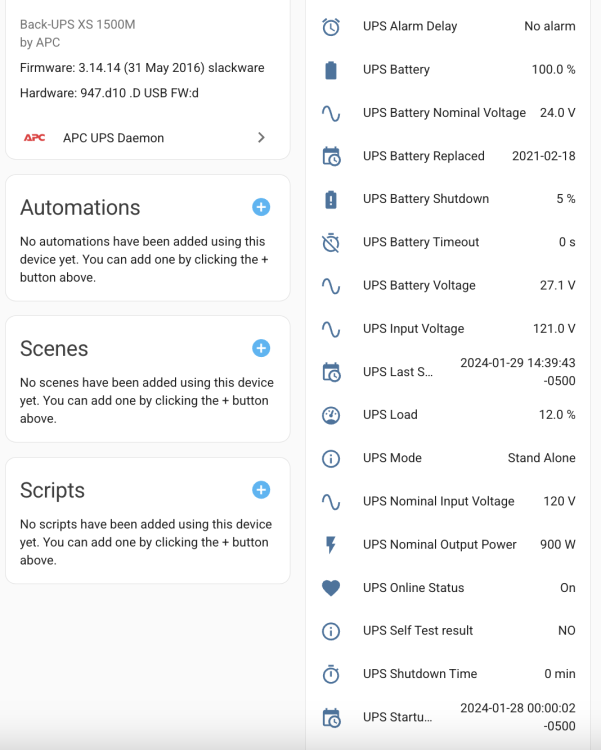
Thanks for checking. Just sent it your way. @BlaM - I use the APC UPS integration in HA to extract UPS information from my Unraid server:
-
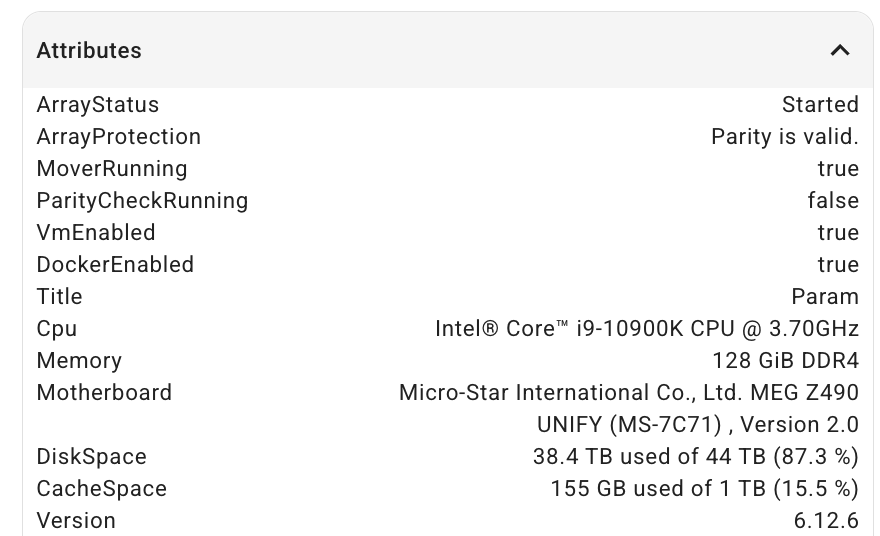
Submitted a PR - it worked in my server running 6.12.6:
-
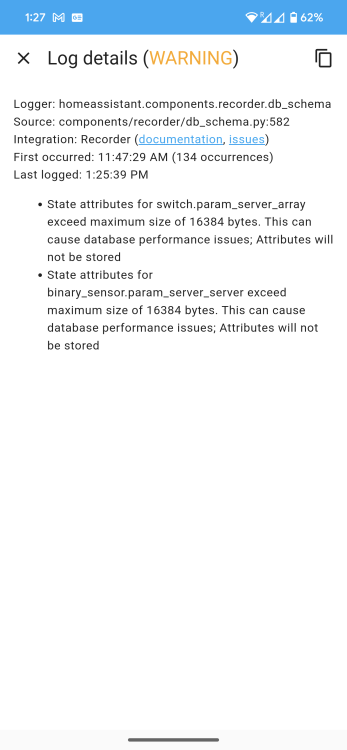
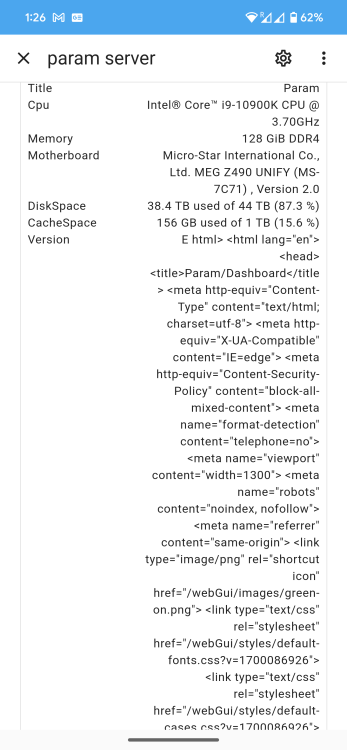
Hi. Thanks for reviving this great tool! I have been getting mqtt warnings in HA, and I believe it's because the Version attribute isn't getting correctly parsed. Attaching screenshots for more clarity
-
Now even 1 url do not work -
-
Not working for me either
-
Same problem here. Attached diagnostics. Comes up every few months requiring me to reboot the server param-diagnostics-20230413-0109.zip
-
Looks like this was never resolved. I tried with pci passthrough, attaching the webcam and passing through USB device as XHCI 3.0, NEC3.0 but with no luck. With XHCI3.0, the face unlock works, and with pcie passthrough, the camera shows image but with artifacts and lag
-
Facing this same issue. I have tried passing through a USB card through pcie, attaching and just passing through the webcam - both qemu xhci, and the other 3.0 option in usb controller. The webcam does not work properly
-
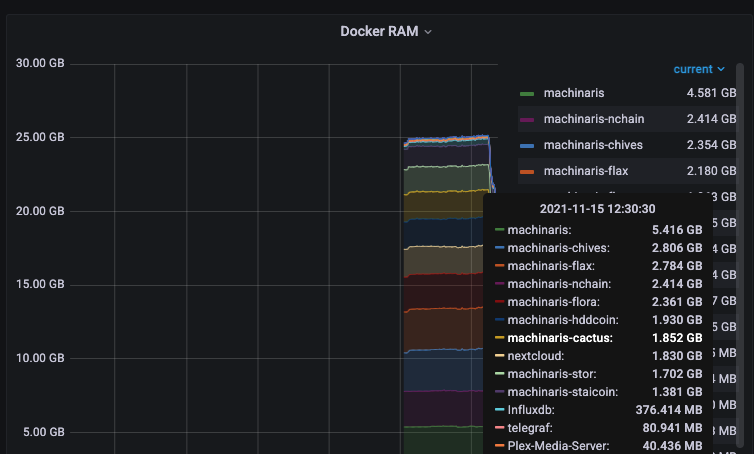
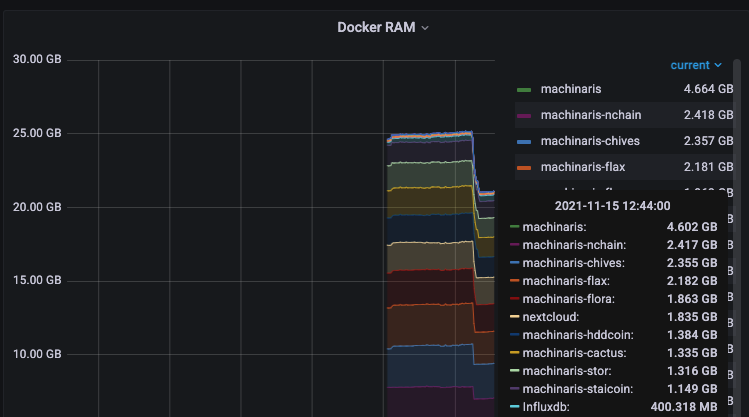
I have some nice telemetry in my server, so did some testing. @guy.davis there is a good amount of saving if wallet is stopped. The saving is higher the older the blockchain, which kind of makes sense. Here are a few screenshots: RAM without any tweaks: RAM after the wallet was stopped for a few of the forks: One way to solve for RAM could be to create SWAP. I also use my server to plot using ramdisk (ramfs). Since I only have 128GB RAM, and all these forks running, I use swap to ensure there is no OOM while I am plotting.
-
Ya. Well strictly speaking they don’t work only because the k is different. The keys are same.
-
Chia and a few of its forks (except Chives) uses k32+. So below k32 plots won't work. In short - Chia and Chives plots are not cross compatible