





KillerK
Members
-
Joined
-
Last visited
Everything posted by KillerK
-
Confirmed bug... https://github.com/unraid/api/issues/1914
-
Hi @JorgeB sorry to be a pain but I think this post would be better in the 112-unraid-api-support section rather than this one, are you able to move it please?
-
My first time playing with the API and Connect. Connecting to unraid.net seems to work but the gui states errors but I cannot find the associated logs to know the detail. Also had issues connecting an OIDC Provider which I've not yet resolved but it was a cert validation issue. I noticed the timestamps in the graphql-api.log were adrift from the system time, before I lose more time tshooting my OIDC stuff I'm bothered about the time drift. NTP is configured and working, hardware and software clocks are in sync. syslog timestamps all as expected. root@blackrack:/# echo "System Time: $(date)"; echo "Hardware Time: $(hwclock --show)" System Time: Fri Mar 13 20:58:10 GMT 2026 Hardware Time: 2026-03-13 20:58:10.218973+00:00 root@blackrack:/# logger "Test timestamp" root@blackrack:/# tail -n1 /var/log/syslog Mar 13 20:58:14 blackrack root: Test timestamp Yet for the API... root@blackrack:/# unraid-api stop [PM2] [unraid-api](0) ✓ root@blackrack:/# rm /var/log/graphql-api.log root@blackrack:/# echo "System Time: $(date)"; echo "Hardware Time: $(hwclock --show)" System Time: Fri Mar 13 20:59:01 GMT 2026 Hardware Time: 2026-03-13 20:59:01.975691+00:00 root@blackrack:/# unraid-api start Starting the Unraid API [PM2][WARN] Applications unraid-api not running, starting... [PM2][WARN] App unraid-api has option 'wait_ready' set, waiting for app to be ready... [PM2] App [unraid-api] launched (1 instances) +--- unraid-api namespace : default version : 4.29.2+c39b0b26 pid : 608133 pm2 id : 0 status : online mode : fork restarted : 0 uptime : 1s memory usage : 224.9mb error log : /var/log/graphql-api.log watching : no PID file : /var/log/.pm2/pids/unraid-api-0.pid root@blackrack:/# tail -n5 /var/log/graphql-api.log [20:03:07 INFO NestApplication]: Nest application successfully started {"apiVersion":"4.29.2+c39b0b26","logger":"api","context":"NestApplication"} [20:03:07 INFO api]: Server listening on /var/run/unraid-api.sock {"apiVersion":"4.29.2+c39b0b26","logger":"api"} [20:03:07 INFO api]: Nest Server is now listening {"apiVersion":"4.29.2+c39b0b26","logger":"api"} [20:03:07 INFO app]: Startup complete in 582ms {"apiVersion":"4.29.2+c39b0b26"} [20:03:08 INFO MothershipGraphqlClientService]: Connected to wss://mothership.unraid.net/ws {"apiVersion":"4.29.2+c39b0b26","logger":"api","context":"MothershipGraphqlClientService"} Any help appreicated.
-
Thank you, worked a charm!
-
I want to proactively replace the disks in my special vdev mirror as the current ones are old. The new disks are larger in size and I have the space to add these into the chassis without removing the old drives. Checking is this guide (https://forums.unraid.net/topic/46802-faq-for-unraid-v6/#comment-480419) sill valid and does it apply for special vdevs? Thanks
-
I only started looking at flash usage because of system performance or more specifically the unraid UI being laggy. It's an assumption but I believe this was triggered as I had overridden unraids default zfs max arc limit to more fully utilise the available ram. Then once the system was being loaded that's when I noted the increasing read counts. The way the fastusr note in the changelog reads about flash usage its not a simple if x do y and infers their is an amount read which is acceptable but doesn't clarify this. Hence my question.
-
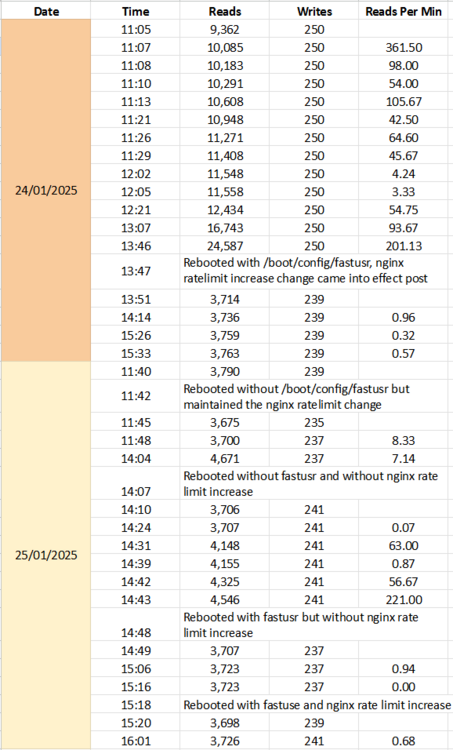
Concluding this thread now and answering a couple of my own questions hoping others might find it useful. What is classed as excessive? In my testing anything over 1 read per minute of the flash drive would be excessive. Where my results above a concern? Yes, as they exceeded the above and at worst were over 200 reads per minute. The resolution was to apply the /boot/config/fastusr config which @Kilrah kindly confirmed. I did retest my scenarios today by again removing the nginx rate limit alteration and re-ran with and without the fastusr fix. I my usecase I pushed the ZFS Arc to the max, kept the server busy with various activities and managed to replicate the issue by then browsing the unraid UI which by then slow which then started to notch up the read counter on the flash drive.
-
So addional question if I may. I realised there is something else I am/was messing with in addition to the ZFS Max Arc limit. I'd temporarily removed a boot time modification I'd previously made to nginx's rate limiting so this was back to stock during the time period I was seeing the high flash usage. I forgot about this when I added the /boot/config/fastusr file and rebooted about 30 mins ago but I'm now seeing a much improved as in reduced read amount on the flash storage. I know I've muddied the water with the 2 changes at the same time but could the rate limit change be involved here, the below is in my /boot/config/go file... /usr/bin/sed -i "s;zone=authlimit:1m rate=30r/m;zone=authlimit:1m rate=60r/s;g" /etc/nginx/nginx.conf
-
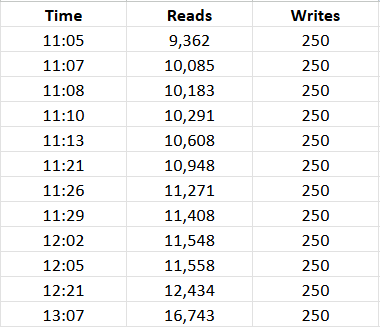
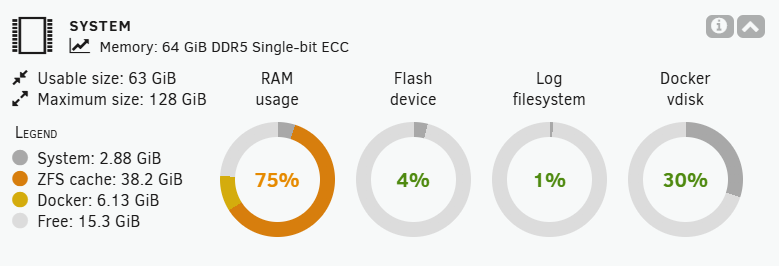
I noted this item in the 7.0.0 changelog, have never thought about it nor looked at it previously. Fortunately/unfortunately I'm now curious so I guess my first question is...What is classed as "excessive"? I decided to manually capture the below to create a baseline of sorts and I also did a little forum surfing. So my second question... Are the results that I've captured today concerning? For the 1 hour up to 13:07 I ran the below... # inotifywatch -r -t 3600 /boot Establishing watches... Finished establishing watches, now collecting statistics. total access close_nowrite open filename 84684 28230 28227 28227 /boot/config/shares/ 60702 22978 18870 18854 /boot/config/ 43866 35444 4211 4211 /boot/ 37377 12459 12459 12459 /boot/config/plugins/dynamix/ 4796 2398 1199 1199 /boot/config/plugins/dynamix/notifications/agents/ 4796 2398 1199 1199 /boot/config/plugins/dynamix/notifications/ 2464 1120 672 672 /boot/config/plugins/dockerMan/templates/limetech/ 2464 1568 448 448 /boot/config/plugins/dockerMan/ 2240 1344 448 448 /boot/config/plugins/dockerMan/templates/ 1659 553 553 553 /boot/config/plugins/ipmi/ 1344 896 224 224 /boot/config/plugins/dockerMan/templates-user/ 342 114 114 114 /boot/config/plugins/gpustat/ 100 88 6 6 /boot/config/plugins/ 27 9 9 9 /boot/config/plugins/community.applications/ 18 6 6 6 /boot/config/plugins/zfs.master/ 15 5 5 5 /boot/config/plugins/compose.manager/ 4 2 1 1 /boot/config/wireguard/ As of typing my dashboard reports the below, this is largely typical from my observations... The only change I've implemented recently other than the upgrade to 7 is to increase my ZFS Arc Max limit and to add a L2 Arc to one of my pools. I've not implemented the fix mentioned in the change log, from my read it sound like a worthwhile activity as 500MB RAM is nothing really, I'm just interested to get a proper view on the above. Thanks, K
-
Odd, I made sure last night the docker-compose.override.yml files were updated and rebooted the server earlier today after making some zfs changes. However now after doing a down and up the containers are correctly reporting. Apprecaite the help.
-
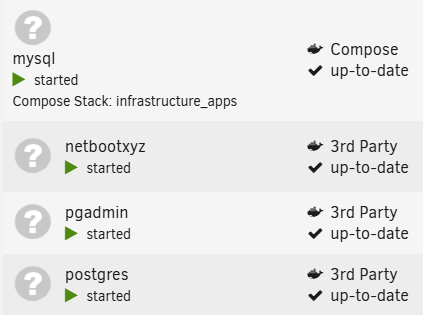
So one of my stacks is called 'other_apps' because I'm a creative type 🤔 It has 5 containers described, 3 of which correctly report as part of the stack on the 'Docker' UI page but 2 don't. Interestingly or not the 2 that don't are the last 2 additions (and the last 2 in the below insert) but were added a while back and not together at the same time. # cat /boot/config/plugins/compose.manager/projects/other_apps/docker-compose.override.yml services: myadmin: labels: net.unraid.docker.managed: 'composeman' net.unraid.docker.icon: '' net.unraid.docker.webui: '' net.unraid.docker.shell: '' esphome: labels: net.unraid.docker.managed: 'composeman' net.unraid.docker.icon: '' net.unraid.docker.webui: '' net.unraid.docker.shell: '' bab_wordpress: labels: net.unraid.docker.managed: 'composeman' net.unraid.docker.icon: '' net.unraid.docker.webui: '' net.unraid.docker.shell: '' pgadmin: labels: net.unraid.docker.managed: 'composeman' net.unraid.docker.icon: '' net.unraid.docker.webui: '' net.unraid.docker.shell: '' netbootxyz: labels: net.unraid.docker.managed: 'composeman' net.unraid.docker.icon: '' net.unraid.docker.webui: '' net.unraid.docker.shell: '' There is a clear difference you can see via docker inspect also... # docker inspect mysql | grep net.unraid "net.unraid.docker.icon": "", "net.unraid.docker.managed": "composeman", "net.unraid.docker.shell": "", "net.unraid.docker.webui": "" # docker inspect pgadmin | grep net.unraid # docker inspect netbootxyz | grep net.unraid Now I am guilty of bypassing the UI and using SSH to administer my containers including updating the compose files and starting/downing stacks. However even after manually renewing the config via the UI this isn't being corrected unless there is some linkage to a reboot I've not yet tried?
-
Hi, have noticed a couple of things since upgrading to unraid 7. The 'Docker' tab in the UI doesn't show correctly that containers are part of a compose stack. Some do and some dont but all my containers belong to 1 of 6 stacks. I've re-saved the compose file via the UI to regenerate the docker-compose.override.yml files in the projects directory but the below is still happening, obviously no actual functionality issues and all cosmetic. I've started to receive this message when starting a stack, is this the compose pluging or docker where I need to research? matter Migrated sysctl "net.ipv6.conf.eth0.accept_ra_rt_info_max_plen" to DriverOpts{"com.docker.network.endpoint.sysctls":"net.ipv6.conf.IFNAME.accept_ra_rt_info_max_plen=64"} Any pointers appreicated. Thanks K
-
Sorry if this is dumb but I *think* I've backed up my IPMI configuration previous as I have file in my backup folder called IPMI_CONFIG_BACKUP.bin. But for the life of me I can't remember how I obtained it neither can I now re-find anything in the unraid UI or docs which detail it. Any help apprecaited?
-
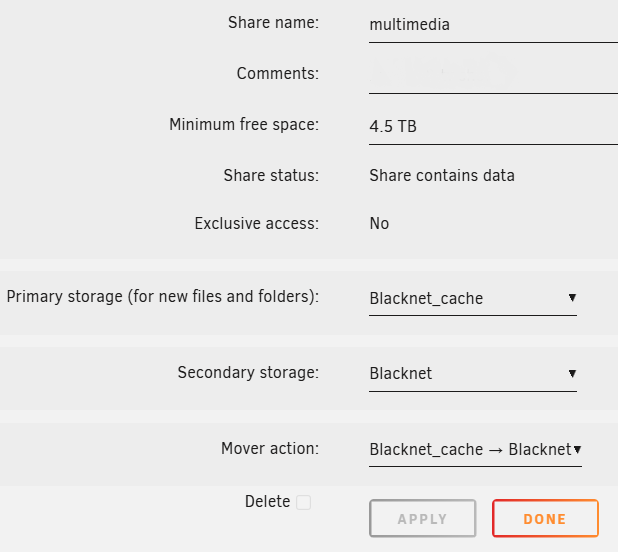
So I have a zpool called 'blacknet' which is the original primary storage for a share called 'multimedia'. I've just created a new zpool called 'blacknet_cache' and have amended the 'multimedia' share as per the below... So I then do the following... # cd /mnt/user/multimedia/ # mkdir share_test # cd share_test/ # touch tester.test # ls -l total 1 -rw-rw-rw- 1 root root 0 Jan 20 13:26 tester.test # ls -l /mnt/blacknet_cache/ total 0 # ls -l /mnt/blacknet/multimedia/ total 1 drwxrwxrwx 2 root root 3 Jan 20 13:26 share_test/ # ls -l /mnt/blacknet/multimedia/share_test/ total 1 -rw-rw-rw- 1 root root 0 Jan 20 13:26 tester.test This shows that new folders and files are still being directly written to the blacknet zpool which is configured as the secondary storage for the share. The mover process is currently set to run every 2 hours and hasn't run here yet so thats not the problem. The only other nuance I have which could be involved here is that previously I created a zfs dataset called multimedia on the blacknet pool with a mountpoint of /mnt/blacknet/multimedia. Could this be causeing this behaviour? EDIT: Creating a new share and works as expected with data first written to blacknet_cache and the mover then moves it to blacknet when triggered. So my problem only relates to a pre-existing share.
-
All my shares just used primary storage and had exclusive access = yes, however the recent upgrade to 7.0.0 allowed me to free up some old sata ssd's which I was using as the Array device and were doing nothing. I want to test a shares performance by adding these newly available drives as the primary storage aka cache for a pre-existing share. I can amend the share configuration with no issue selecting the new pool as primary and the old/original pool as secondary. This saves, the /mnt/user directory no longer symlinks to the pool device so exclusive access for the share now = no, so far so good. I suspect my test case is wrong, should I be writing new files/folders to the share name under /mnt/user and should I expect them to appear in /mnt/new-primary-cache-pool until the mover process runs which then moves them to the old/original pool device under /mnt?
-
@JorgeB Came here for similar reasons, I'm running 7.0.0 2025-01-09. Please can you check my understanding... (Array started) zpool remove blacknet sdf1 (Array started) zpool remove blacknet sdg1 (Array stopped) Via the 'Main' menu select the blacknet pool device and click 'Remove Pool' (Array stopped) Back to the 'Main' menu and click 'Add Pool' and re-create the blacknet pool with 4 slots (Array stopped) Add back into each of the 4 slots the disks associated to the blacknet pool (Do I have to ensure the same disk goes into the same slot?) Start the Array and the old zpool should re-import with all my data intact? Sorry if I'm being pedantic but I can't afford to backup 100% of my data so I just want to minimise as much risk as possible. pool: blacknet state: ONLINE status: Some supported and requested features are not enabled on the pool. The pool can still be used, but some features are unavailable. action: Enable all features using 'zpool upgrade'. Once this is done, the pool may no longer be accessible by software that does not support the features. See zpool-features(7) for details. scan: scrub repaired 0B in 18:05:51 with 0 errors on Wed Jan 1 21:05:53 2025 config: NAME STATE READ WRITE CKSUM blacknet ONLINE 0 0 0 raidz1-0 ONLINE 0 0 0 sdb1 ONLINE 0 0 0 sdc1 ONLINE 0 0 0 sdd1 ONLINE 0 0 0 sde1 ONLINE 0 0 0 cache sdf1 ONLINE 0 0 0 sdg1 ONLINE 0 0 0
-
Thanks for the good documentation and hardwork with 7.0.0 my upgrade went smoothly as a result of the prep I was able to do. Since upgrade I noted a kernel warning at boot time which I think is new but doesn't look to be causing any real issues I've found so far. My google foo gets me to this patch note which best I can tell suggests the devs don't know if this is a thing worth the dev time or not. Can also see here that its flagged still in the source. Can anyone with any experience here confirm if I can comfortably ignore this? Should I be taking some action etc? Thanks [ 13.624780] ------------[ cut here ]------------ [ 13.624798] i915 0000:00:02.0: Port A asks to use VBT vswing/preemph tables [ 13.624827] WARNING: CPU: 5 PID: 1270 at drivers/gpu/drm/i915/display/intel_bios.c:2645 intel_bios_init+0x13af/0x143c [i915] [ 13.625027] Modules linked in: kvm_intel(+) i915(+) kvm crct10dif_pclmul crc32_pclmul crc32c_intel ghash_clmulni_intel sha512_ssse3 sha256_ssse3 sha1_ssse3 aesni_intel crypto_simd cryptd iosf_mbi drm_buddy ttm drm_display_helper ast drm_shmem_helper i2c_algo_bit rapl drm_kms_helper mei_hdcp mei_pxp ipmi_ssif intel_cstate zfs(PO+) spl(O) drm intel_gtt wmi_bmof i2c_i801 nvme mei_me agpgart i2c_smbus input_leds cdc_ether ahci acpi_ipmi usbnet intel_uncore e1000e igc nvme_core led_class mei joydev i2c_core libahci mii video ipmi_si wmi backlight acpi_tad acpi_pad thermal button fan [ 13.625211] CPU: 5 PID: 1270 Comm: udevd Tainted: P O 6.6.68-Unraid #1 [ 13.625243] Hardware name: Supermicro Super Server/X13SAE-F, BIOS 4.1 10/01/2024 [ 13.625270] RIP: 0010:intel_bios_init+0x13af/0x143c [i915] [ 13.625455] Code: 48 8b 7d 08 48 8b 6f 50 48 85 ed 75 03 48 8b 2f e8 e4 d4 77 e0 44 89 f9 48 89 ea 48 c7 c7 1c b9 18 a1 48 89 c6 e8 03 be 0e e0 <0f> 0b 48 8b 5b 38 e9 cb fd ff ff 48 8b 7c 24 18 41 8d 75 18 e8 16 [ 13.626198] RSP: 0018:ffffc9000086faf0 EFLAGS: 00010282 [ 13.626994] RAX: 0000000000000000 RBX: ffff888140462b40 RCX: 0000000000000003 [ 13.627815] RDX: 00000000011ce400 RSI: 0000000000000003 RDI: 00000000ffffffff [ 13.628627] RBP: ffff888102247470 R08: 0000000000000000 R09: ffff8881011ce400 [ 13.629406] R10: 0000000000000001 R11: ffffc90001a38020 R12: ffff888140180000 [ 13.630220] R13: 0000000000000000 R14: 0000000000000000 R15: 0000000000000041 [ 13.631033] FS: 0000153aa8f67740(0000) GS:ffff88903f740000(0000) knlGS:0000000000000000 [ 13.631855] CS: 0010 DS: 0000 ES: 0000 CR0: 0000000080050033 [ 13.632656] CR2: 0000153aa8b59000 CR3: 0000000105346000 CR4: 0000000000750ee0 [ 13.633394] PKRU: 55555554 [ 13.634109] Call Trace: [ 13.634792] <TASK> [ 13.635498] ? __warn+0x99/0x11a [ 13.636221] ? report_bug+0xd9/0x153 [ 13.636959] ? intel_bios_init+0x13af/0x143c [i915] [ 13.637958] ? handle_bug+0x53/0x7c [ 13.638759] ? exc_invalid_op+0x13/0x60 [ 13.639525] ? asm_exc_invalid_op+0x16/0x20 [ 13.640285] ? intel_bios_init+0x13af/0x143c [i915] [ 13.641227] intel_display_driver_probe_noirq+0x21/0x25f [i915] [ 13.642124] i915_driver_probe+0x6fd/0x9f7 [i915] [ 13.642983] ? __pfx___driver_attach+0x10/0x10 [ 13.643664] local_pci_probe+0x3d/0x81 [ 13.644345] pci_device_probe+0x17c/0x1d0 [ 13.645050] ? sysfs_do_create_link_sd+0x7a/0xab [ 13.645744] really_probe+0x115/0x269 [ 13.646425] __driver_probe_device+0xc0/0xf2 [ 13.647096] driver_probe_device+0x1f/0x77 [ 13.647758] __driver_attach+0xdc/0xf5 [ 13.648439] bus_for_each_dev+0x7b/0xc2 [ 13.649101] bus_add_driver+0xf4/0x1df [ 13.649741] driver_register+0x9e/0xdc [ 13.650411] i915_init+0x1f/0x7f [i915] [ 13.651169] ? __pfx_i915_init+0x10/0x10 [i915] [ 13.651897] do_one_initcall+0x80/0x1a4 [ 13.652548] ? kmalloc_trace+0x43/0x52 [ 13.653188] do_init_module+0x60/0x20d [ 13.653822] __do_sys_init_module+0xbc/0xfd [ 13.654412] do_syscall_64+0x57/0x7b [ 13.654994] entry_SYSCALL_64_after_hwframe+0x78/0xe2 [ 13.655558] RIP: 0033:0x153aa97629aa [ 13.656099] Code: 48 8b 0d 61 a4 0d 00 f7 d8 64 89 01 48 83 c8 ff c3 66 2e 0f 1f 84 00 00 00 00 00 0f 1f 44 00 00 49 89 ca b8 af 00 00 00 0f 05 <48> 3d 01 f0 ff ff 73 01 c3 48 8b 0d 2e a4 0d 00 f7 d8 64 89 01 48 [ 13.657205] RSP: 002b:00007ffe2fa8c678 EFLAGS: 00000246 ORIG_RAX: 00000000000000af [ 13.657737] RAX: ffffffffffffffda RBX: 00000000004607c0 RCX: 0000153aa97629aa [ 13.658268] RDX: 0000153aa9860379 RSI: 00000000006907c0 RDI: 0000153aa8600010 [ 13.658787] RBP: 0000153aa8600010 R08: 0000000000000007 R09: 0000000000000006 [ 13.659309] R10: 0000000000000071 R11: 0000000000000246 R12: 0000153aa9860379 [ 13.659829] R13: 0000000000020000 R14: 00000000004861b0 R15: 0000000000000000 [ 13.660272] </TASK> [ 13.660770] ---[ end trace 0000000000000000 ]---
-
***Health warning*** I'm still learning k8s so there may be concerns with my solution. My reasons for doing this were to get away from using minikube on my Windows workstation, the course I was following was written for linux hosts and I was fed up with having to hack around the material to work in Windows. I had my unraid server with both docker and kvm enabled so I wanted to be able to follow the courseware using that. So after lots of failed attempts and reading I gave up with attempting to get minikube to use a macvtap network, I don't believe its possible by design. Instead I focused on how to get the dashboard accessible via the bridge networks using minikubes docker or kvm2 driver. Start minikube on the unraid server as normal (--force needed as unraid is root by default which minikube complains about): minikube start --force --driver=docker We cannot use the minikube binary to invoke the dashboard as there is no way I've found to enable remote access/get the local proxy instance listening to anything other than 127.0.01. So to bypass minikuke first manually enable the needed addons: minikube addons enable dashboard minikube addons enable metrics-server To then get to the k8s web dashboard from a remote client, instead of running 'minikube --dashboard' use: kubectl proxy --address=0.0.0.0 --port=freeport --accept-hosts='.*' This does allow you to configure the proxy to accept remote connections (--address=0.0.0.0) and means the dashboard url (http://unraid-server-ip:freeport/api/v1/namespaces/kubernetes-dashboard/services/http:kubernetes-dashboard:/proxy/) will now work with clients on your local subnet.
-
I'm looking to get minikube working with either my custom docker macvlan network or a similar macvtap network for a KVM guest. Out of the box minikube works with either the docker or kvm drivers but the default network makes the dashboard inaccessible. Has anyone had any success at this? I've tried specifying custom network parameters but it would seem minikube isn't happy with them and ignores them and creates its own I've seen the other post here in this forum with a guide on this but thats not a direction I want to take ideally given its manual setup of KVM guests. Any insight would be appreciated.
-
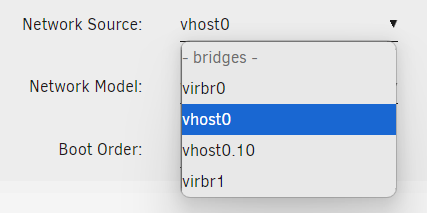
Sorry I think the penny is dropping. So the value I specify as the default source in Network Settings is just to populate the option when creating a new guest in the web interface? FWIW I've definately disabled bridging but I've no issues in creating a guest using either virbr0 or vhost0 and getting a functional guest network working.
-
Is that my issue, because I've not enabled bridging in the Network Settings? I've always used docker and just created a macvlan network against a chosen interface.
-
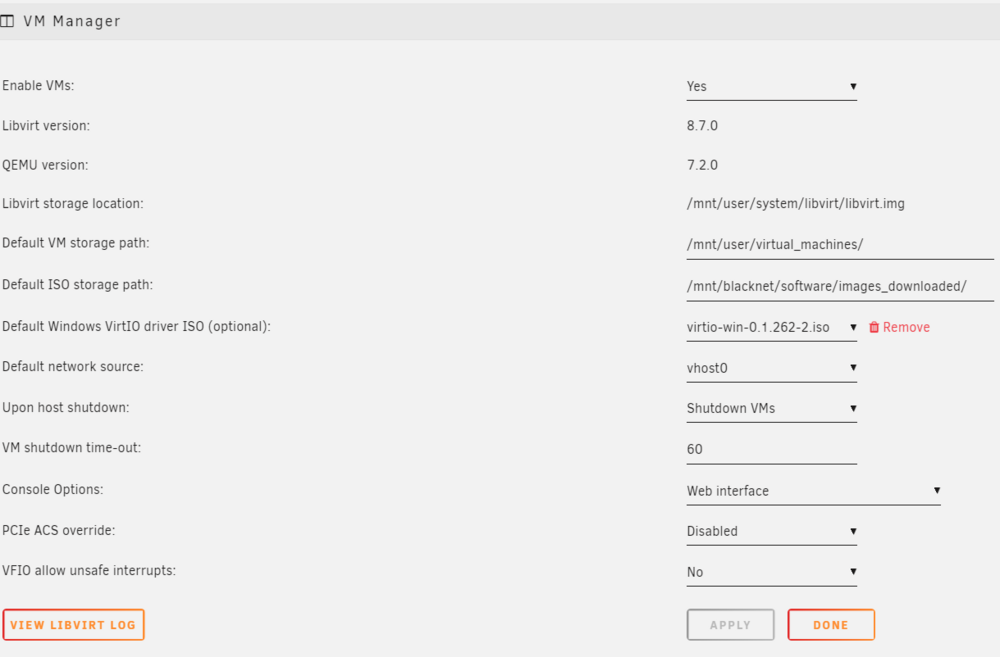
First time really using KVM on unraid and its been an age since I have altogether. Updating settings.... Then I do... # virsh net-list --all Name State Autostart Persistent -------------------------------------------- default active yes yes and # virsh net-info default Name: default UUID: bbb7a68b-ad63-4bcf-8ca2-56cbebd2bb33 Active: yes Persistent: yes Autostart: yes Bridge: virbr0 No matter what I change (using the unraid GUI) I cannot get it to budge of virbr0. My containers are all fine operating off vhost0, am i missing something?
-
So I just found my custom rsyslog changes had reset recently and then scratched my head for a little while to try and remember my hack again to get it working with Loki/Grafana. Anyway on my short little trek I found https://github.com/unraid/webgui/pull/1486 which is a PR for the fix I suggested but which was actually merged into the master branch of unraid in Nov 2023! Sharing because there does seem to be some light in the tunnel, just not sure when its going to reach the end.
-
Comparison for you... ~# ethtool -a eth0 Pause parameters for eth0: Autonegotiate: on RX: on TX: on

-
Could the issue be the transmit end on your Syno? Any kind of DPI on the egress?



