


hogfixer
Members
-
Joined
-
Last visited
Everything posted by hogfixer
-
There is a -cpus="" command, but you have to tell it how many threads it can use You should be able to put the following in the "Extra Parameters" line: --cpus="XX" Replace the XX with 90% of your cpu/threads installed. I have 40 threads and wanted to limit a container to 25%, so i put --cpus="10".
-
Hello, Grasping at straws here. What repository for influxdb are you using? is it "influxdb:1.8.4-alpine"? See this message

-
This is what I used: mkdir /tmp/ramdisk mount -t tmpfs -o size=115G tmpfs /tmp/ramdisk If Machinaris is running before you create the ram disk, you need to restart the Machinaris container, to make sure it picks it up correctly. You can console into the container and type "df -h" to verify paths, drive size, and how much room is available. Filesystem Size Used Avail Use% Mounted on tmpfs 120G 0 120G 0% /plotting2
-
No you do not. You could try changing the IP address from http to https and see if that works.
-
With this error: plotman.configuration.ConfigurationException: madMAx selected as plotter but no plotting: farmer_pk: was specified in the config. Was the farmer key entered correctly?
-
No you do not need a port number. The important part is http or https. I assume you are getting some data from the UnraidAPI? Does the array status panel show Started? Yesterday when i checked the Dynamic Image Panel plugin in Grafana, it said it wasn't loaded because it was unsigned. Check the plugin tab of Grafana for the status of your plugins. IF it was not loaded by Grafana, you will need you add a ini file. I created a conf folder in the Grafana app folder. Next create a file called custom.ini. In the custom.ini file add the following: [plugins] allow_loading_unsigned_plugins = "dalvany-image-panel" Save it. You will need to restart Grafana for it to be loaded After doing the above, i did not need to open the icons in another tab or log into the server again.
-
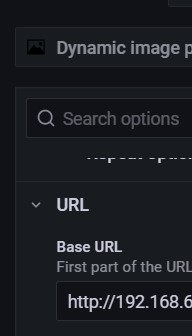
My problem with this was fixed by editing the following. Assuming you have the Dynamic Image Panel plugin installed and unblocked. Check the base url in the Dockers (Running) panel. (see attached) The http or https needs to match the setup for the API docker container. If it says http, change it to https and see if that works. If it does, you will need to change it in each panel, Dockers and VMs.
-
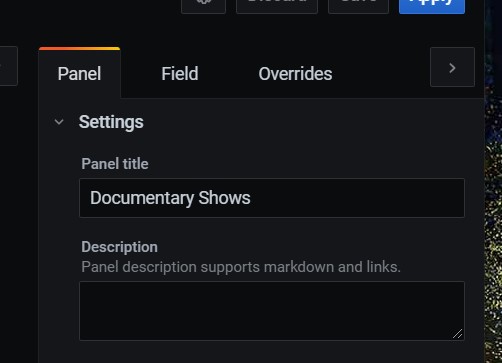
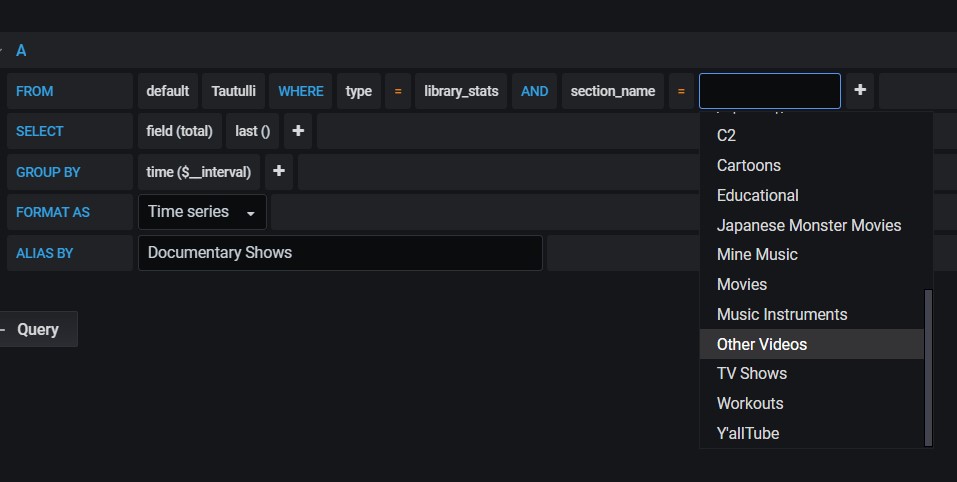
Movies at the end of the FROM line, is a library in Plex. If you left click on it, you should get a list of libraries it found in Plex / Tautulli that you can select from. Your "movies" library in Plex must have a different name. Verify in Tautulli what it is seeing in Plex, under Libraries You will need to reselect the Documentary Movies and Anime Movies panels the same way. Actually, each panel in your top picture will need the same thing done. You will probably want to change the panel title also in each one to reflect what it actually is.
-
If I remember correctly, the backup process shuts down all docker containers.
-
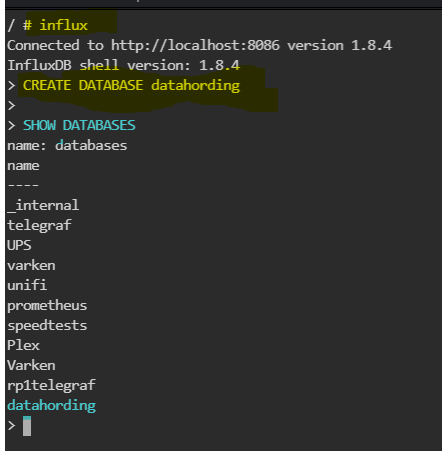
Open a console to influxdb. You should have permission already for what you need. You type influxdb You next type CREATE DATABASE "name" Replace "name" with the name of the database you want to create. You can next type SHOW DATABASES to verify it was created. If you are done with influxdb, you type exit and exit again to close the session and window.
-
I don't use GUS, but that looks like you are correct.
-
Edit the Telegraf Docker container. Select advanced view in the top right. Scroll down to the Post Arguments line. Put the commands you want to run on this line. And Bob's my uncle.

-
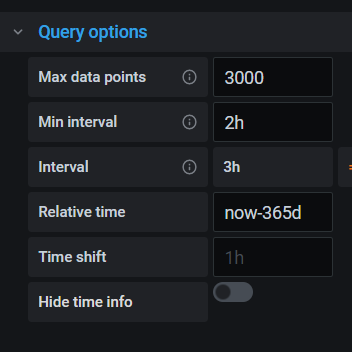
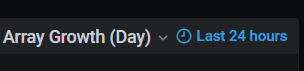
One thing I did was change the displays to the last 24 hours, 7 days, 4 weeks, and 365 days. Under Query Options and Relative Time Today = now-24h Week = now-7d Month = now-30d Year = now-365d You can also turn off the time data on single graphs by selecting Hide time info. (Last 24 hours) below.
-
Like falconexe said, "You need to edit the query by selecting your proper Plex Library section. If your library section names happen to mach the UUD (mine since I'm the developer) exactly, they will just magically work. So edit the panel, head over to the query, and click the library section tag and select from the auto populated drop own menu. Do this for all fo the N/As and you'll be in business." You should also change the Panel title and Alias by fields to the new type of show.
-
Thanks for your hard work.
-
It should be pulling it from the host. Have you tried running 'hostname' from the Unraid console? In Grafana, at the top of the page under the Host dropdown, does it only show the old host name? A somewhat simple way to see what data Influx has, is a container called Chronograf.
-
It may be in the Telegraf config. Line 94 on my config, just above Output Plugins section.
-
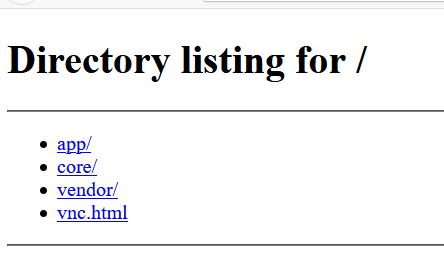
Having the same problem. Get a directory listing when connecting. Using 6.9.0-beta25
-
Did the JSON get taken down? Says unavailable. Thanks


