


Inenting
Members
-
Joined
-
Last visited
Everything posted by Inenting
-
Thank you for your response! Could you clarify how I would go about making this change? The current Docker image I’m using is from the jasonbean/guacamole repository, and the latest version there is 1.5.4. Are you suggesting I switch to the official Docker image, or is there another solution? Ideally, I’d like to continue using the Unraid version for easier management and updates, but if switching is the best option, I’m willing to make the change.
-
Anyone got a fix for this?
-
Are there any updates available? I require version 1.5.5 for the DUO authentication to function properly since version 1.5.4 does not support the new universal prompt, and DUO has discontinued the traditional prompts for new applications. Is it possible for me to manually update the DUO extension? Whenever I attempt to copy the .jar file, it is replaced by version 1.5.4, and if I disable DUO, the new .jar is also removed. Additionally, renaming it to secretplugin.jar does not prompt its usage.
-
Does anyone have a solution because I'm now experiencing this myself as well after having to switch to the nut plugin because the original doesn't quite work right with my ups
-
I am still having this problem on 6.11.1. I got unraid tabs sometimes open on a VM but I can't check everytime if I closed it or not. We need a real solution because the auto reload doesn't seem to work right unfortunately. zeus-diagnostics-20221022-1430.zip
-
-
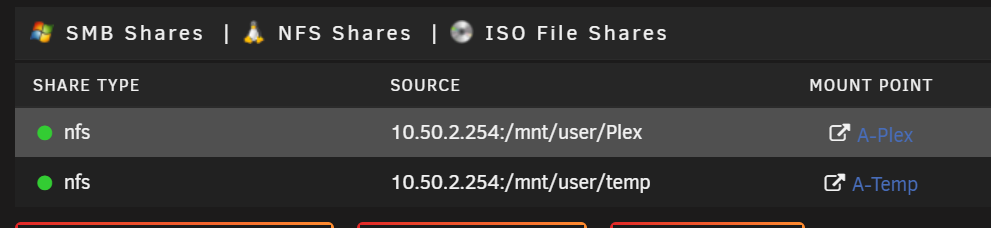
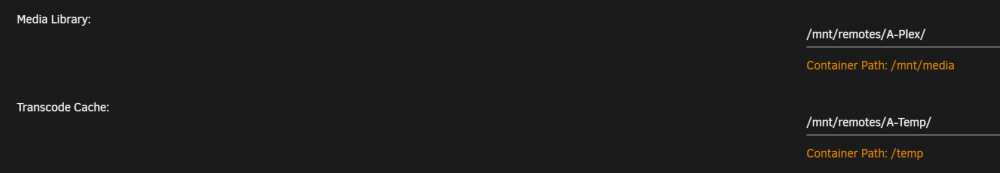
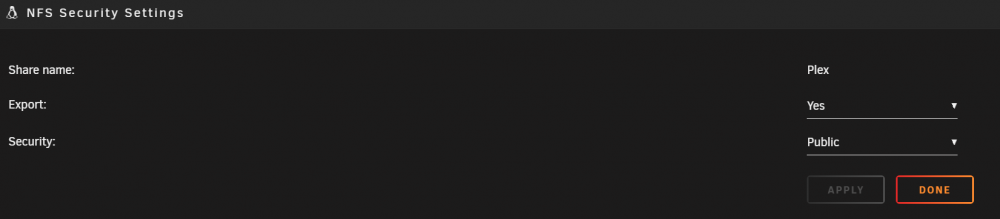
I can't seem to get a tdarr node on another unraid server to work, I keep getting the following error(s) : 2022-04-03T19:42:01.799Z VXk3kw6uhVs:Node[Zeus-Quadro-P620]:Worker[S4bMIcoD4]:[Step W03] [C2] Analyse file 2022-04-03T19:42:01.800Z VXk3kw6uhVs:Node[Zeus-Quadro-P620]:Worker[S4bMIcoD4]:New cache file has already been scanned, no need to scan again 2022-04-03T19:42:01.800Z VXk3kw6uhVs:Node[Zeus-Quadro-P620]:Worker[S4bMIcoD4]:Updating Node relay: Processing 2022-04-03T19:42:01.800Z VXk3kw6uhVs:Node[Zeus-Quadro-P620]:Worker[S4bMIcoD4]:[1/2] Checking file frame count 2022-04-03T19:42:01.801Z VXk3kw6uhVs:Node[Zeus-Quadro-P620]:Worker[S4bMIcoD4]:[2/2] Frame count 0 2022-04-03T19:42:01.801Z VXk3kw6uhVs:Node[Zeus-Quadro-P620]:Worker[S4bMIcoD4]:Transcode task, determining transcode settings 2022-04-03T19:42:01.801Z VXk3kw6uhVs:Node[Zeus-Quadro-P620]:Worker[S4bMIcoD4]:Plugin stack selected 2022-04-03T19:42:01.802Z VXk3kw6uhVs:Node[Zeus-Quadro-P620]:Worker[S4bMIcoD4]:Plugin: Tdarr_Plugin_00td_action_re_order_all_streams_v2 2022-04-03T19:42:01.802Z VXk3kw6uhVs:Node[Zeus-Quadro-P620]:Worker[S4bMIcoD4]:[1/5] Reading plugin 2022-04-03T19:42:01.803Z VXk3kw6uhVs:Node[Zeus-Quadro-P620]:Worker[S4bMIcoD4]:[2/5] Plugin read 2022-04-03T19:42:01.803Z VXk3kw6uhVs:Node[Zeus-Quadro-P620]:Worker[S4bMIcoD4]:[3/5] Installing dependencies 2022-04-03T19:42:01.803Z VXk3kw6uhVs:Node[Zeus-Quadro-P620]:Worker[S4bMIcoD4]:[4/5] Running plugin 2022-04-03T19:42:01.804Z VXk3kw6uhVs:Node[Zeus-Quadro-P620]:Worker[S4bMIcoD4]:Error TypeError: Cannot read property 'forEach' of undefined 2022-04-03T19:42:01.804Z VXk3kw6uhVs:Node[Zeus-Quadro-P620]:Worker[S4bMIcoD4]:Worker config: { 2022-04-03T19:42:01.804Z "processFile": false, 2022-04-03T19:42:01.804Z "preset": "", 2022-04-03T19:42:01.804Z "container": "", 2022-04-03T19:42:01.804Z "handbrakeMode": "", 2022-04-03T19:42:01.804Z "ffmpegMode": "", 2022-04-03T19:42:01.804Z "error": true 2022-04-03T19:42:01.804Z } 2022-04-03T19:42:01.804Z VXk3kw6uhVs:Node[Zeus-Quadro-P620]:Worker[S4bMIcoD4]:Worker log: 2022-04-03T19:42:01.804Z Pre-processing - Re-order all streams V2☒Plugin error! TypeError: Cannot read property 'forEach' of undefined 2022-04-03T19:42:01.804Z 2022-04-03T19:42:01.805Z VXk3kw6uhVs:Node[Zeus-Quadro-P620]:Worker[S4bMIcoD4]:Worker config [-error-]: I also uploaded the Log. Both servers run Unraid and I mapped the Plex and Temp share. I tried both NFS and SMB, the shares are on Export: Yes and Public, I don't see what could be wrong. VXk3kw6uhVs-log.txt C9Hx0dw7N-log.txt
-
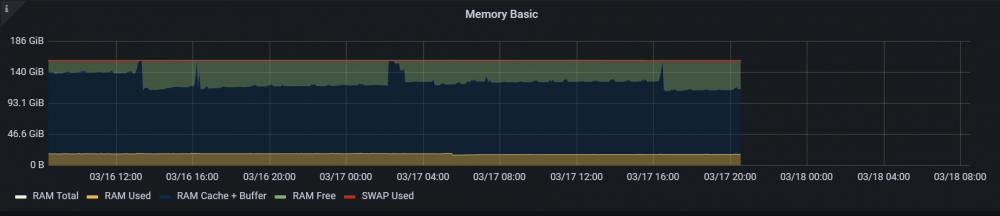
I've got grafana installed with prometheus but I can't see anything out of the ordinary: Does anyone have an explanation for this?
-
I woke up today the moment I got the warning and checked dashboard but the ram was still fine (80% unused), I checked my server health event logs via IPMI but there is nothing there (about ram and recent) so probably not a hardware fault either right?
-
I haven't run tdarr nodes for a few months now, at 12 am there is a ssd trim, mover works every 3 hours. Everything major should start after 2 am. But if it happens at 11pm maybe Plex is the problem? I think I am using Ram as storage for plex transcoding: --runtime=nvidia --device=/dev/dri --mount type=tmpfs,destination=/tmp,tmpfs-size=20000000000 --no-healthcheck --restart unless-stopped --log-opt max-size=50m But the error is everyday and my watch time and error time doesn't match up
-
Hi Guys, I keep getting an "Out Of Memory errors detected on your server" error on my server every single day for the past week. The weird thing is that it happens 4:46 AM every time, only thing I could correlate this with is the following: - Automatic appdata backup (starts at 4AM) I did have problems with a kernel panic crash but that hasn't happened in a month or two. That was also the reason I upgraded to 6.10.0-rc2 but that didn't fix it. How can I check where the problem lies? zeus-diagnostics-20220306-1852.zip syslog-10.50.0.254.log
-
Hey, see the attachment for the syslogsyslog-127.0.0.1.log . I've had the syslog on for a while so it should have all the crashes (if it registers that) Edit: I just noticed that it didn't update the syslog for a very long time... I disabled and enabled it but I also enabled remote syslog as well and point it now to my other unraid server (it wrote something so it should work). I'll wait for a crash now I guess...
-
I've been thinking but could I get a kernel panic if the hardware is maybe defect? Like if a ram stick or cpu is not good?
-
The kernel panic happened again today, I restarted server around 18:35 Could it maybe be a plugin? Would it help to delete every plugin and docker and start over? Is there a way to keep my data and cache pool when making a new usb with unraid? unraidserver-diagnostics-20220107-1946.zip
-
Unfortunately I still have this problem even when updating to 6.10 RC2 and changing to IPVLAN. However my whole network doesn't go down with it anymore so that's an added bonus I have a second unraid server, is there something I can do with that to diagnose this problem further?
-
Hey, Don't worry about it! I'm just glad that that there is someone to reply unlike other forums I'd rather not update to a rc build but if there is no choice I will have to do it. At the moment the server hasn't crashed yet since the last one. I will update the next time it happens. Thank you for the tip and hopefully this'll be my last message in this topic
-
Did anyone maybe have the same problem recently?
-
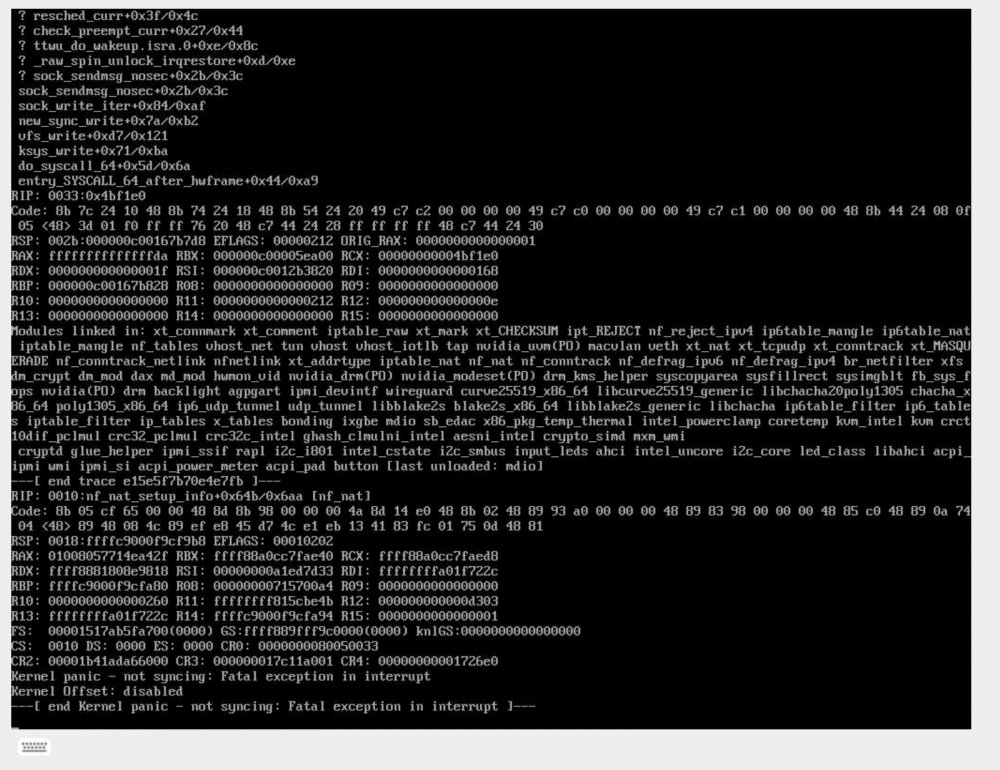
Hi All, The past few days something very weird is happening, this is the second time I find my network down because somehow when the server has a kernel panic it takes the whole network down (maybe because of link aggregation protocol?) This is the screenshot: And the logs are in the attachments, I added one before I started array and one after because i'm not sure if that matters or not. Does anyone know what it might be? The last one happened in the weekend and now its today at around 14:30 CET. unraidserver-diagnostics-20211129-1804.zip unraidserver-diagnostics-20211129-1811.zip
-
I'm on Unraid Version 6.9.2 now and this still keeps happening to me. I increased my log size to 1gb but it just keeps on filling up and I don't want to keep on restarting so i just delete the old syslogs and nginx logs (both filled with same errors). Jul 3 04:45:04 unraidserver nginx: 2021/07/03 04:45:04 [error] 3377#3377: nchan: Out of shared memory while allocating channel /disks. Increase nchan_max_reserved_memory. Jul 3 04:45:04 unraidserver nginx: 2021/07/03 04:45:04 [error] 3377#3377: *1125090 nchan: error publishing message (HTTP status code 507), client: unix:, server: , request: "POST /pub/disks?buffer_length=1 HTTP/1.1", host: "localhost" Jul 3 04:45:04 unraidserver nginx: 2021/07/03 04:45:04 [crit] 3377#3377: ngx_slab_alloc() failed: no memory Jul 3 04:45:04 unraidserver nginx: 2021/07/03 04:45:04 [error] 3377#3377: shpool alloc failed I do keep multiple chrome tabs with unraid open for a very long time but this was never a problem before, it just started in december, fixed itself and now it came back? unraidserver-diagnostics-20210703-1357.zip
-
I am also having this exact same problem
-
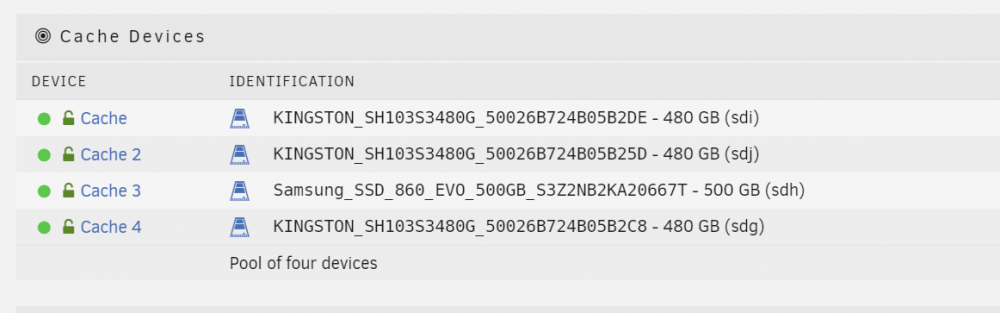
Hey, I have a quick question, when I started up my array I got a warning: unraidserver: Warning [UNRAIDSERVER] - Cache pool BTRFS missing device(s) KINGSTON_SH103S3480G_50026B724B05B2DE (sdi) But when I look at the Cache pool, it looks fine: And the output of "btrfs fi show" is: Label: none uuid: 0130b325-8ce1-4ceb-a715-467c12ccc4eb Total devices 4 FS bytes used 252.93GiB devid 2 size 447.12GiB used 148.03GiB path /dev/mapper/sdj1 devid 3 size 465.75GiB used 167.03GiB path /dev/mapper/sdh1 devid 6 size 447.12GiB used 149.00GiB path /dev/mapper/sdg1 devid 7 size 447.12GiB used 148.00GiB path /dev/mapper/sdi1 Label: none uuid: 666f8abb-816d-4947-bcf4-58e359c735d0 Total devices 1 FS bytes used 8.12GiB devid 1 size 50.00GiB used 11.52GiB path /dev/loop2 Should I be worried? I can't restart the server atm because it is doing a rebuild and parity check The server did restart like 4 to 5 times because I was diagnosing multiple disks being offline (and it is fine now) Also it gives me a warning on the shares pages: "Some or all files are unprotected" even the shares without cache drive, or is this because of the rebuild? Don't remember seeing it before..
-
This seem like a very useful feature, I will use this for my games library and other programs that do no want to work from/to smb.
-
Ooh that is where I went wrong! I deleted /mnt/user/cache and the error is gone now too, thank you very much everybody!
-
I do not have a cache share in my shares tab, O checked my dockers and vms and nothing has mnt/cache. Can I delete/view the share somehow via ssh? The folder /mnt/cache exists but is empty (i used ls)
-
Ah I see, so should I just click on ignore error since the issue has been resolved? (rescanning doesn't make it go away)


