





TheFullTimer
Members
-
Joined
-
Last visited
Everything posted by TheFullTimer
-
Following up with this issue, the trouble has been resolved. If you didn't read the thread, this catches you up: Working through my thought process, I didn't freeze updates or other work on the system. I don't believe that a reasonable end-user would ignore container updates that might fix their issue, and being in the Beta i did update from 7.0.0 Beta-4 to 7.0.0-rc.1. I had deleted the images, switched to overlay2 storage driver, and rebuilt the containers. When the issue persisted I did look around to other concerns. Resolution and checking work(?): The most impactful difference to stability occurred after I checked through my specifications in the Tips and Tweaks plugin. Here I had kept the defaults of "vm.dirty_background_ratio to 3% and vm.dirty_ratio to 5%". As a reference, my testing system has 128 GB of RAM, so I adjusted these down to 1% and 2%, respectively. Again, a full Shutdown and Power On was performed after the change and the problematic Containers ran idle for 24 hours. As they now seemed to be stable, I began testing them with intermittent workloads to see if they might eventually shutdown, as they had previously. They did continue to operate normally. An update for both Invoke and Ollama had been released, so the containers were updated and continued to function without unexpectedly quitting. I also took the opportunity to update the Checkpoints and Loras of the Invoke container, and took the easiest path of deleting, removing appdata, and cleanly installing with updated Paths. It had then been ~60 hours and I went back to test the Cache ratios. They were returned to 3% & 5%, respectively, and the system was cleanly power cycled & left to idle with problematic containers running but otherwise inactive. Nothing changed, and the containers remained available for 24hr+. I then returned the setting back to 1% & 2%, where it now remains. TL:DR System has 128 GB of RAM. Adjusting "vm.dirty_background_ratio to 3% and vm.dirty_ratio to 5%" to "vm.dirty_background_ratio to 1% and vm.dirty_ratio to 2%" was most impactful. Additional Thoughts: This does raise some questions about those applications potentially crashing if the virtual memory is dirty. To resolve that concern, and 100% confirm the issue, a clean test environment would've been necessary. I didn't really expect the Cache ratio to have a large impact in the first place, but it had effectively corrected the problem on an idle system. It is also possible that work I performed when the cache ratio was lowered had fixed some underlying issue with one or more containers.
-
@bmartino1 I don't believe that's the cause, but I'll share the information below. In the past 48 hours I've made changes that kept the containers running stable. I'm working back through my changes to determine what configuration could work best for others. 🫡 From docker info: Storage Driver: overlay2 Backing Filesystem: zfs From ollama container: df -T Filesystem Type 1K-blocks Used Available Use% Mounted on overlay overlay 483475328 156656000 326819328 33% / tmpfs tmpfs 65536 0 65536 0% /dev shm tmpfs 65536 0 65536 0% /dev/shm shfs fuse.shfs 483655680 156836352 326819328 33% /root/.ollama cache zfs 483475328 156656000 326819328 33% /etc/hosts tmpfs tmpfs 65828356 12 65828344 1% /proc/driver/nvidia tmpfs tmpfs 65828356 4 65828352 1% /etc/nvidia/nvidia-application-profiles-rc.d overlay overlay 65810396 1403344 64407052 3% /usr/bin/nvidia-smi overlay overlay 65810396 1403344 64407052 3% /usr/lib/firmware/nvidia/565.57.01/gsp_ga10x.bin tmpfs tmpfs 65828356 0 65828356 0% /proc/acpi tmpfs tmpfs 65828356 0 65828356 0% /sys/firmware From invoke container: df -T Filesystem Type 1K-blocks Used Available Use% Mounted on overlay overlay 483475200 156656768 326818432 33% / tmpfs tmpfs 65536 0 65536 0% /dev shfs fuse.shfs 1885863936 1141609344 744254592 61% /install shm tmpfs 65536 0 65536 0% /dev/shm cache zfs 483475200 156656768 326818432 33% /etc/hosts overlay overlay 65810396 1419344 64391052 3% /usr/bin/nvidia-smi rootfs rootfs 65810396 1419344 64391052 3% /etc/vulkan/icd.d/nvidia_icd.json tmpfs tmpfs 65828356 12 65828344 1% /proc/driver/nvidia tmpfs tmpfs 65828356 4 65828352 1% /etc/nvidia/nvidia-application-profiles-rc.d overlay overlay 65810396 1419344 64391052 3% /usr/lib/firmware/nvidia/565.57.01/gsp_ga10x.bin tmpfs tmpfs 65828356 0 65828356 0% /proc/acpi tmpfs tmpfs 65828356 0 65828356 0% /sys/firmware
-
😑 Happened on 7.0.0-rc.1 after the previously mentioned changes (i.e. switch from btrfs to overlay2 storage driver) Containers were set back to recommended extra parameters of the developers. Ollama: --gpus=all Invoke: --runtime=nvidia --gpus=all Tdarr: --gpus=all
-
This issue has persisted for these two containers whereas Tdarr runs without issue. I put this is General as it is a Beta system, but it's very curious. Tested combinations of `--runtime=nvidia` & `--gpus=all` in the extra parameters. Even with only one test container running and system restarted so that only the test container and NetData run at array start. Review and suggestions are welcome. If there's particular piece of data you'd like to see for a given container start/failure, please ask. --- Edit: 7.0.0-rc.1 2024-12-02 is out Switching docker to overlay2 storage driver and testing https://docs.unraid.net/unraid-os/release-notes/7.0.0/#add-support-for-overlay2-storage-driver
-
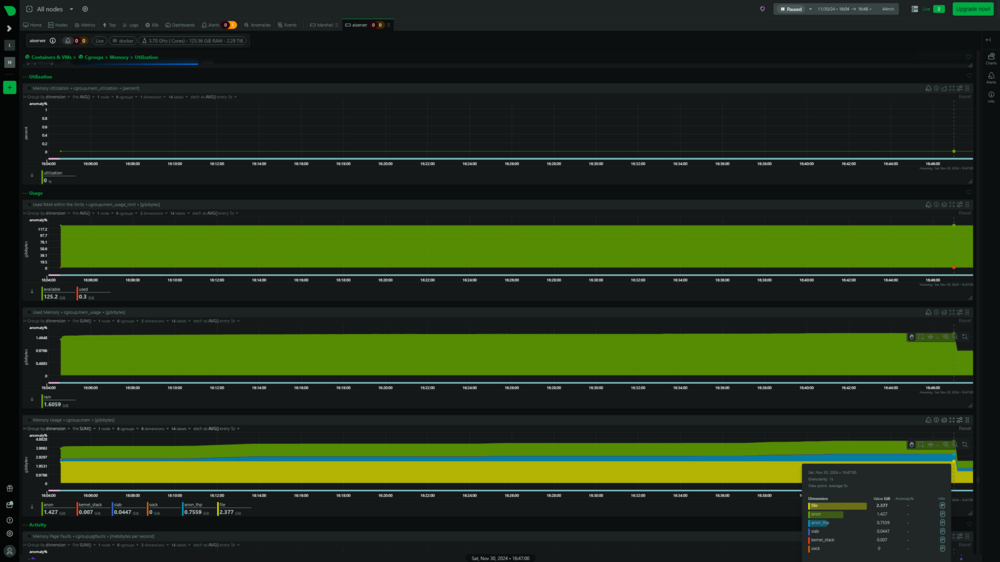
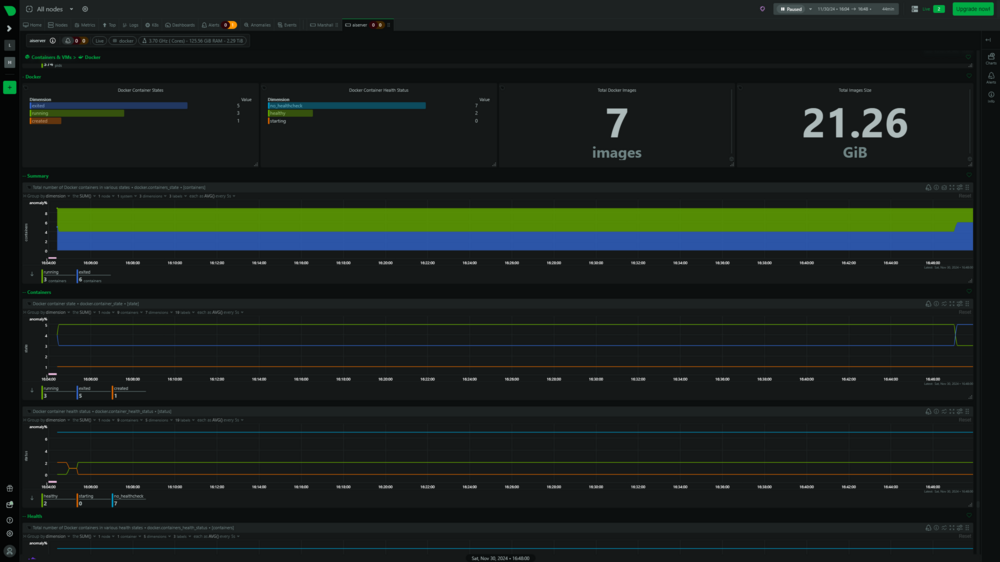
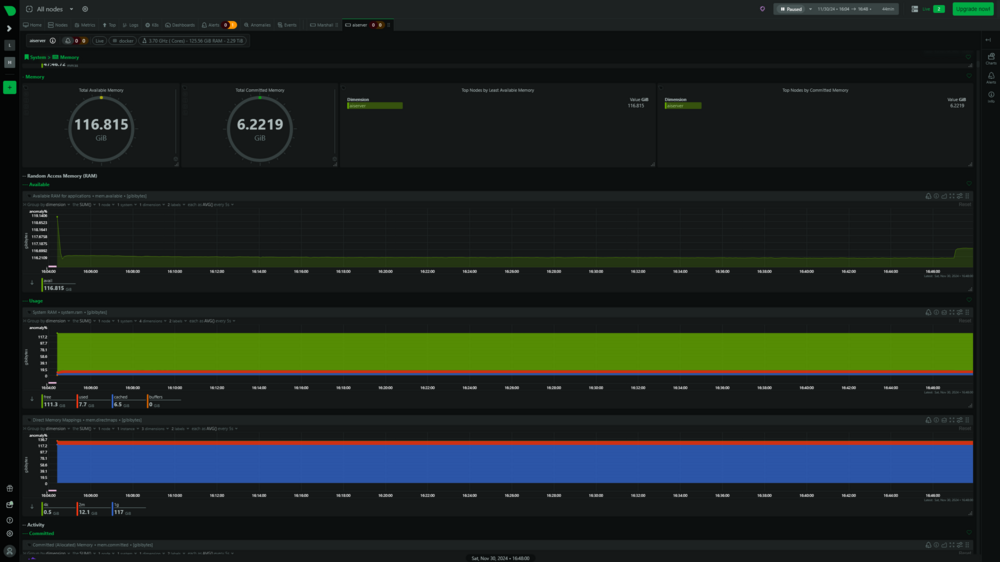
Thank you for the feedback, @bmartino1. I've attached screenshots from NetData for the range of the first Syslog I attached, when all services sat idle until failure. There doesn't appear to be a memory leak, and the moment the containers stopped is shown at ~16:47:02. No sign of a radical change at that time. You can see that the system has 128GB of rDimms and everything is consistent. I'll go back to testing a bit with `--runtime=nvidia` & `--gpus=all` in the extra parameters. It is intriguing that Tdarr runs happily with `--gpus=all` this whole time. Additionally, if it were a runaway GPU memory I'd expect, from prior experience, the GPU lock up or all containers using the GPU to fail; whereas Tdarr hums along happily.
-
@bmartino1 Thank you for taking a look. I appreciate it. Ran docker inspect for the Invoke, Ollama, and Tdarr. Also attached is a log that continues on from yesterday to today. docker inspect invoke-default.txt docker inspect ollama.txt docker inspect tdarr_node_GPU.txt aiserver-diagnostics-20241201-1054.zip
-
Recent logs attached. Essentially, Ollama & Invoke will shut down at random intervals and without notice. Between boot and these logs I simply logged in, started array, let the autostart run. Then, didn't utilize the Tdarr node so the GPU would remain idle. Just let it sit until the problematic containers stopped and pulled the log. Longer details... I put together a Beta box with 2 NVMe devices and Nvidia GPU for using: Ollama Open-WebUI Invoke Tdarr Netdata BigAgi ClamAV installed for periodic scans This will happen even if they sit idle, and essentially run for up to 2 hours before finding out they stopped. However, it is usually a shorter period of 20-40 min and I might not notice. This also occurs if one or none are started with the array, but if running they will shutdown simultaneously. I've also tried with or without `--runtime=nvidia` in the extra parameters. A cause doesn't appear obvious, to me, but I'd rather be wrong and corrected than live in ignorance. Tdarr does not shut down, and continues to operate normally. I've also run all three of those containers at the same time, and aside from slower performance they function normally. Again, combinations were tested and eventually Ollama &/or Invoke would stop. They can be started up again, and perform normally. No obvious errors in the logs aside from mention of `nvidia-persistenced` and the docker interface going up or down when events occur. aiserver-diagnostics-20241130-1648.zip
-
For the Invoke-AI container the path to models and outputs can be mapped elsewhere. Assuming your storage is fast or you have extra NVMe laying around. The paths are: - Container Path: /invokeai_root/outputs - Container Path: /invokeai_root/models
-
Hi there, big thanks and please point me elsewhere if this is the wrong location. Passing environmental and backend values to big-AGI. https://github.com/enricoros/big-AGI/blob/main/docs/environment-variables.md edit. User Error. Adding question, does this build not have HTTP authentication?
-
Just wanted to pop in here. I have a file named mounts which was created today in the `/mnt` directory around the time I updated Unassigned Devices. Would this be related to the two updates today (02-02-2024 EST)? If so, keep or delete?
-
Began seeing crashes with 6.12 and I've been unable to pin it down. Sometimes it happens within 24 hours, sometimes a little over 48 hours. I tried going with all containers off and it occurred a day later. Sometimes it's when watching Plex, and sometimes it's hours after I go to sleep. Thought it might be from switching to ZFS on cache so I switched back to BTRFS. Thought it might be RAM but Memtest 86 passed default tests. Deleted all VM's Turned off Powersaving I'd be happy to know it's something I'm missing, and if this is in the wrong sub-forum kindly correct my ignorance and move. (Logs extracted from Syslog Watcher Manager. Crash event occurred on July 10th, but I also attached logs covering startup on July 09th through event.) Thanks, TheFullTimer marshall-diagnostics-20230710-1847.zip Syslog-marshall-07.10.23.log Syslog-marshall-07.09-to-07.10.log
-
That would be in your `appdata` directory. From the Shares tab it is named `appdata` by default, then inside of that share it is `appdata\stash\config`. Then, inside that directory, following the instructions from Github:Stashapp-CommunityScrapers you would either create a folder named `scrapers` or place your downloaded scrapers into the existing folder of that name.
-
Not sure if this should go here or with the stash peeps, but I have an issue with Tagger. None of the matched and submitted scenes are saved permanently. They appear to be matched when I check the scene information, but anytime I run Tagger they show up again and congest the searches.
-
I've had issues with deleting files from folders, and users report issues uploading. Running 19.0.3 and also had issues with the updater coming back with errors once or twice. Not sure how to fix or rebuild.
-
I recently moved to a new house and my server is assigned a new Lan address. The port forwarding is set correctly but Nextcloud is unresponsive. When I attempt to access via 192.168.1.*:444 I receive this message. The error log shows Not sure how to proceed with correcting this issue.
-
Because I forgot to check before posting yesterday; I can say that with my MoBo switching to EHCI had no effect in altering the groups or devices listed above.
-
Here is a dump of my devices and you can see that it only passes through the VL805. If I didn't stub it I wouldn't be able to pass it to anything. If I cannot figure out how to make it work with USB audio without freezing the other devices on the controller then I'll swap it for something else. Bus 1 --> 0000:00:1a.0 (IOMMU group 3)Bus 001 Device 003: ID 0781:5575 SanDisk Corp. Bus 001 Device 002: ID 8087:0024 Intel Corp. Integrated Rate Matching HubBus 001 Device 001: ID 1d6b:0002 Linux Foundation 2.0 root hubBus 2 --> 0000:00:1d.0 (IOMMU group 7)Bus 002 Device 004: ID 051d:0002 American Power Conversion Uninterruptible Power SupplyBus 002 Device 002: ID 8087:0024 Intel Corp. Integrated Rate Matching HubBus 002 Device 001: ID 1d6b:0002 Linux Foundation 2.0 root hubIOMMU group 7[RESET] 00:1d.0 USB controller [0c03]: Intel Corporation 6 Series/C200 Series Chipset Family USB Enhanced Host Controller #1 [8086:1c26] (rev 05)IOMMU group 5[RESET] 00:1c.4 PCI bridge [0604]: Intel Corporation 6 Series/C200 Series Chipset Family PCI Express Root Port 5 [8086:1c18] (rev b5)IOMMU group 3[RESET] 00:1a.0 USB controller [0c03]: Intel Corporation 6 Series/C200 Series Chipset Family USB Enhanced Host Controller #2 [8086:1c2d] (rev 05)IOMMU group 11[RESET] 06:00.0 Ethernet controller [0200]: Intel Corporation 82574L Gigabit Network Connection [8086:10d3]IOMMU group 100:01.0 PCI bridge [0604]: Intel Corporation Xeon E3-1200/2nd Generation Core Processor Family PCI Express Root Port [8086:0101] (rev 09)00:01.1 PCI bridge [0604]: Intel Corporation Xeon E3-1200/2nd Generation Core Processor Family PCI Express Root Port [8086:0105] (rev 09)01:00.0 VGA compatible controller [0300]: NVIDIA Corporation GP107 [GeForce GTX 1050 Ti] [10de:1c82] (rev a1)01:00.1 Audio device [0403]: NVIDIA Corporation Device [10de:0fb9] (rev a1)[RESET] 02:00.0 USB controller [0c03]: VIA Technologies, Inc. VL805 USB 3.0 Host Controller [1106:3483] (rev 01)IOMMU group 800:1e.0 PCI bridge [0604]: Intel Corporation 82801 PCI Bridge [8086:244e] (rev a5)[RESET] 07:05.0 VGA compatible controller [0300]: ASPEED Technology, Inc. ASPEED Graphics Family [1a03:2000] (rev 10)IOMMU group 6[RESET] 00:1c.5 PCI bridge [0604]: Intel Corporation 6 Series/C200 Series Chipset Family PCI Express Root Port 6 [8086:1c1a] (rev b5)IOMMU group 4[RESET] 00:1c.0 PCI bridge [0604]: Intel Corporation 6 Series/C200 Series Chipset Family PCI Express Root Port 1 [8086:1c10] (rev b5)IOMMU group 200:06.0 PCI bridge [0604]: Intel Corporation Xeon E3-1200/2nd Generation Core Processor Family PCI Express Root Port [8086:010d] (rev 09)[RESET] 03:00.0 Serial Attached SCSI controller [0107]: LSI Logic / Symbios Logic SAS2008 PCI-Express Fusion-MPT SAS-2 [Falcon] [1000:0072] (rev 03)IOMMU group 10[RESET] 05:00.0 Ethernet controller [0200]: Intel Corporation 82574L Gigabit Network Connection [8086:10d3]IOMMU group 000:00.0 Host bridge [0600]: Intel Corporation Xeon E3-1200 Processor Family DRAM Controller [8086:0108] (rev 09)IOMMU group 900:1f.0 ISA bridge [0601]: Intel Corporation C204 Chipset Family LPC Controller [8086:1c54] (rev 05)[RESET] 00:1f.2 SATA controller [0106]: Intel Corporation 6 Series/C200 Series Chipset Family SATA AHCI Controller [8086:1c02] (rev 05)00:1f.3 SMBus [0c05]: Intel Corporation 6 Series/C200 Series Chipset Family SMBus Controller [8086:1c22] (rev 05)
-
I'm very curious about this because I've been having issues with a 7 port USB card ORICO Hub USB 3.0 PCI-E Expansion Card Adapter. When I pass through a USB audio device the other devices connected stop working until the audio ceases.



