






GilbN
Community Developer
-
Joined
-
Last visited
Everything posted by GilbN
-
What's Adeptus Mechanicus?
-
Yeah you missed the instructions
-
Add this to your config.
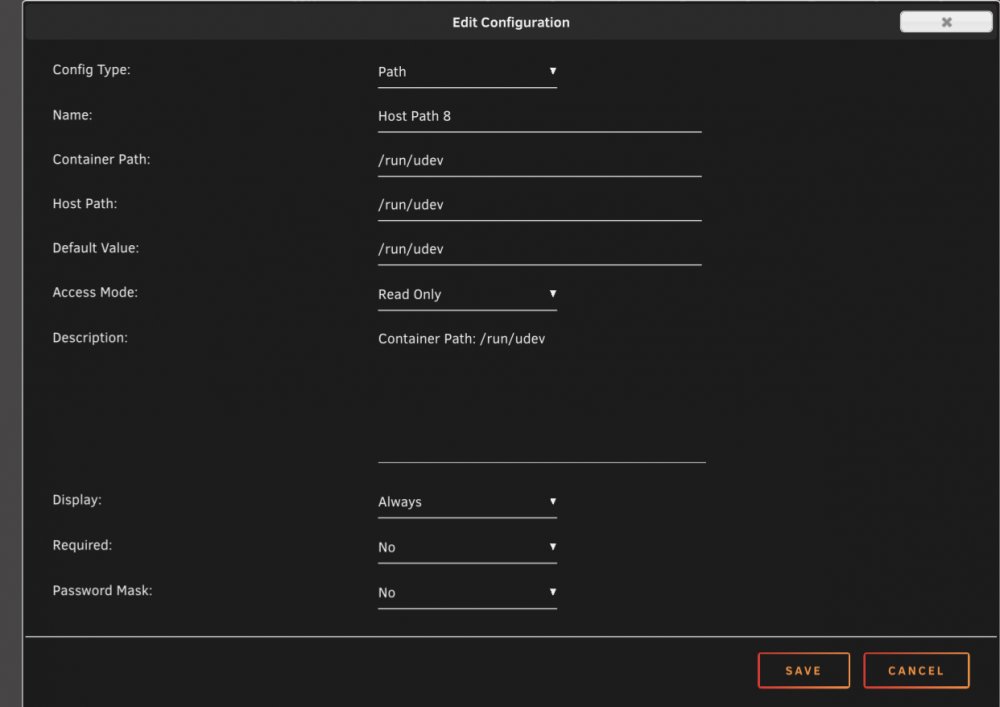
-
And in the 'show more settings'?
-
Share your complete telegraf container config, paths and variables ect
-
What do you have in the post arguments for telegraf?
-
Try SELECT DISTINCT "ID_SERIAL" FROM (SELECT * FROM "diskio" WHERE time >= now() - 1d) If that doesnt work, try SHOW TAG VALUES FROM "diskio" WITH KEY = "ID_SERIAL" If that doesn't work, your telegraf config is wrong.
-
As I said, it works locally. Through the browser as your computer is on your LAN. So through the browser on the computer it has access.
-
use command SELECT DISTINCT "ID_SERIAL" FROM (SELECT * FROM "diskio" WHERE time >= now() - 10s)
-
Run it using http://influxui.s3-website-us-east-1.amazonaws.com/
-
The query from Falconexe post a couple of posts above this.
-
Connect to you database using this and run the variable command there. http://influxui.s3-website-us-east-1.amazonaws.com/ It works locally. Or exec into the container and run it that way. That will atleast confirm that there is data in the dB. Have you tried to remove and re add the datasource in grafana.
-
Hopefully this will help a bit.
-
I'm just guessing here but I would think the server id is added as a field tag in influx ect
-
Don't think you need multiple varken datasources. https://wiki.cajun.pro/books/varken/page/configuring-multiple-servers Nor sure how that looks in influx but I'm sure you add a variable to switch between
-
If you hit f12 in the browser you can inspect the html and css. And you can use a browser plugin like stylus ect to inject you custom stylesheet. Check youtube for some css and html courses. You can add local pictures yeah, but you will have to change the script.
-
Don't change the post arguments. Apk is for alpine and apt is for latest.
-
You are using the :alpine tag. Switch to latest.
-
You can copy panels from here https://grafana.com/grafana/dashboards/10914
-
@falconexe Btw, you should add a Datasource dropdown for the Varken panels. Not all have called their data source "Varken"
-
https://technicalramblings.com/blog/how-to-setup-grafana-influxdb-and-telegraf-to-monitor-your-unraid-system/ You still need to do some of the "Dependencies" part in the instructions from this topic after you follow that guide btw.
-
Yeah, default is :latest. I've updated my guide.
-
Use the alpine tag in the Repository field.
-
Yeah I think I do it on my dashboard. @RockDawg does https://grafana.com/grafana/dashboards/7233 work for your setup? You can add. .*/mnt/xxx/ for the rootfs stuff.
-
If you reverse proxy it you can use subfilter to add it.




