phoenixdiigital
Members
-
Joined
-
Last visited
Everything posted by phoenixdiigital
-
Also I've tried multiple browsers and OS types (windows, Fedora). Deleting the cookies presents the login page and as soon as you login you get the 500 Error.
-
I just tried removing GPU Stats plugin via the CLI then restarting the web gui but I'm still getting Web GUI Error 500 root@Tower:~# plugin remove gpustat plugin: removing: gpustat plugin: gpustat removed Executing hook script: post_plugin_checks root@Tower:~# /etc/rc.d/rc.php-fpm restart rc.php-fpm: Restarting PHP-fpm daemon... rc.php-fpm: Stopping PHP-fpm daemon... rc.php-fpm: PHP-fpm daemon... Stopped. rc.php-fpm: Starting PHP-fpm daemon... rc.php-fpm: PHP-fpm daemon... Started. root@Tower:~# plugin remove intel-gpu-top plugin: removing: intel-gpu-top plugin: intel-gpu-top removed Executing hook script: post_plugin_checks root@Tower:~# /etc/rc.d/rc.php-fpm restart rc.php-fpm: Restarting PHP-fpm daemon... rc.php-fpm: Stopping PHP-fpm daemon... rc.php-fpm: PHP-fpm daemon... Stopped. rc.php-fpm: Starting PHP-fpm daemon... rc.php-fpm: PHP-fpm daemon... Started. I'd love to avoid having to restart the whole server if at all possible. Interestingly after running the above commands the plugins are still in /boot/config/plugins directory. I guess they'll go after a reboot?
-
Editing top post to include a TLDR of the findings from below ------------------------------------ It appears the directory and all the files within /usr/local/emhttp/state/ are gone. Notably these two referenced in the phplog errors /usr/local/emhttp/state/network.ini /usr/local/emhttp/state/var.ini This is causing the dynamix plugin to fail and breaking the Web GUI completely. Apparently these files are recreated on a restart so that explains why it comes good after an unraid reboot. However I'm still unsure what is cauusing them to dissapear. Is there a way to regenerate these withouut a reboot? ------------------------------------ Original First Post Below ------------------------------------ I've recently had the Unraid Web GUI stop responding completely with error 500. This has been happening on versions 6.12.13 about a month ago and is till happening on 7.0.0 (upgraded just yesterday) Searching the forums suggested restarting the web interface which never works # restart Web GUI /etc/rc.d/rc.php-fpm restart The only way to get the web GUI back is to restart the whole server which is a bit of a pain since you can't access the Web GUI. Ideally I'd stop all docker containers before restarting but there doesn't seem to be a way to stop all containers from ssh and they have to be done one by one. # List all contatiners docker ps # Stop or Kill containers docker stop container <container number> docker kill container <container number> I've got all my containers and plugins up to date as I just upgraded to 7.0.0 yesterday. My suspicion is the GPU Statistics Plugin as when GUI error 500 was happening a month ago searching the forums I found a post suggesting GPU Statistics Plugin was the issue. I did remove it a while ago and the problems went away. However yesterday I decided to reinstall it after upgrading to 7.0.0 and I'm back at Web GUI error 500 after about 12 hours so it's the prime suspect. root@Tower:~# ls /boot/config/plugins AAA-UnraidPatch-BootLoader-DO_NOT_DELETE.plg dockerMan/ dynamix.system.buttons.plg intel-gpu-top/ unassigned.devices-plus/ NerdPack/ dynamix/ dynamix.system.info/ intel-gpu-top.plg unassigned.devices-plus.plg NerdTools/ dynamix.active.streams/ dynamix.system.info.plg nvidia-driver/ unassigned.devices.plg appdata.backup/ dynamix.active.streams.plg dynamix.system.stats/ nvidia-driver.plg unassigned.devices.preclear/ appdata.backup.plg dynamix.apcupsd/ dynamix.system.stats.plg open.files/ unassigned.devices.preclear.plg ca.mover.tuning/ dynamix.file.integrity/ dynamix.system.temp/ open.files.plg unbalanced/ ca.mover.tuning.plg dynamix.file.integrity.plg dynamix.system.temp.plg rclone/ unbalanced.plg community.applications/ dynamix.my.servers/ dynamix.unraid.net.plg rclone.plg unraid.patch/ community.applications.plg dynamix.s3.sleep/ dynamix.wireguard/ tailscale/ unraid.patch.plg coral-driver/ dynamix.s3.sleep.plg fix.common.problems/ tailscale.plg user.scripts/ coral-driver.plg dynamix.system.autofan/ fix.common.problems.plg tips.and.tweaks/ user.scripts.plg corefreq/ dynamix.system.autofan.plg gpustat/ tips.and.tweaks.plg corefreq.plg dynamix.system.buttons/ gpustat.plg unassigned.devices/ Ideally I'd like to identify what the problem is so the developer of the GPU Statistics Plugin can try to fix. Any ideas where to start and what logs to look at to show what is causing the web GUI to die? I'd post a diagnostic but running diagnostic from the SSH session seems to produce an unredacted diagnostics file. What's the paramter to redact? Attached is my syslog.txt and phplog.txt from the diagnostic phplog.txt syslog.txt
-
Very interesting. Thanks for the heads up. Apologies to C-States it seems for accusing them of messing things up. Though these disks have been in there for quite some time. Maybe I was just lucky.... Edit: Actually I probably did upgrade UnRAID during that time so possibly the issue aligns with that.
-
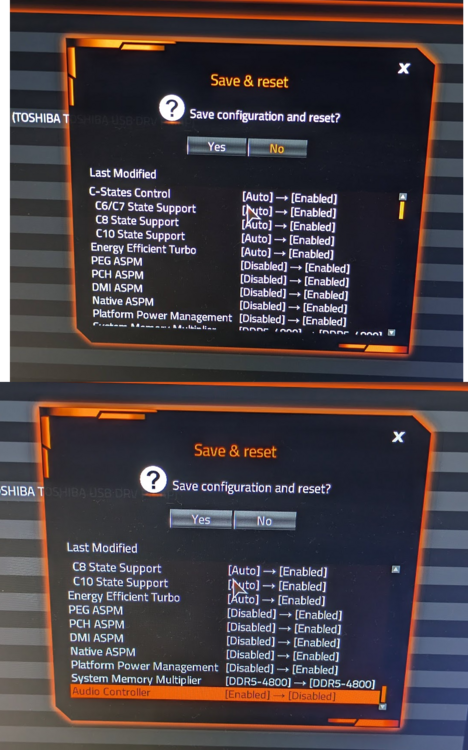
With a goal to reduce my UnRAID servers power usage I started to investigate enabling CStates in the BIOS (see attached). In the following few weeks I started getting Disk Errors on different disks(Disks 6 & 7). I did some extended SMART tests and the drives reported back fine. I should also note these disks have been in the array for over a year and the errors only started cropping up after enabling CStates. In one instance the disk went into emulated mode and I recovered from parity to the same disk. It's been fine for about a month. I'm fine to leave Cstates enabled even with these occasional non critical disk errors so I'm not really asking for help. This post is more just a question of why would enabled CStates be causing these errors? Some reading on C-States for anyone interested CStates Explanation - https://metebalci.com/blog/a-minimum-complete-tutorial-of-cpu-power-management-c-states-and-p-states/ More CState Information - https://www.thomas-krenn.com/en/wiki/Processor_P-states_and_C-states Just before hitting submit I dawned on me. I wonder if the errors are caused by the "SAS2308 PCI-Express Fusion-MPT SAS-2" and the server hitting a state where it tries to send the PCI card to sleep? Pretty sure I avoided enabling PCI power saving features of the BIOS out of concern of this. I've attached a diag too. tower-diagnostics-20240621-0813.zip

-
Just fixed mine too. Been putting up with it for years but only when there is an internet outage I need to go to it via the IP. My problem was the docker template still had the old config without "mamage" in it. Finally fixed for good.
-
Just a note to people looking to upgrade I found that my old SATA JMB585 card (recommended here) that worked on my old UnRAID system doesn't play well with a new motherboard. Old card - "IO CREST Internal 5 Port Non-Raid SATA III 6GB/S Pci-E X4 Controller Card for Desktop PC Support SSD and HDD with Low Profile Bracket. JMB585 Chipset SI-PEX40139" - https://www.amazon.com.au/dp/B07ST9CPND?th=1 Old UnRAID System - ASRock B75 Pro3-M motherboard, Intel® Core™ i5-3330 CPU New UnRAID system - Gigabyte Z790 Gaming X AX motherboard, Intel Core i7 14700K 20 Core LGA 1700 CPU With the JMB585 card plugged in the system just won't boot even to BIOS at all. I've got the latest BIOS for the motherboard and tried a number of different settings on the limited options in the BIOS. I was hoping to find some sort of legacy PCI config but there didn't seem to be one. Nothing on the monitor at all. I can see on the motherboard it flashes the CPU LED, Then moves to the DRAM LED and stays there forever. Power off and take the card out and the system boots just fine. I've since ordered a LSI 9207-8i which I'm hoping can resolve this issue.
-
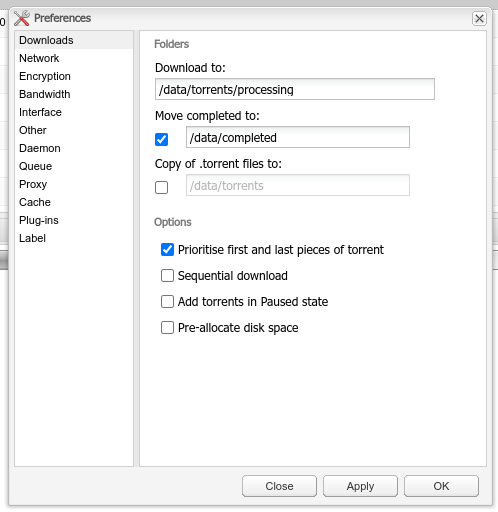
Yeah I think it has been completely allocated as I ran a properties on that directory in Krusader and it reported the full 1TB size. However I just checked the Deluge config and "PreAllocate isn't checked" so you could be onto something. Currently moving a crapload to other disks with UnRaid Balance to make enough space for this. Interesting problem though so not sure why UnRaid isn't just putting these files on another disk. Edit: Yeah this is likely the problem. The torrent had been stalled for days when I knew there should be more seeders. As space has been cleared up it's started flowing again. Surprised there were no other warnings or errors. I think you nailed it. Thanks for the tip.
-
I think I've spotted the issue. I have a 1TB torrent downloading (happens to be currently on Disk 6) and since all the files in the torrent are in the one directory it UnRAID is keeping them all on Disk 6. It's at 50% but obviously as new parts come down it still tries to write to Disk 6 even though it's full. All my shares are set to "Automatically split any directory as required" which says What's the situation here for UNRaid when a disk is full but you try to write a file to the same directory? I found this link but can't find the specific situation I have here (or maybe I'm not RTFM right) - https://wiki.unraid.net/Manual/Shares#Split_level Currently moving a bunch of other stuff off Disk 6 with UnRaid Balance so hopefully that will resolve it. Edit: Maybe this isn't the issue. As I was looking at another directory and it has files within it on different disks.
-
I've seen this posted a number of times in the support threads and checked a number of them and I don't seem to have the config issues those users had. * Duplicate Named Shares of differing case (nope) * Restrictive Split Level (nope) I've used UnRaid Balance to move stuff off Disk 6 but within a day it's full again. Diagnostic attached. Any help would be greatly appreciated. Is it because I created a share called "media"???? Does that clash with something? tower-diagnostics-20230120-1656.zip

-
Thanks everyone. I upgraded the power supply and 7x of the SATA cables and I'm back on track!!!! Appreciate the fast and useful responses.
-
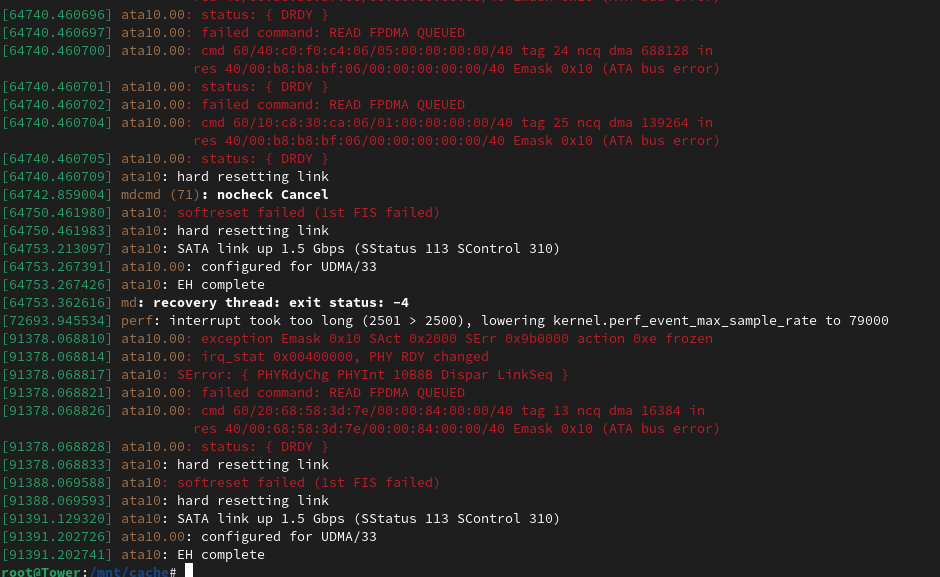
Roger that. I did notice the two busses. It's likely not the greatest PSU for this many drives more so if I plan to upgrade to a newer MB/CPU/Memory I'm going to need a new PSU anyway. Already have my eye on a 850W single bus 12V supply so I think I'll start there and see if that resolves the issues. I'll reseat all SATA cables at the same time. I don't like doing two things at once because then I'll never know which one fixed it but I want minimal downtime so I'll just let the mystery be. FWIW I ran a dmesg earlier when I noticed most of the drives had spun down. Then I ran it again about 2 hours later. The flood of errors has definitely lessened so power could be the cause... either that or I'm not writing to the array much at the moment. Thanks for the tips I'll report back when the PSU has been updated.
-
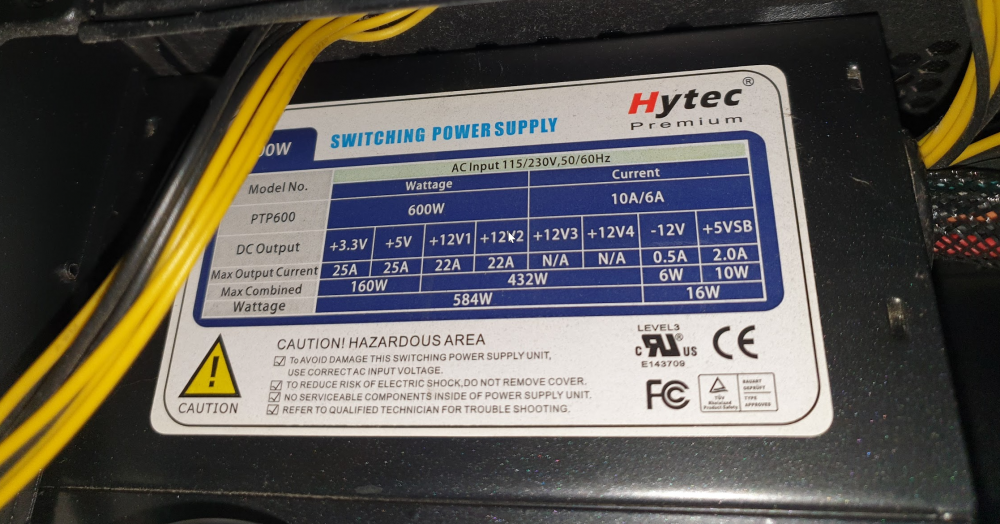
Thanks for responding. I had wondered about the power supply being the limiting factor. She's pretty old too as well as the CPU (10 years) Hopefully newer power supplies have the right motherboard connector for this ancient mobo. I've got newer SATA cables on the way so will maybe start with that and reseat everything well. 600W with the following lines used from the power supply which look to be reasonably spread out. Line 1 - Parity, Disk4, Disk5 & Disk 6 Line 2 - Disk 1, Disk 2, Disk 3, Cashe 2 (SSD), Plus tiny LED pizazz Line 3 - Ext SSD, Cache1 (SSD), Disk7 & Disk8 With disk 7 & 8 being the new ones added. Everything running pretty smoothly prior. Is 600W enough to power this beast? The other option is bite the bullet and get these 3TB drives out of the array and see if it rebuilds parity OK. There is no longer anything left on them so that should help if power is the issue. So I won't hold you to it but it doesn't look like disk failure does it? More a power or SATA cable issue.
-
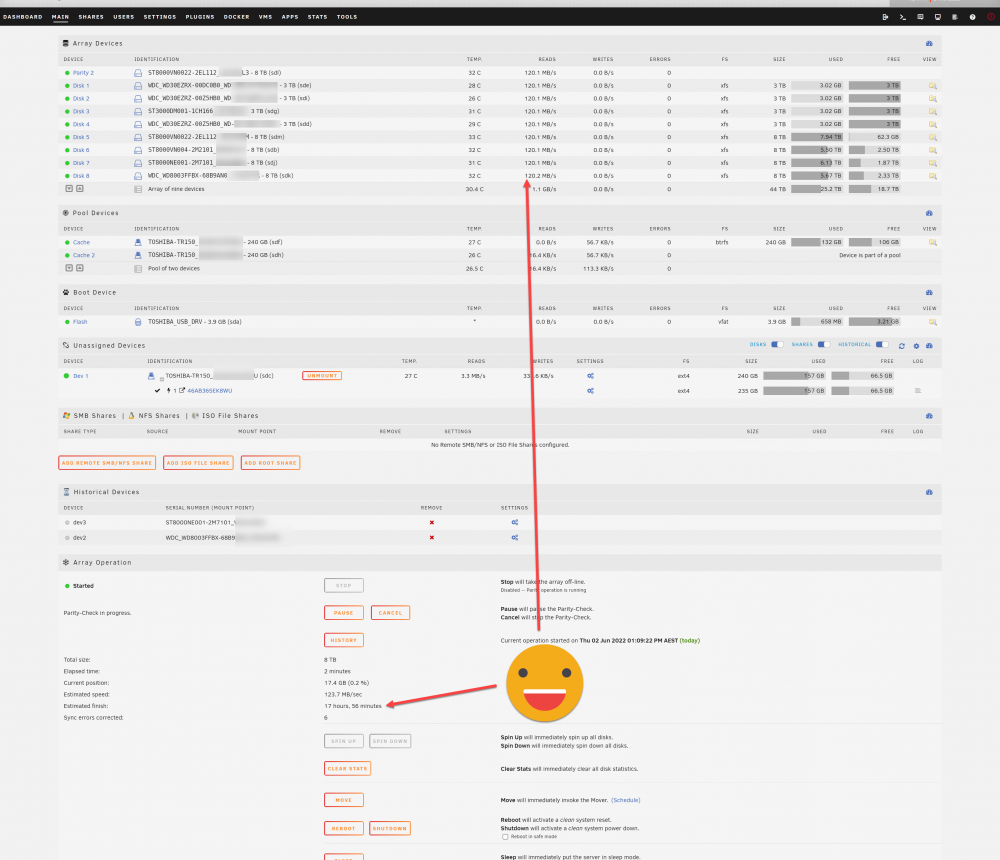
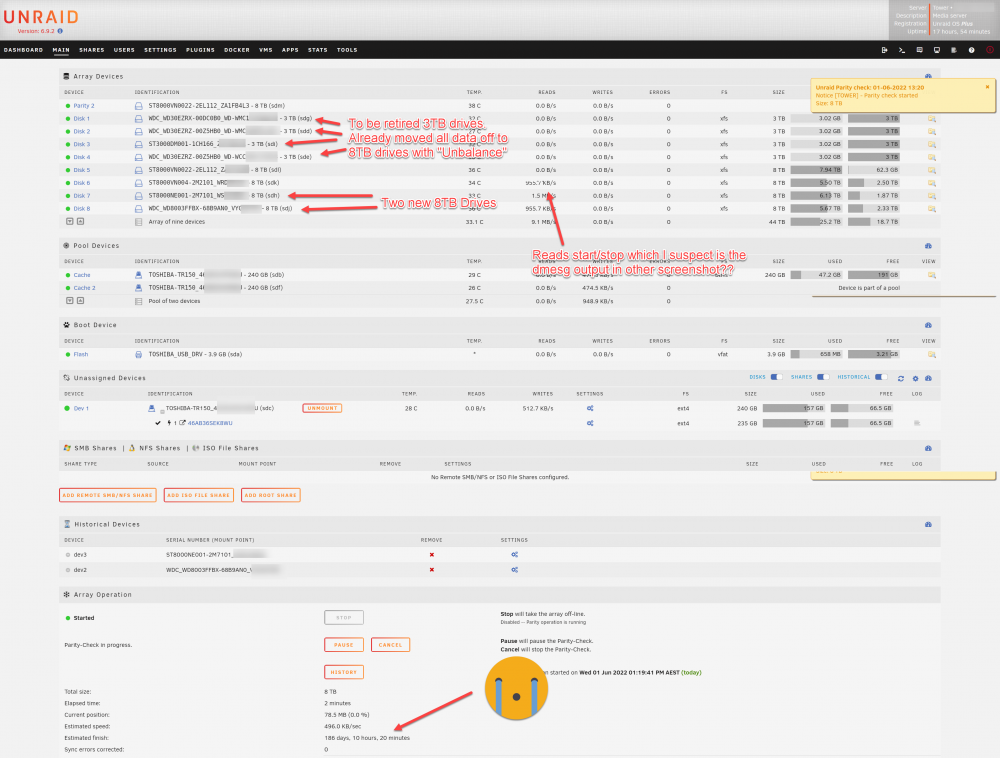
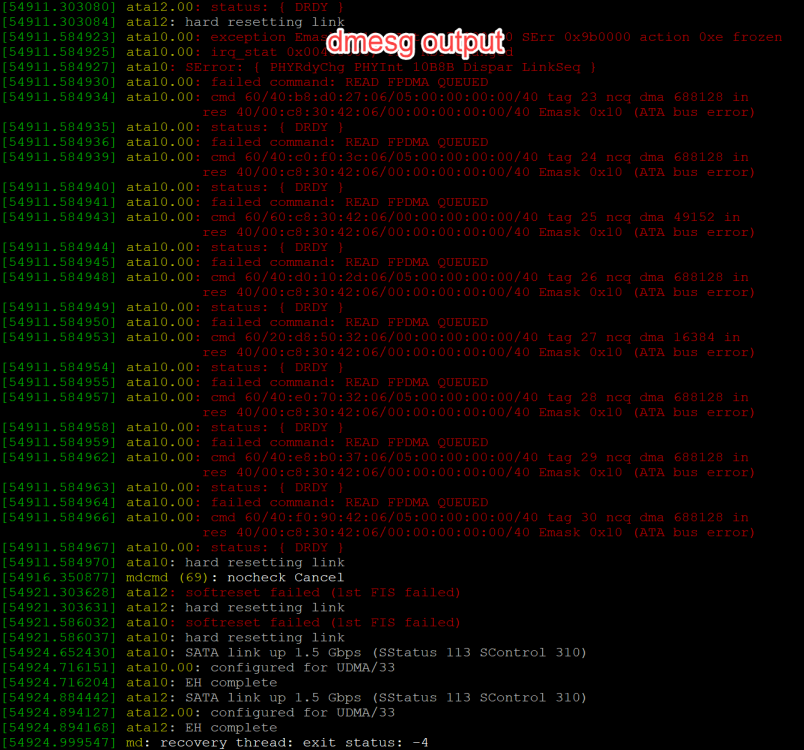
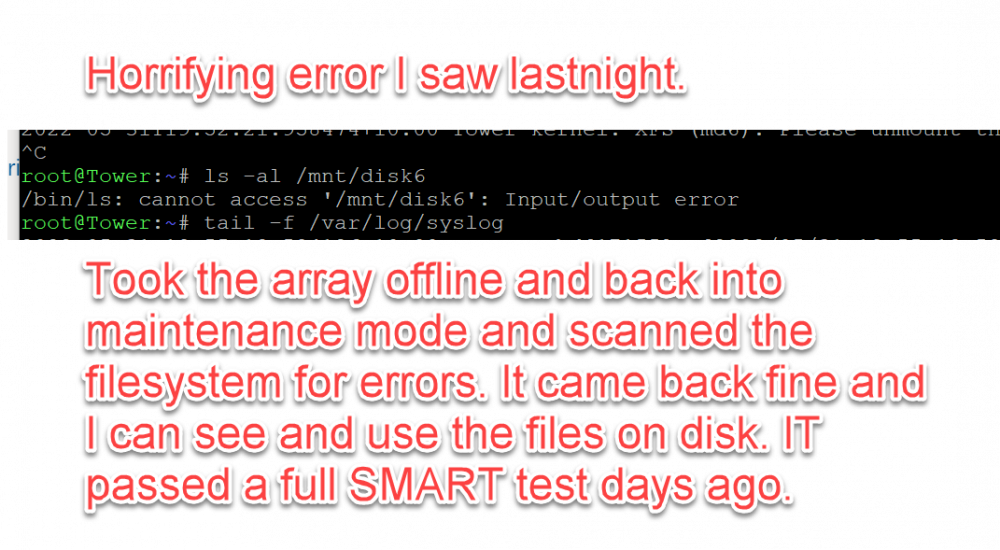
Hi All, I've been trying to retire four old 3TB drives from my array that are older than 5 years (one is 8 years old). So I bought two new 8TB drives and added them to the array then used unbalance to copy all the data off them to these new drives. I had some weird errors last night with one of my 8TB drives reporting some errors (not one of the new ones) showing a pretty scary error. "Input/output error". I did a filesystem check in maintenance mode and everything seemed OK. The data is still there and readable. So before I removed these 4x 3TB drives I figured I'd run a parity check to be sure everything is OK and it's insanely slow. Prior to adding these two 8TB drives I could get a parity done in just over 24 hours. Now it's reporting it will take 186 days. I did a short/long SMART test on ALL drives just a few days ago and they were reporting everything was fine. I copied 12TB from the 3TB drives to the 8TB ones without issue with speed so I don't think it's an issue with SATA cables (I've ordered some replacements regardless) My plan was to just remove all 3TB drives and rebuild parity but I'm starting to rethink that with the current issues I'm seeing. Screenshots and diagnositic file attached. I've got a Unraid sanctioned SATA card https://www.amazon.com.au/dp/B07ST9CPND Any suggestions before I pull the 3TB drives and attempt a parity rebuild? tower-diagnostics-20220601-1317.zip
-
That would be cool if you could give more details at some stage thanks. I was watching my single Mino docker with multiple mounts lastnight with Splunk and there were constant warnings in Splunk like this 05-18-2022 22:32:24.593 +1000 WARN S3Client [2494457 cachemanagerUploadExecutorWorker-2] - command=put transactionId=0x7ff4e0669000 rTxnId=0x7ff4ec475600 status=completed success=N uri=http://192.168.64.64:9768/splunk/_internal/db/c2/26/837~4C740B3B-CD91-4337-BE47-6EE5143CCE76/guidSplunk-4C740B3B-CD91-4337-BE47-6EE5143CCE76/1649801398-1649690860-5951626816833194436.tsidx statusCode=503 statusDescription="Service Unavailable" payload="<?xml version="1.0" encoding="UTF-8"?>\n<Error><Code>SlowDown</Code><Message>Resource requested is unreadable, please reduce your request rate</Message><Key>_internal/db/c2/26/837~4C740B3B-CD91-4337-BE47-6EE5143CCE76/guidSplunk-4C740B3B-CD91-4337-BE47-6EE5143CCE76/1649801398-1649690860-5951626816833194436.tsidx</Key><BucketName>splunk</BucketName><Resource>/splunk/_internal/db/c2/26/837~4C740B3B-CD91-4337-BE47-6EE5143CCE76/guidSplunk-4C740B3B-CD91-4337-BE47-6EE5143CCE76/1649801398-1649690860-5951626816833194436.tsidx</Resource><RequestId>16F0330008CD9A87</RequestId><HostId>3acb2a2c-41e2-45a6-952e-f32626479b3d</HostId></Error>" It performed pretty badly across the board with other warnings too. Probably because all 4x "disk mounts" on the single Minio instance were on the UnRAID array so likely had additional overhead as data was being mirrored by minio and paritied by UnRAID. I ended up turning it off again. Definitely keen to hear of your full setup. Maybe I'll try again. I'm really just doing it so I can test out Splunk configs/behaviour with S3 SMART Store for my day job. Customers use real S3 stores so won't experience the performance issues I've seen.
-
Interesting. I think I got most of it right but still can't get it to work. Here is the result of me adding the container. /usr/local/emhttp/plugins/dynamix.docker.manager/scripts/docker create --name='Minio' --net='bridge' -e TZ="Australia/Sydney" -e HOST_OS="Unraid" -e 'MINIO_ROOT_USER'='admin' -e 'MINIO_ROOT_PASSWORD'='mypassword' -e 'data1'='/data1' -e 'data2'='/data2' -e 'data3'='/data3' -e 'data4'='/data4' -e 'MINIO_VOLUMES'='/data{1..4}' -p '9768:9000/tcp' -p '9769:9001/tcp' -v '/mnt/user/appdata/minio':'/root/.minio':'rw' -v '/mnt/user/work/minio-s3-emulation/volumes/disk2/':'/data2':'rw' -v '/mnt/user/work/minio-s3-emulation/volumes/disk3/':'/data3':'rw' -v '/mnt/user/work/minio-s3-emulation/volumes/disk4/':'/data4':'rw' -v '/mnt/user/work/minio-s3-emulation/volumes/disk1/':'/data1':'rw' 'minio/minio' server /data --console-address ":9001" I deleted the data variable and made individual variables data1, data2, data3 and data4. Then created volume mounts for each. Still no joy. I think I'm missing one important step with your "Post Arguments". Not sure how to add that for an unraid docker. EDIT: Nevermind I found it. I had to tick the "advanced" section for the docker web GUI in unraid. GOT IT WORKING!!!! Thanks for the tips @mfwade Full config here if anyone is interested. /usr/local/emhttp/plugins/dynamix.docker.manager/scripts/docker create --name='Minio' --net='bridge' -e TZ="Australia/Sydney" -e HOST_OS="Unraid" -e 'MINIO_ROOT_USER'='admin' -e 'MINIO_ROOT_PASSWORD'='mypassword' -e 'data1'='/data1' -e 'data2'='/data2' -e 'data3'='/data3' -e 'data4'='/data4' -p '9768:9000/tcp' -p '9769:9001/tcp' -v '/mnt/user/appdata/minio':'/root/.minio':'rw' -v '/mnt/user/work/minio-s3-emulation/volumes/disk2/':'/data2':'rw' -v '/mnt/user/work/minio-s3-emulation/volumes/disk3/':'/data3':'rw' -v '/mnt/user/work/minio-s3-emulation/volumes/disk4/':'/data4':'rw' -v '/mnt/user/work/minio-s3-emulation/volumes/disk1/':'/data1':'rw' 'minio/minio' server /data{1..4} --console-address ":9001"
-
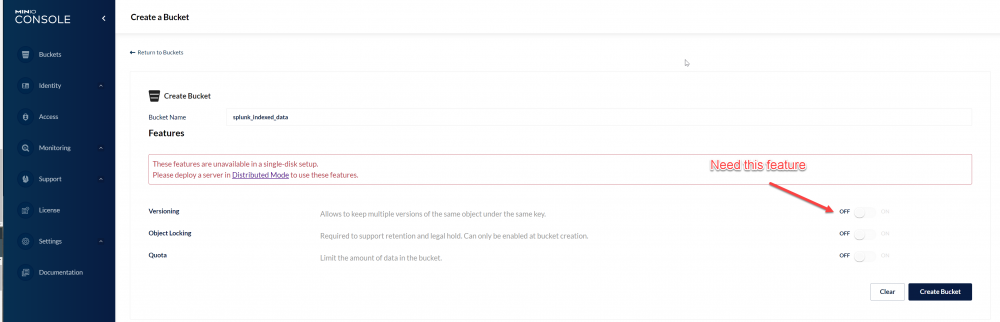
That was me. Yeah I got it working with just one disk/share but wasn't able to make a cluster. I was using it to test and get SMART Store working for Splunk. It was working fine for ages but when I looked at the internal Splunk logs it was whinging about. Turns out I needed versioning which was only compatible if you have a cluster or 4x disk mount. Never managed to get it to work at all sadly so turned off SMART Store for Splunk to reduce the internal log noise. You can see what I tried above on this page. Let me know if you have any luck @mfwade I'd really like to get it working properly.
-
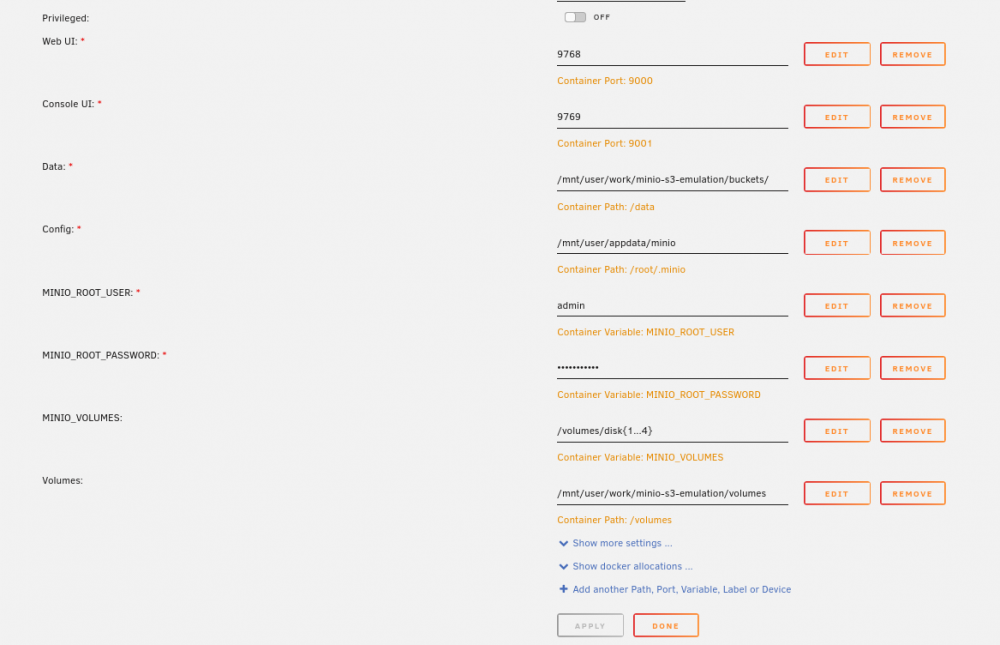
Thanks for the tip. I didn't try the /mnt config but did create the disk1, disk2, disk3 & disk4 into the /data mount. The end result was just 4 new buckets disk1, disk2, disk3 & disk4. So I tried this (see screenshot) and it didn't work either. Happy to do more reading/testing if you can point me in the right direction. Edit: I think it's close based on this - https://docs.min.io/minio/baremetal/installation/deploy-minio-distributed.html?ref=con
-
Hi All, With the minio docker does anyone know how to activate versioning? https://docs.min.io/docs/minio-bucket-versioning-guide.html I think I canjust configure it with JBOD so in theory I'm guessing I need to provide the docker container 4x data mounts. https://docs.min.io/minio/baremetal/installation/deploy-minio-distributed.html?ref=con Just not sure where I would do this and what config file I would modify to tell minio which disks to use. I'm trying to get versioning working because Splunk requires that functionality for the s3 SMART Store. I got directed to it based on this error in Splunk. 03-17-2022 13:13:16.487 +1000 WARN S3Client [1018538 FilesystemOpExecutorWorker-0] - command=list-version transactionId=0x7f164b275a00 rTxnId=0x7f163edfce60 status=completed success=N uri=http://192.168.64.64:9768/splunk statusCode=501 statusDescription="Not Implemented" payload="<?xml version="1.0" encoding="UTF-8"?>\n<Error><Code>NotImplemented</Code><Message>A header you provided implies functionality that is not implemented</Message><BucketName>splunk</BucketName><Resource>/splunk</Resource><RequestId>16DD0C833CC165BD</RequestId><HostId>b41f06a4-5098-478c-8f12-53981d1b3743</HostId></Error>"
-
Yep I can confirm that is my internal network. I have had this docker container working for over a year on the older VPN provider so the config is identical apart from the VPN settings. I've attached the logs from a normal working connection to the VPN provider from my laptop if that helps - https://pastebin.com/LCJp22sg
-
Thanks I tried that but it still wont start sadly I've tested essentially the same openvpn file with a local VPN connection on my laptop and it connects just fine. It just wont connect with this container for some reason. The ovpn file I used is identical to the ones you have with the line auth-user-pass being different obviously. root@localhost:# /usr/local/emhttp/plugins/dynamix.docker.manager/scripts/docker run -d --name='Transmission_VPN' --net='bridge' --privileged=true -e TZ="Australia/Sydney" -e HOST_OS="Unraid" -e 'OPENVPN_USERNAME'='unxxxxxxxxx' -e 'OPENVPN_PASSWORD'='xxxxxxxxxxxxxxxx' -e 'OPENVPN_CONFIG'='ams-001' -e 'OPENVPN_PROVIDER'='PRIVADO' -e 'LOCAL_NETWORK'='192.168.0.0/24' -e 'TRANSMISSION_RPC_USERNAME'='admin' -e 'TRANSMISSION_RPC_PASSWORD'='xxxxxxxxxx' -e 'OPENVPN_OPTS'='--inactive 3600 --ping 10 --ping-exit 60' -e 'PUID'='99' -e 'PGID'='100' -e 'TRANSMISSION_DOWNLOAD_DIR'='/downloads' -e 'TRANSMISSION_RPC_AUTHENTICATION_REQUIRED'='true' -e 'TRANSMISSION_RATIO_LIMIT'='1.1' -e 'TRANSMISSION_RATIO_LIMIT_ENABLED'='true' -e 'TRANSMISSION_DOWNLOAD_QUEUE_SIZE'='15' -e 'TRANSMISSION_CACHE_SIZE_MB'='10' -e 'TRANSMISSION_INCOMPLETE_DIR'='/downloads/incomplete' -e 'TRANSMISSION_WEB_UI'='transmission-web-control' -e 'GLOBAL_APPLY_PERMISSIONS'='false' -p '9091:9091/tcp' -p '1198:1198/udp' -v '/mnt/user/media/processing/torrents':'/data':'rw' -v '/mnt/user/media/processing/downloaded':'/downloads':'rw' -v '/mnt/user/media/processing/watch/':'/watch':'rw' -v '/mnt/user/T_Media/Torrent/':'/mnt/user/T_Media/Torrent/':'rw' -v '/mnt/user/appdata/Transmission_VPN':'/config':'rw' --restart=always --log-opt max-size=50m --log-opt max-file=1 'haugene/transmission-openvpn' 2002282xxxxxxxxxxxxxxxxxxxxxxxxxa1f70a636e1 It seems to get stuck somewhere on the VPN connection as it gets to Tue Feb 25 19:33:24 2020 Initialization Sequence Completed Then one hour later tries to reconnect. Full Log here : https://pastebin.com/VbxGE1C9 At no stage is the web GUI ever available. Any ideas would be greatly appreciated.
-
Not sure if this is the right place or not but the "support" link for docker-transmission-openvpn brought me here. I've noticed that Privado VPN has been added to github but it is not showing up as an option in the Docker Setup. https://github.com/haugene/docker-transmission-openvpn/tree/master/openvpn/privado Any assistance in getting this working would be great as the previous VPN service is going offline tomorrow and everyone is migrating to Privado. I found this guide for custom VPNs but it didn't work : https://haugene.github.io/docker-transmission-openvpn/supported-providers/#using_a_custom_provider