


henris
Members
-
Joined
-
Last visited
Everything posted by henris
-
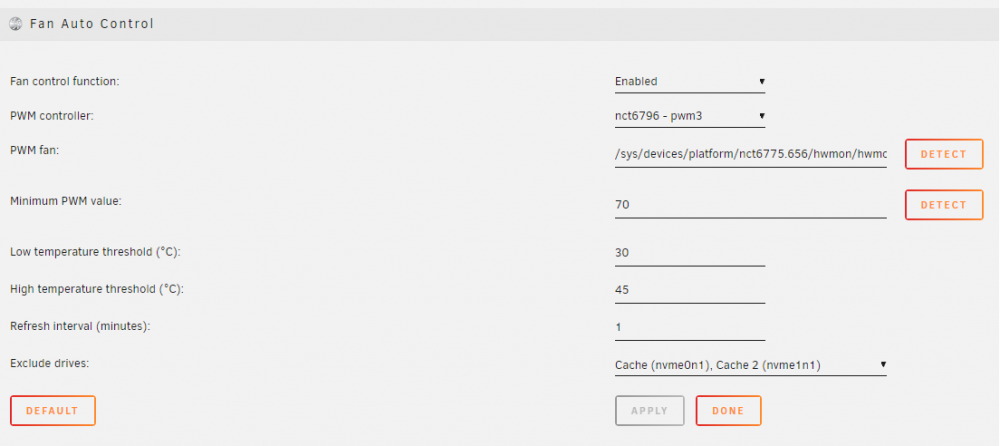
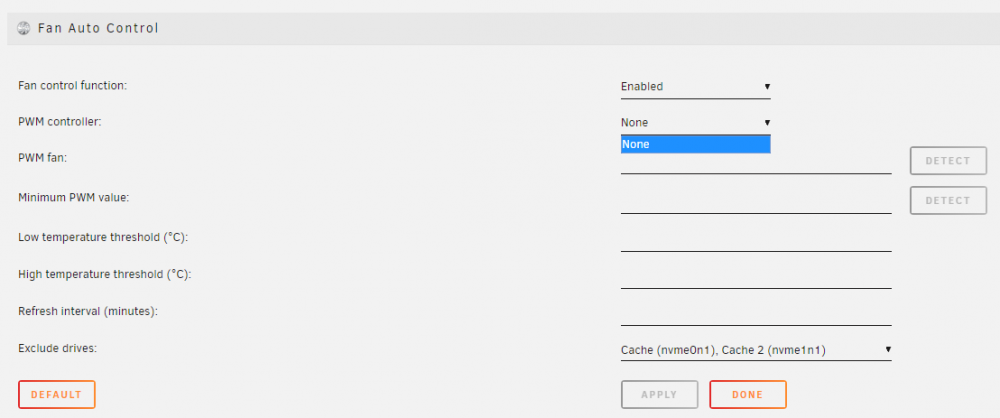
Auto Fan Control stopped working on Asus Z390M-PLUS (NCT6796D / NCT6798D) when upgrading to 6.8.x I built my third UnRAID server last summer running with version 6.7.1. Out of the box most sensors were not detected (eg. the fan speeds), only temperatures were. After a quite a bit of reading in this thread and else where I managed to understand that I needed to manually load the correct driver module with command "modprobe nct6775" which I also put to my go file to make it persist over boot. Everything was fine from sensors perspective and Auto fan control was working pretty nicely (except for the nvme exclusion issue). I recently discovered that the Auto Fan Control had stopped working at some point. It's been several months since I updated to 6.8.x but I suspect it stopped working at that point. I've made zero changes to core/plugin settings in between, only adding/changing dockers. Any help is well appreciated. This is a really long post but it is mostly debugging info for the devs. It could well be that this will be solved when moving to 5.x kernal with Unraid 6.9. This is how it shows in the UI comparing 6.7.x and 6.8.3. I took the 6.7.x screenshot last summer when I got it working. Unfortunately I did not take notes about the results of "sensors" or "sensors-detect" outputs or any other debugging I did back then. 6.7.x Fan Auto Control UI 6.8.3 Fan Auto Control UI Some facts: Unraid 6.7.x included lm-sensors 3.5.0 which added support for "Nuvoton NCT6796D" detection. Unraid 6.8.0 included lm-sensors 3.6.0 which adds support for "Nuvoton NCT6798D " detection. sensor-detect actually now detects my chipset "Found `Nuvoton NCT6798D Super IO Sensors' Success!(address 0x290, driver `nct6775')" What I'm confused / unsure of: Which sensors my Z390M-PLUS actually has, Nuvoton NCT6796D or Nuvoton NCT6796D? 6.7.x said it was NCT6796D as some other internet sources but now in 6.8.3 it is detected as NCT6798D. "modprobe nct6775" seems to run fine, there are no error messages displayed like in this report from 5.4/5.5 kernel version. Dynamix System Temp plugin change log states on 2019.11.03 "Do not load script 'sensors-detect' when Unraid version is 6.8 or higher". There is no similar change on Dynamix System Autofan plugin change log. 6.8.3 sensors output acpitz-acpi-0 Adapter: ACPI interface temp1: +27.8°C (crit = +119.0°C) coretemp-isa-0000 Adapter: ISA adapter CPU Temp: +47.0°C (high = +82.0°C, crit = +100.0°C) Core 0: +47.0°C (high = +82.0°C, crit = +100.0°C) Core 1: +46.0°C (high = +82.0°C, crit = +100.0°C) Core 2: +46.0°C (high = +82.0°C, crit = +100.0°C) Core 3: +44.0°C (high = +82.0°C, crit = +100.0°C) Core 4: +45.0°C (high = +82.0°C, crit = +100.0°C) Core 5: +44.0°C (high = +82.0°C, crit = +100.0°C) 6.8.3 sensors-detect output (the first two essential parts) # sensors-detect version 3.6.0 # Board: ASUSTeK COMPUTER INC. PRIME Z390M-PLUS # Kernel: 4.19.107-Unraid x86_64 # Processor: Intel(R) Core(TM) i5-8400 CPU @ 2.80GHz (6/158/10) This program will help you determine which kernel modules you need to load to use lm_sensors most effectively. It is generally safe and recommended to accept the default answers to all questions, unless you know what you're doing. Some south bridges, CPUs or memory controllers contain embedded sensors. Do you want to scan for them? This is totally safe. (YES/no): Silicon Integrated Systems SIS5595... No VIA VT82C686 Integrated Sensors... No VIA VT8231 Integrated Sensors... No AMD K8 thermal sensors... No AMD Family 10h thermal sensors... No AMD Family 11h thermal sensors... No AMD Family 12h and 14h thermal sensors... No AMD Family 15h thermal sensors... No AMD Family 16h thermal sensors... No AMD Family 17h thermal sensors... No AMD Family 15h power sensors... No AMD Family 16h power sensors... No Hygon Family 18h thermal sensors... No Intel digital thermal sensor... Success! (driver `coretemp') Intel AMB FB-DIMM thermal sensor... No Intel 5500/5520/X58 thermal sensor... No VIA C7 thermal sensor... No VIA Nano thermal sensor... No Some Super I/O chips contain embedded sensors. We have to write to standard I/O ports to probe them. This is usually safe. Do you want to scan for Super I/O sensors? (YES/no): Probing for Super-I/O at 0x2e/0x2f Trying family `National Semiconductor/ITE'... No Trying family `SMSC'... No Trying family `VIA/Winbond/Nuvoton/Fintek'... Yes Found `Nuvoton NCT6798D Super IO Sensors' Success! (address 0x290, driver `nct6775') Probing for Super-I/O at 0x4e/0x4f Trying family `National Semiconductor/ITE'... No Trying family `SMSC'... No Trying family `VIA/Winbond/Nuvoton/Fintek'... No Trying family `ITE'... No 6.8.3 lsmod | grep "nct6775\|coretemp" root@TMS-740:~# lsmod | grep "nct6775\|coretemp" nct6775 53248 0 hwmon_vid 16384 1 nct6775 coretemp 16384 0 6.8.3 modinfo nct6775 root@TMS-740:~# modinfo nct6775 filename: /lib/modules/4.19.107-Unraid/kernel/drivers/hwmon/nct6775.ko.xz license: GPL description: Driver for NCT6775F and compatible chips author: Guenter Roeck <[email protected]> depends: hwmon-vid retpoline: Y intree: Y name: nct6775 vermagic: 4.19.107-Unraid SMP mod_unload parm: force_id:Override the detected device ID (ushort) parm: fan_debounce:Enable debouncing for fan RPM signal (ushort) 6.8.3 "modprobe -r nct6775", "modprobe nct6775", "dmesg | grep nct6775" root@TMS-740:~# modprobe -r nct6775 root@TMS-740:~# modprobe nct6775 root@TMS-740:~# dmesg | grep nct6775 [ 54.436001] nct6775: Enabling hardware monitor logical device mappings. [ 54.436046] nct6775: Found NCT6796D or compatible chip at 0x2e:0x290 [ 2567.110309] nct6775: Found NCT6796D or compatible chip at 0x2e:0x290
-
First, thank you for your hard work! This looks very promising! I'm running 6.6.7. I'm using default settings for the plugin after just installing it. I'm configuring the device locations and I'm experiencing very long save times (30-60s). Sometimes it seems to timeout and result in an empty white page. If I then immediately refresh the settings page an error for SQLite for being locked is being displayed. After a short while (~1 minute) the configuration page refreshes and the settings have seem to be saved properly. Warning: SQLite3::querySingle(): Unable to execute statement: database is locked in /usr/local/emhttp/plugins/disklocation/pages/sqlite_tables.php on line 258 Warning: SQLite3::exec(): database is locked in /usr/local/emhttp/plugins/disklocation/pages/sqlite_tables.php on line 288 database is locked Warning: SQLite3::exec(): cannot start a transaction within a transaction in /usr/local/emhttp/plugins/disklocation/pages/sqlite_tables.php on line 321 cannot start a transaction within a transaction Warning: SQLite3::query(): Unable to prepare statement: 5, database is locked in /usr/local/emhttp/plugins/disklocation/pages/sqlite_tables.php on line 329 Fatal error: Uncaught Error: Call to a member function fetchArray() on boolean in /usr/local/emhttp/plugins/disklocation/pages/sqlite_tables.php:330 Stack trace: #0 /usr/local/emhttp/plugins/disklocation/pages/system.php(53): require_once() #1 /usr/local/emhttp/plugins/dynamix/include/DefaultPageLayout.php(418) : eval()'d code(2): require_once('/usr/local/emht...') #2 /usr/local/emhttp/plugins/dynamix/include/DefaultPageLayout.php(418): eval() #3 /usr/local/emhttp/plugins/dynamix/template.php(62): require_once('/usr/local/emht...') #4 {main} thrown in /usr/local/emhttp/plugins/disklocation/pages/sqlite_tables.php on line 330 It seems like the SQLite is working very slowly and the above error is just the original save query still running and locking the db. Where is this SQLite database stored? Any ideas what could be causing this very slow save? Edit: Also the initial loading of the plugin's front page (devices) takes a long time. Switching to other "tabs" is immediate.
-
Migrating from Limetech to binhex I'm currently using the Limetech Plex docker. I'm considering moving to binhex's PlexPass docker. However I'm really concerned about messing the Plex database in this process. There are posts about this and the common advice is to make a backup of the appdata and just copy the path settings from the old container to the new one. In my mind the appdata (/config) itself is not a problem but the reference to the media might be: Limetech Host Path 1 (Container path /mnt/): /mnt/ Binhex Host Path 2 (Container Path: /media): /media Looking at the media info inside Limetech Plex I can see that files are referenced with a starting path of "/mnt/user/movies/Aquaman...". When moving to binhex the files would be found in /media/movies/Aquaman...". I'm worried that Plex will see all movies/tv-shows missing and then re-create all entries losing all the relevant user data (watched, added on etc.). Has someone done this? How did Plex survive from changing the root media folder? Did it just update the file locations once the library settings were corrected? Or did it go for a full re-creation? Any help is well appreciated! Edit: Found an official Plex guide for moving content to new location: https://support.plex.tv/articles/201154537-move-media-content-to-a-new-location/. I guess this is something I have to do then. Edit2: EPIC fail! The config folder structures are not the same. The binhex Plex started with an empty database which it created next to the old Limetech Plex database. This resulted in Plex starting with the new installation wizard. Comparing the folder structures, it seems that it will be quite a bit more complicated to make this work. Limetech: /config/Library/Application Support/Plex Media Server Binhex: /config/Plex Media Server Edit3: Moving the "Plex Media Server" folder to the root of the config folder fixed the problem. I'm still in middle of updating my libraries but so far everything is going according to the Plex guide. All metadata seems to stay correct, only the media file location is updated.
-
Installing older version of the System Stats plugin which supports unRAID 6.6.x I've got a really old version of system stats running and I'm unable to update it to the latest because the latest supports only 6.7.0rc. The following is relevant only if you are currently running a version older than 29.8.2018 and would like to update to latest 6.6.x compatible which is 29.8.2018 release. There are several posts about this but no definitive answer yet. I dig around and found this post from Squid which says that simply copying the old versions of the plugins plg and txz files to correct folders on flash and then rebooting should work. Simply installing it with "plugin install ..." will not work since though pointing to an older version of the plg it will still try to download the latest txz. Browsing the Bergmans Github for Dynamix V6 I found out that for each latest file version there are also all the previous versions available. Comparing history to System.Stats release notes, the last version supporting 6.6 is from 29.8.2018. So the links below are to that release. So here it goes: Download 29.8.2018 version plg file from here. Copy the plg file to flash into folder /config/plugins Download 29.8.2018 version txz file from here Copy the txz file to flash into folder /config/plugins/dynamix.system.stats Restart the server (no way around this) Hope this helps.
-
I have yet to figure this one out using the docker bandwidth limiter. But I took a different approach; previously I used my cache only for dockers/vms. I had thought that using cache also for array shares would wear the SSDs out. But since most of the writes are actually originating from the dockers, the cache write will be a simple rename/move. So there is no extra wear on the cache drives since the files are already there under /mnt/cache/appdata. Using cache will also make the "move" from docker's folder to share immediate. This is a basic feature that many use but I at least had not thought about it in this context; protecting the array from saturation during day time. I had only thought it as a way to increase the array write speed. Short list of steps: Stopped array Activated cache disk in Settings -> System Settings -> Global Share Settings -> Cache Settings. Min free space 100GB. Configured a daily (or better nightly) mover in Settings -> User Preferences -> Scheduler -> Mover Settings Configured relevant shares (movies, tv-shows, sports) to use cache disk (Use cache disk: Yes) Configured my appdata to be only on cache disk (Use cache disk: Only) Started array
-
The syntax part is a bit confusing. The official Docker documentation does not provide an example for these parameters: https://docs.docker.com/engine/reference/commandline/run/ Majority of the examples found use the "—-device-write-bps=/dev/mdX:10mb" syntax. Based on the error message given when I tried to start the container, the problem is not with the syntax but with the device definition itself. I really do not want to experiment the device identifier too much since on the first time the whole container app disappeared. Hopefully someone would now what device identifier should be used here. I might experiment using a single disk device and test if this works at all. I know which disk is currently the high water target.
-
I recently migrated my two old unRAID/Plex servers to a new 24-bay server. Everything else is working very nicely but whenever a docker app starts to transfer files from cache disk to array some of my not-so-well-built Plex clients like Samsung TV's experience buffering with UHD-Blu-ray material. My cache disk is a dual 500GB M.2 NVMe BTRFS pool. As part of the migration I upgraded my parity to 8TB WD Red. Data disks are ranging from a single 8TB WD RED to 4/3 TB WD Reds and Greens. I've analysed the problem to be IO saturation on the write target disk. I'm using high water mark allocation so the likelihood of writes taking place on the same disk as the playback of latest movie is pretty high. I'm seeing 50+MBps write speed and looking at iotop and atop the targer disk seems saturated. I searched and found that you can limit the io with docker. Eg: https://stackoverflow.com/questions/36145817/how-to-limit-io-speed-in-docker-and-share-file-with-system-in-the-same-time I tried to give that as an extra parameter to the docker but it failed. I cannot figure out what the device path should be here. I tried shfs but that does not work. --device-write-bps=shfs:10mb What is the correct device path if I want to limit the docker app's write speed to any user share? As a side note, I lost the whole docker when the start failed. I had to manually remove the parameter from the my-zzzz.xml and re-add the docker. Got the instruction from here: https://www.reddit.com/r/unRAID/comments/8bej8p/how_to_get_back_a_missing_docker_after_changing/
-
This was a good guess; I had my old 2.5" cache SSD still connected. It did not show temperature in the dashboard so I did not even think about it. I disconnected it but still the same problem. Autofan is reporting way higher highest temperature what is shown for any hdd in the system (37 vs 45) and still also the nvme cache drives are not matching it (42 vs 45). But I think it could be the nvme cache drives, the Unraid dashboard must have some polling interval so the 42 vs 45 difference could be explained by that. I'll let it run for a bit longer and see if these values eventually become the same. I guess using M.2 NVMEs are still pretty rare which could explain why no one else has ran into this. It would make debugging easier If the autofan logged the disk with the highest temperature. Edit 23.3.2019 11:06 (GMT+2): I'm quite certain that the max temp is read from the cache nvme drives. The temps are now stabilised and the only drive with ~1C range from the one reported by autofan is my cache 1 nvme. So the nvme exclusion does not work correctly in autofan. I have now as workaround adjusted the high limit accordingly and hoping that there is sufficient correlation from the cache drive temp to the hdd drive temps.
-
I just installed this Akasa three-way splitter: http://www.akasa.com.tw/search.php?seed=AK-CB002 Worked very nicely and the pwm line is connected only to one of the fan headers. I excluded my two M.2 cache drives from the monitor since they run much hotter than the front mounted HDDs. However autofan does not seem to work properly. It is logging the following: Mar 21 22:49:33 TMS-740 ool www[7904]: /usr/local/emhttp/plugins/dynamix.system.autofan/scripts/rc.autofan 'start' Mar 21 22:49:33 TMS-740 autofan: autofan process ID 23144 started, To terminate it, type: autofan -q Mar 21 22:49:33 TMS-740 autofan: autofan excluding drives nvme0n1,nvme1n1 from max temp calculations Mar 21 22:49:38 TMS-740 autofan: Highest disk temp is 45C, adjusting fan speed from: FULL (100% @ 2436rpm) to: 190 (74% @ 1904rpm) At the same time all HDD's are below 38 and only the M.2 NVMEs are over 40. Even the NVMEs do no match that 45 when viewed through Unraid dashboard which is reporting 42. Is this a common issue or what could be the problem?
-
First, thnx for an awesome collection of tools! I'm using several of these, they were easy to setup and are working perfectly. The only one I had slight trouble was the Auto Fan Control aka System Autofan. Dynamix Auto Fan Control This seems to support controlling only one fan? I have three fans behind my drives and I already ordered an Akasa 1 -> 3 pwm fan splitter for this purpose. Just trying to make sure I've understood this plugin correctly. I also had to insert "modprobe nct6775" command in my go script to have my fan sensors detected. I have newish Asus Prime Z390M-PLUS motherboard. It was kind of hard to find which sensor module to use since basically none of the threads with "unraid fan control" did not help. Once I had realised that "sensors", "sensors-detect" and "modprobe" were the magic commands, things got a bit easier. However in my case the "sensors-detect" did not find the nct6775, instead I found it on Asus's forums. Is there a writeup on this matter somewhere? Google for sure does not return it among 20ish first hits.
-
Thnx for your hard work! Got this working pretty nicely and was able to replace my previous Win10 based qBittorrent + Viscosity setup without any problems. Definitely container worthy of a donation I made a small write-up for all the things I did from start to finish. It's not a guide but might help others with less experience with unRAID/Docker/qBittorrent/OpenVPN. I preferred to store downloads under data instead of the default config folder. Installation steps Start installation through Community Apps Modify docker configuration Data-path -> /mnt/cache/apps/qbvpn/data Config-path -> /mnt/cache/apps/qbvpn/config (hidden option) VPN username/password LAN-network -> 192.168.88.0/24 PUID -> 0 (root) PGID -> 0 (root) Apply -> starts downloading docker and creates folders/files in above mentioned locations Copy OpenVPN configuration file and certification to /config/openvpn (/mnt/cache/apps/qbvpn/config/openvpn) crl.rsa.2048.pem ca.rsa.2048.crt xxxxxx.ovpn Access qBittorrent webUI through \\tower:8080 Username: admin Password: adminadmin Modify qBittorrent settings "Default save path": /data/finished "Keep incomplete torrents in: /data/download Speed: set rate limits to your liking (full speed at night, lower day time in my case) Bittorrent: to your liking. Torrent queuing, slow torrents and seed ratio Test by adding a torrent download All set, enjoy torrenting with VPN Notes: An error is logged related to iptable_mangle. This only affects access to webUI outside LAN so if you do not need it, you can ignore the error. See Q2 for more details: https://forums.unraid.net/topic/44108-support-binhex-general/?tab=comments#comment-433613 There is another similar error logged related to /lib/modules/tun.ko. This might be related to iptable_mangle issue but I could not find definitive answer in the forums. Everything seems to work properly. Best hit so far: https://forums.unraid.net/topic/44109-support-binhex-delugevpn/?do=findComment&comment=545471
-
Based on the specs of Noctua NF-R8 and SwiF2-801 you should get better cooling from Noctua when using it without any adapters. With the low-noise-adapter it should move about the same amount of air as the Swif2. But airflow isn't the only parameter, generated air pressure could play a crucial part in this. I really don't know since there isn't too much concrete test results available for hd-cage cooling which isn't comparable to the normal case or CPU cooling. Noctua NF-R8 53 m³/h (17dBA) Noctua NF-R8 with L.N.A. 39 m³/h (10dBA) Noctua NF-R8 with U.L.N.A. 26 m³/h (7dBA) Swif2-801 40m³/h (11dBA) So if you are getting better real-life performance with the Swif2-801 you should definitely use that since it's only 11dBA compared to Noctua NF-R8 17dBA.
-
I have only part of my drives in the 5-in-3 cages. Unfortunately none of the HD103UJ @7200RPM are in the cages. However I have recently added some smaller disks scrapped from external USB-cases to give some further insight. There is 8 drive s Below are the temps 3 hours into parity sync. Top cage: Parity Samsung HD_204UI 42C Disk9 Samsung HD_204UI 42C Disk10 Samsung HD204UI 40C Disk11 WD20EARX 41C Bottom cage: Disk12 WD5000AAKS 41C Disk13 WD5000AAKS 42C Internal HD rack (3 x 92mm fans, 10mm spacing) Disk1 Samsung HD103UJ 29C Disk2 Samsung HD103UJ 30C Disk3 WD20EZRX 33C Disk4 Samsung HD103UJ 30C Disk5 Samsung HD103UJ 30C Disk6 Samsung HD103UJ 29C Disk7 Samsung HD103UJ 29C Disk8 Samsung HD103UJ 30C So the temps are ~10C higher in the cages. With the stock cage fans, the cage temps were ~5C lower.
-
The SWiF2 fans are rated at 23,4CFM compared to <32CFM from the Silenx Effizio EFX-08-15T. I would not expect SWiF2 to be any better or there is something wrong with your Silenxs. Could it be the thermistor placement? To be clear, on my system the Silenxs do run ~5C hotter than the stock fans but are far more quieter. At least on my units the stock fans were noisy but I'm quite sensitive to fan noise. Noctua NF-R8 will for sure move ~32CFM (17dBA) of air and you can always use the adapters to go lower. I'm using Noctua for all other fan purposes and they are excellent. In the future I will most likely go with them also for the cage replacement.
-
So you were running at around 40C with the stock fans? As I wrote here I'm seeing drive temps in 35-37C during parity calculation with the SilenX Effizio. So the difference must be in the drives and/or the case. I'm mostly running Samsung Spinpoints which are pretty cool and I do have multiple 120mm fans blowing air out of the back of the case. I wouldn't recommend going over 45C.
-
I think I'm getting a bit confused. Looking at the pictures below you can see that Seasonic X650 has three individual outputs for SATA/IDE and Corsair TX850M has two. Reading from this thread also a single wire run has a maximum current which has to be taken into account. In the thread it was stated to be 20-24A for 18 cauge wire but this page states that it is 16A for 18 cauge case wiring. Compare it to the 11A for Molex pin and I'm now totally confused. If those number are correct, the limiting factor is the amount of individual cable runs from the PSU and you would not get anywhere near the 20 drives with either of the mentioned PSUs when using non-green drives. Am I missing something here? Seasonic X650 http://images.bit-tech.net/content_images/2010/08/zero-noise-seasonic-s-x-series-fanless/seasonic-fanless03.jpg Corsair TX850M http://content.hwigroup.net/images/products/xl/126934/2/corsair_enthusiast_tx850m_850w.jpg
-
Point taken, thanks for the clarification. As you said in a previous message, using molex splitters anywhere outside the PSU will not help. Thus you would need two separate outputs for each cage. For a 20 drive system with 4 cages this would mean 8 outputs. I think such amount is quite rare, for instance Corsair TX850M which is otherwise sufficient for 20 drives has only two separate outputs. I think for larger systems the only option to provide safety is to use green drives.
-
This is only sensible if using all green drives. The maximum current specification for a molex pin is 11A (for a new connector). As the components age, the electrical resistance (power loss and heat generation) will increase - a potential source of problems. Using a power splitter cable will only move the weak point in the system. Five non-green drives can exceed the 11A specification. Which drives would cause a continuous power consumption of 26,4W/drive (11*12/5)? For instance WD 3TB Greens are maxing out on spin up to 10,24W and 4,96W under constant load (source). I assume that short time spin up loading would not cause any problems even with an ageing connector. I'm definitely not an expert on this subject so these were real questions
-
Those figures were for writing to disk shares. Going through user shares will give you some performance penalty. For me it does not matter since I'm one of those users who always write through disk shares and only use user shares for read-only "publishing" to the clients (Plex Media Centers and Plex Home Theaters in my case). This works very nicely if you are mostly filling disks one by one. As a bonus it prevents any accidental modification of the files by the clients.
-
I forgot the main point from my first post or at least I forgot to emphasise it Even though I did not see any change in parity check speed the actual write speed definitely benefited from the changed disk settings (40 -> 50MBps write speed over the network). Regarding the add-in cards, I'd recommend using well proven models like the Supermicro AOC-SAS2LP-MV8. It for instance has capacity of 600MBps per channel so you have 150MBps per drive. The card is PCI-e x8 v2.0 so it has a maximum throughput of 4000MBps (8 x 500MBps) which is 500MBps per port. Even if you attach it to a x4 slot you will be getting the max performance of 150MBps. I will be building a 24 drive system soon, so I will have a chance to test this further. And most importantly, keep up the good work!
-
Hmmm, are you sure that the one data disk situation is handled in a special way? The only thing which could be optimised (=left out) here is the XOR operation over the bits/blocks of the data disks since there is only one. I would expect my parity check speeds to be identical if I would add second or third WD Green 3TB data disk. In my 2009 build I had four identical Samsung F1 1TB and I saw identical parity check speeds regardless of the number of data disks. Even now with 13 drives I'm seeing similar speeds. Everything is done in parallel and if you don't have any bottlenecks in the interfaces the speed should not change. I've always taken care to not cause any bottlenecks and used appropriate HBAs and MB ports. But I will anyway add more disks to the test system and will get back with the results.
-
I'm doing different kinds of performance tests with a new unRAID build. I just posted some of my findings to the Jumbo frame topic: http://lime-technology.com/forum/index.php?topic=29124.msg260786#msg260786. When I built my first unRAID system back in 2009 I performed quite extensive testing using IOZone: http://lime-technology.com/forum/index.php?topic=3958.0. All the scripts are there so you could easily utilise them. There are also quite a few hints for caveats to look for like how to prevent cached reads/writes. I also executed the test script from this thread with the results at the end of this message. For me the parity check speed is irrelevant as long as the total time is less than 8 hours so it can be performed at night time. Even if it took longer there is no real problem since parity check does not affect my normal usage. I can easily stream multiple high-bitrate mkv's through Plex in direct mode while parity check is in progress. Fully understand that this might not be case when using older hardware but even my 2009 built system (details in sig) can manage multiple streams while parity check is in progress. Media streaming is small potatoes to an unRAID system, in theory you could run ~20 50Mbps bitrate streams especially if there were multiple disks involved. Since unRAID with modern disks and interfaces can easily saturate 1Gbps when reading, the only thing that matters is write speed. Before performing the unraid-tunables test I tested Weebotech's settings found here: http://lime-technology.com/forum/index.php?topic=29009.msg260640#msg260640. On the new system I was using stock settings and getting ~40MBps write speed over the network and locally. When I applied the new settings the write speed jumped to ~50MBps. But the speed is fluctuating, sometimes going over 80Mbps and some times less than 30Mbps. I will do some more experimenting this evening and reports back. From results below you can see that there is basically no change what so ever. It makes me wonder whether there is something wrong with script or did my non-stock settings some how interfere with the test. If there is no problem with the results then the whole concept of optimising these settings based on the parity sync speed is a totally wrong approach and you should be focusing only on the real read/write performance of the system. I did read through the whole thread and I think that is the way you are already going. If you want to measure only raw throughput then dd is fine but even then you must take care of cached reads/writes. This involves either using very large data files (> 3-5 times system memory size) and flushing the caches between tests. My scripts in the IOZone thread contain the commands for flushing. If real life usage is more than just raw transfers (eg. databases), then IOZone is perhaps the easiest benchmarking tool. As a small note for the test script, it seemed to force to apply either the Best for Buck or Unthrottled settings. I couldn't see an option for using original settings so I cancelled the script with ctrl-c at that point. Tunables Report from unRAID Tunables Tester v2.2 by Pauven NOTE: Use the smallest set of values that produce good results. Larger values increase server memory use, and may cause stability issues with unRAID, especially if you have any add-ons or plug-ins installed. Test | num_stripes | write_limit | sync_window | Speed --- FULLY AUTOMATIC TEST PASS 1 (Rough - 20 Sample Points @ 3min Duration)--- 1 | 1408 | 768 | 512 | 144.2 MB/s 2 | 1536 | 768 | 640 | 144.7 MB/s 3 | 1664 | 768 | 768 | 144.7 MB/s 4 | 1920 | 896 | 896 | 144.7 MB/s 5 | 2176 | 1024 | 1024 | 144.7 MB/s 6 | 2560 | 1152 | 1152 | 144.7 MB/s 7 | 2816 | 1280 | 1280 | 144.7 MB/s 8 | 3072 | 1408 | 1408 | 144.7 MB/s 9 | 3328 | 1536 | 1536 | 144.7 MB/s 10 | 3584 | 1664 | 1664 | 144.7 MB/s 11 | 3968 | 1792 | 1792 | 144.7 MB/s 12 | 4224 | 1920 | 1920 | 144.7 MB/s 13 | 4480 | 2048 | 2048 | 144.7 MB/s 14 | 4736 | 2176 | 2176 | 144.7 MB/s 15 | 5120 | 2304 | 2304 | 144.7 MB/s 16 | 5376 | 2432 | 2432 | 144.7 MB/s 17 | 5632 | 2560 | 2560 | 144.7 MB/s 18 | 5888 | 2688 | 2688 | 144.7 MB/s 19 | 6144 | 2816 | 2816 | 144.7 MB/s 20 | 6528 | 2944 | 2944 | 144.7 MB/s --- Targeting Fastest Result of md_sync_window 640 bytes for Final Pass --- --- FULLY AUTOMATIC TEST PASS 2 (Final - 16 Sample Points @ 4min Duration)--- 21 | 1424 | 768 | 520 | 144.7 MB/s 22 | 1440 | 768 | 528 | 144.7 MB/s 23 | 1448 | 768 | 536 | 144.7 MB/s 24 | 1456 | 768 | 544 | 144.7 MB/s 25 | 1464 | 768 | 552 | 144.7 MB/s 26 | 1472 | 768 | 560 | 144.7 MB/s 27 | 1480 | 768 | 568 | 144.7 MB/s 28 | 1488 | 768 | 576 | 144.7 MB/s 29 | 1496 | 768 | 584 | 144.7 MB/s 30 | 1504 | 768 | 592 | 144.7 MB/s 31 | 1520 | 768 | 600 | 144.7 MB/s 32 | 1528 | 768 | 608 | 144.7 MB/s 33 | 1536 | 768 | 616 | 144.7 MB/s 34 | 1544 | 768 | 624 | 144.7 MB/s 35 | 1552 | 768 | 632 | 144.7 MB/s 36 | 1560 | 768 | 640 | 144.7 MB/s Completed: 2 Hrs 7 Min 4 Sec. Best Bang for the Buck: Test 1 with a speed of 144.2 MB/s Tunable (md_num_stripes): 1408 Tunable (md_write_limit): 768 Tunable (md_sync_window): 512 These settings will consume 5MB of RAM on your hardware. Unthrottled values for your server came from Test 21 with a speed of 144.7 MB/s Tunable (md_num_stripes): 1424 Tunable (md_write_limit): 768 Tunable (md_sync_window): 520 These settings will consume 5MB of RAM on your hardware. This is -11MB less than your current utilization of 16MB. NOTE: Adding additional drives will increase memory consumption. In unRAID, go to Settings > Disk Settings to set your chosen parameter values.
-
Very nice review! One note; it is optional to use both power connectors. It would make sense only if you have a redundant power supply with two independent power lines. I'm running these cages with a single power connector. Fully agree about cable management. Even though you normally get only 4 ports from a single SAS HBA channel, it still makes creating a neat cabling a much easier task. In my case I chose to combine a single port from motherboard for each cage to get to 5 ports needed.
-
Yes, I did purchase two cages and I've been really pleased with them. The overall build quality is very nice and the drive trays connect promptly to the back plane. I replaced the cage fans actually two times. First I got the Nexus PWM referred in my previous post but since the cage offers only 3-pin connector the fan was actually louder than the original since it was running at full speed all the time. The second time I decided to try something different and got these: SilenX Effizio 80mm Thermistor, max.1700rpm, http://www.silenx.com/quiet.fans.asp?sku=efx-08-15t The replacement fans are excellent, even during parity check temps stay in 35-37C range and I cannot hear the fans (I have 4 Samsung 2TB F4 Green drives in each cage). I guess you could take any fixed rpm fan with similar stats (35CFM, <15dbA) to get sufficient cooling with near to silent operation. The fan replacement for each cage took 7 minutes (I timed it in the second run) even with some tinkering. Just follow the instructions in Greenleaf blog.
-
From the Greenleaf review I read: "The stock fan is a 4-pin model, however the backplane provides only 3 pins to power the fan. The good news regarding fan replacement is that any standard 3-pin or 4-pin 80 mm fan will work." Isn't a 4-pin model the same as a PWM fan? And if I'm connecting a PWM/4-pin fan to 3-pin connector I will simply loose the fan control and the fan will run at full speed?


