


henris
Members
-
Joined
-
Last visited
Everything posted by henris
-
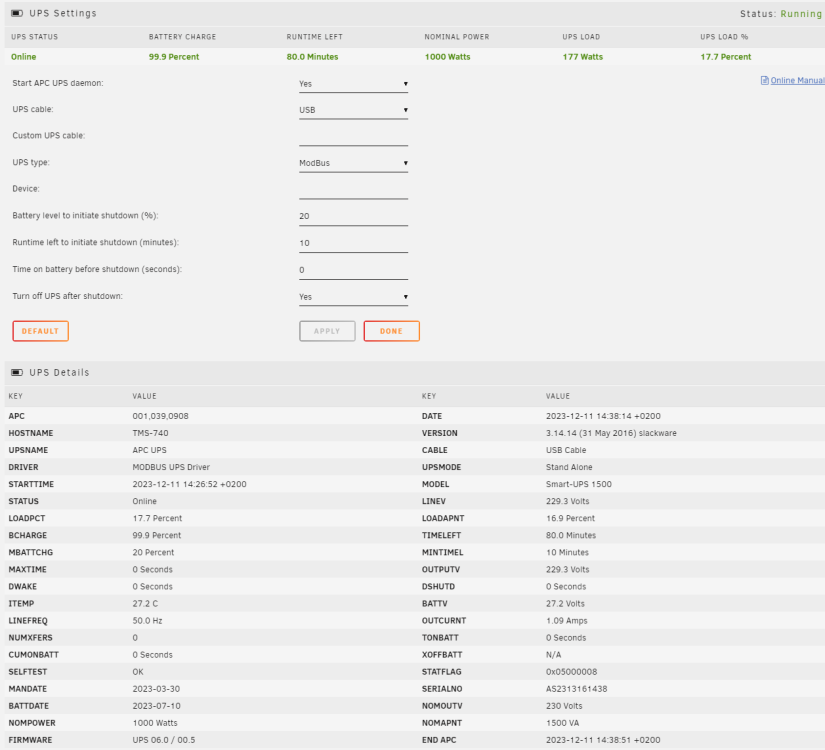
Just got a SMT1500RMI2UC and was getting desperate. Thank you for posting the solution! With my model the behavior is exactly same. Enabling modbus on the UPS and setting the Unraid APC UPS daemon to use USB/Modbus results in garbage values. I restarted the APC UPS daemon after I had unplugged and replugged the USB-cable. So you can do it in that order too I guess. Simply restarting the daemon without unplugging the USB did not work. I have set my UPS to power off after shutdown so I will be manually starting the server and can check that APC UPS daemon initializes properly. Still it is an extra thing to worry about so it would be great to have this working properly. I was getting the basic information with USB/USB connection but was missing nominal power, usage and others. With USB/Modbus I get it all which is nice for my InluxDB/Grafana setup. My previous Back-UPS Pro worked with USB/USB out of box. As a side note this model has an integrated ethernet but it works only with the cloud based monitoring. No local web management or control. I did not understand this when ordering. To get proper web based management and PCNet/SNMP functionality I would have to buy the optional network management card. I feel a bit cheated...
-
I was able to read the missing Home Assistant VM image when I mounted the SSD on Ubuntu Live usb. The BTRFS file system was mounted in degraded mode and all the files were readable. When I tried the same when the SSD was mounted in Unraid, some of the files were unreadable. In the mean while the re-created cache pool with the new SSDs has been functioning properly. It is still a BTRFS pool, I will make the switch to something else once I have upgraded my server. I still have an opinion that BTRFS is missing critical troubleshooting and management tools for pools and is not meant for production. In my mind it is a summer project which has the functionalities but was left unfinished regarding the non-functional aspects.
-
Re-created docker image: Read the instructions here: Made sure I had all the docker templates backed up if anything went haywire in the process. These are stored in the flash /boot/config/plugins/dockerMan/templates-user Deleted the docker image using GUI (docker service was already stopped) Started docker service Installed all needed dockers through Apps/Previous Apps page. I also checked the cache pool's filesystem integrity before the above: Started the array in maintenance mode Run the check through GUI (btrsfs check /mnt/cache/ did not work for some reason) Results seemed ok -> cannot explain the corruption of docker image and windows vm image [1/7] checking root items [2/7] checking extents [3/7] checking free space tree [4/7] checking fs roots [5/7] checking only csums items (without verifying data) [6/7] checking root refs [7/7] checking quota groups skipped (not enabled on this FS) Opening filesystem to check... Checking filesystem on /dev/nvme0n1p1 UUID: 39320790-03d4-4117-a978-033abe08a975 found 309332566016 bytes used, no error found total csum bytes: 301153416 total tree bytes: 941031424 total fs tree bytes: 576176128 total extent tree bytes: 43843584 btree space waste bytes: 138846305 file data blocks allocated: 1659942002688 referenced 308089815040
-
Like always the celebration was too early... There seems to be quite some corruption in different places. My other Windows vm has a corrupted filesystem beyond repair. Also the docker file seems corrupt. The docker service hang and I was unable to get dockers to stop. Now rebooting the server. I will try to get the cache pool in unmounted state so I can run filesystem check. Then I will decide if I will just revert to previous docker backups and re-create the docker image.
-
I just successfully re-created my 2 x NVMe SSD cache pool replacing old 500GB with 1TB. Steps: Stopped VM/Docker services Created full backup of cache pool contents with "rsync -av" to a separate SSD Shutdown the server Replaced the SSDs Started the server Had some jitters since the server refused to boot from usb. Hav had this issue occasionally and finally it booted. Did not change any settings. I think it is due the Asus mb bios getting confused about the 25+ potential boot drives. Took the usb out, made a copy of it to make sure it was still fine and put it back in. And the Unraid was booted. Stopped the array Assigned the new SSDs to cache pool Formatted the SSDs Restored the cache pool contents with "rsync -av" Started VM/Docker services Started verifying docker services. Still going through them but the main ones like Plex seemed to be fully functional. I will check logs for any suspicious issues but looks good so far. Short rant about BTRFS pool management and troubleshooting tools: It is a short rant since there ain't no tools for seeing the pool or device status. Pool was in read-only mode and there was no way to see it One of the two devices of the pool had failed and there was no way to see it The only thing "visible" of any issue was the BTRFS device error counts which are NOT reflected in the Unraid GUI I cannot be sure if the data on the remaining SSD was ok or not. Though apart from one file I was able to copy the data off it. I will be building a new server in the near future. I will be very closely looking at the ZFS pools if they would provide better experience. The only file I lost was hassos_ova-4.16.qcow2. Initially I thought this was no biggie since I could just re-download it if needed. But I soon realised that it was the actual disk image of my Home Assistant environment. And then I realised that I had no backup of it anywhere... Arghh... Having no backup is on me, I cannot understand how I missed backing it up. I still have the old SSDs. I think I will put the non-failed on in a M.2 NVMe enclosure and try to see if the missing file could somehow be recovered. If someone has an idea how to do this, please chime in. If this fails, I guess it is always good to start from scratch sometimes. Fortunately I had mostly prototyping stuff in the HASS but some special things like KNX integration contained own developed parts.
-
Started the replacement process by doing a full rsync archive copy to a standalone SSD: rsync -av /mnt/cache/ /mnt/disks/download/cache_backup/ --log-file=log.txt This seemed to run fine except for one error reported: vm/domains/hassos_ova-4.16.qcow2 rsync: [sender] read errors mapping "/mnt/cache/vm/domains/hassos_ova-4.16.qcow2": Input/output error (5) ERROR: vm/domains/hassos_ova-4.16.qcow2 failed verification -- update discarded. sent 315,302,030,978 bytes received 10,276,919 bytes 447,568,925.33 bytes/sec total size is 296,255,909,280 speedup is 0.94 rsync error: some files/attrs were not transferred (see previous errors) (code 23) at main.c(1330) [sender=3.2.3] If this is the only corrupted file I will be glad. The "hassos_ova-4.16.qcow2" can be just re-downloaded. I will next shutdown the server and replace the two 500GB SSDs with new 1TB ones. Then create a new pool and restore the data to it.
-
Reading from this: - When a drive fails in two disk BTRFS RAID1 pool, the pool continues to operate in read-write mode (though some comments indicate that it might go to read-only mode) - If you reboot in this state, the pool will mounted in read-only mode - You can mount the pool in read-write mode with some special command (degraded mount) I could not find the BTRFS command to see the current state of the pool (read-write vs read-only, general healt, anything). The closest is the "device stats" but it provides cumulative historical data, not the current state. Am I missing something here?
-
I really appreciate your replies but I'm now really confused. According to SMART report my second cache pool NVMe SSD has failed. Surely I cannot just re-format without replacing the failed drive first? The cache pool seems to in read-only mode and files can be read from it without causing any errors in syslog. Should I just start reading BTRFS manual and try to figure out what is going on? How can this (btrfs pool) be part of Unraids critical cache feature if it so fragile and untroubleshootable? Should I just start from scratch and if so is there something better than BTRFS cache pools? ZFS pools? I have already purchased two larger replacement NVMe SSDs since the current ones are already four years old and close to their recommended TBW. I'm willing to bite the bullet and start from scratch but it would be great know that the new mechanism actually worked. The only reason for using RAID1 cache pool was to get protection from drive failure and when the drive failure occurred Unraid was totally unaware of it. Sorry for the ranting, I really like Unraid, it's been serving me well for over a decade. This issue happened at the most inconvenient time and I don't have enough time to investigate this properly.
-
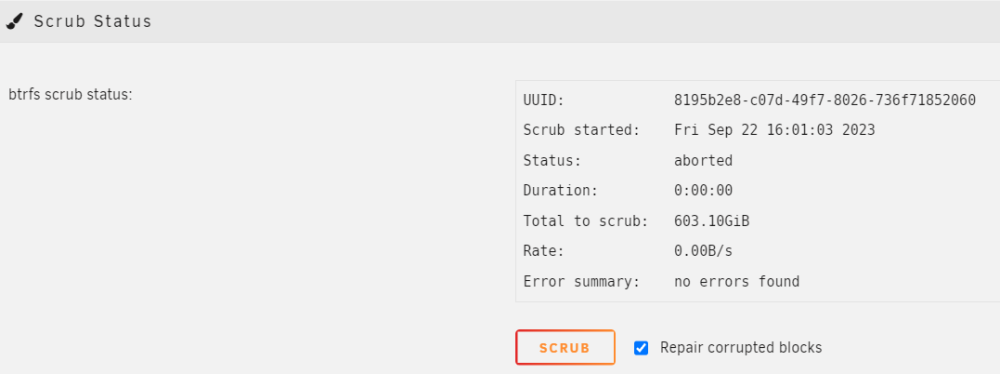
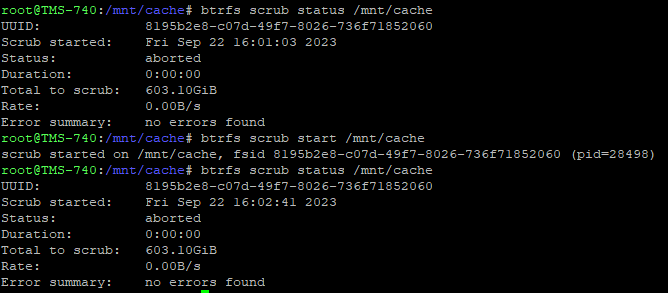
When I try to run scrub via GUI I get "aborted" as the status: And pretty much the same thing via shell: I forgot that I had run the scrub via GUI last night when doing initial troubleshooting. Initially I got the same "aborted" but after I stopped the VMs and Dockers I was able to start the scrub which run for ~ 6 minutes and reported millions of unrecoverable errors. Unfortunately I did not get a screenshot of that result before hitting the Scrub again now...
-
I will do this and post results. Just to be sure; it is safe to run scrub on the pool regardless of the state of the devices in it? This cannot cause any more corruption / data loss?
-
I have a two NVMe SSD cache pool taken into use in 2019 on my second server. We had a power outage and although UPS seemed to allow for controlled shutdown the system was not behaving correctly after restarting the server. I noticed some dockers (Plex) not working correctly and started troubleshooting. I had not received any notifications about issues and also the main Unraid GUI pages (Main, Dashboard, Docker) did not indicate any issue. When I took a look in syslog I saw a flood of BTRFS related warnings and errors. Seemed like the whole server was on fire, well at least the cache pool. I started reading on FAQ and similar problem threads. I got confused fast. I've been using UnRAID since 2009 and pretty good with it but the cache pool BTRFS mechanism, how to see the status of it, how to troubleshoot it and in this case how to fix it seems overwhelming. I've read this FAQ entry and this addition to it. And several troubleshooting threads. And also this "how to monitor btrfs pool for errors" which I will take into use. My questions are: How can I see what is actually broken? From the smart logs and "btrfs dev stats /mnt/cace/" it seems like it is my /dev/nvme1n1p1 SSD which has failed. It just baffles me that this is not at all reflected in the UnRAID GUI. How can I see what data is corrupted or lost? Are there some specific command I can run to see a list of corrupted files? Why would I have corrupted data? I thought running a RAID1 cache pool would protect me from a single cache drive failure but now I seem to have a single drive failure and still experiencing at least functional loss (ie. unable to run dockers properly). What is the recommend way to fix this? I have replacement SSDs ready but I cannot connect them at the same time (only two M.2 slots). I'm especially unsure about trusting the data currently in cache pool. I do have CA backups available. My whole system is currently down so all help is greatly appreciated! I promise to document my path and end result in this thread. Diagnostics attached. This is though AFTER one shutdown but seems to show the same behavior. tms-740-diagnostics-20230922-0733.zip
-
No changelog in UnRaid to my knowledge. I'm keeping my changelog in OneNote. Few lines for each "trivial change" and a separate subpage for larger changes or complex troubleshootings. Also some tailored pages or tables for things like disks and more complex dockers. It is just so much easier to have a compressed logical description of the changes rather than trying to reverse-engineer it from logs if even possible. In my work I use things like Jira for change management but I don't like for personal use (feels too much like work). 99% of all problems come from changes. I can document my own changes and I can try to control other changes with scheduled updates. I have docker updates running on Friday/Saturday night so I have all the weekend to fix things To emphasize the point, I just ran into the 1% and have a failed cache pool drive and potentially corrupted cache pool. That is why I'm in this forum right now, to make a new troubleshooting thread. Last time I had to do troubleshooting was 11.4.2022. I've been running UnRaid since 2009. I just love it, I can just let it run months and months without any manual intervention. Sometimes things just break.
-
Latest Plex release broke hw transcoding (tone mapping) and in my case also PlexKodiConnect's ability to direct play. Are you considering downgrading to latest working release like some other docker publishers have done?
-
Here you go. Thank you for the fast response and for the plugin itself, it has been a core plugin for many years and worked wonderfully. parityTuningIncrements="1" parityTuningFrequency="0" parityTuningResumeCustom="" parityTuningResumeHour="1" parityTuningResumeMinute="0" parityTuningPauseCustom="" parityTuningPauseHour="5" parityTuningPauseMinute="30" parityTuningUnscheduled="1" parityTuningRecon="1" parityTuningClear="1" parityTuningNotify="0" parityTuningHeat="1" parityTuningDebug="no" parityTuningAutomatic="0" parityTuningRestart="0" parityTuningHeatHigh="3" parityTuningHeatLow="8" parityTuningHeatNotify="1" parityTuningHeatShutdown="0" parityTuningLogging="0" parityTuningScheduled="1" parityTuningManual="0" parityTuningResumeDay="0" parityTuningPauseDay="0" parityTuningMover="1" parityTuningCABackup="1" parityTuningLogTarget="0"
-
This morning I noticed that the parity check was running although it has been configured to run in increments and between 1:00:00 and 5:30:00 AM. I went through syslog and realised that parity check was resumed when the mover finished. Mover is configured at 6:00:00 (after the parity check has ended) so parity check should definitely not be resumed when it finishes. I haven't noticed this behavior before (ie. last month's scheduled check) but cannot be certain. Below is the syslog excerpt containing relevant entries: --- Parity check scheduled to run between 1:00:00 and 5:30:00 -> OK Apr 4 01:00:02 TMS-740 Parity Check Tuning: Resumed: Scheduled Correcting Parity-Check Apr 4 01:00:02 TMS-740 Parity Check Tuning: Resumed: Scheduled Correcting Parity-Check (28.1% completed) Apr 4 01:00:07 TMS-740 kernel: mdcmd (40): check resume Apr 4 01:00:07 TMS-740 kernel: Apr 4 01:00:07 TMS-740 kernel: md: recovery thread: check P Q ... Apr 4 05:30:01 TMS-740 Parity Check Tuning: Paused: Scheduled Correcting Parity-Check Apr 4 05:30:06 TMS-740 kernel: mdcmd (41): nocheck pause Apr 4 05:30:06 TMS-740 kernel: Apr 4 05:30:06 TMS-740 kernel: md: recovery thread: exit status: -4 Apr 4 05:30:12 TMS-740 Parity Check Tuning: Paused: Scheduled Correcting Parity-Check (40.7% completed) --- Mover scheduled to run on 6:00:00 -> OK Apr 4 06:00:01 TMS-740 root: mover: started --- Mover took ~14mins this time -> OK Apr 4 06:14:25 TMS-740 root: mover: finished --- Parity check resuming -> NOK Apr 4 06:18:43 TMS-740 Parity Check Tuning: Resumed: Mover no longer running Apr 4 06:18:48 TMS-740 kernel: mdcmd (42): check resume Apr 4 06:18:48 TMS-740 kernel: Apr 4 06:18:48 TMS-740 kernel: md: recovery thread: check P Q ... Apr 4 06:18:48 TMS-740 Parity Check Tuning: Resumed: Mover no longer running: Scheduled Correcting Parity-Check (40.7% completed) --- Manually pausing parity check after noticing that the parity check was still running Apr 4 09:56:34 TMS-740 kernel: mdcmd (43): nocheck Pause Apr 4 09:56:35 TMS-740 kernel: md: recovery thread: exit status: -4 Apr 4 09:58:23 TMS-740 ool www[3302]: /usr/local/emhttp/plugins/parity.check.tuning/parity.check.tuning.php 'updatecron' Apr 4 09:58:23 TMS-740 Parity Check Tuning: Configuration: Array#012(#012 [parityTuningScheduled] => 1#012 [parityTuningManual] => 0#012 [parityTuningAutomatic] => 0#012 [parityTuningFrequency] => 0#012 [parityTuningResumeCustom] => #012 [parityTuningResumeDay] => 0#012 [parityTuningResumeHour] => 1#012 [parityTuningResumeMinute] => 0#012 [parityTuningPauseCustom] => #012 [parityTuningPauseDay] => 0#012 [parityTuningPauseHour] => 5#012 [parityTuningPauseMinute] => 30#012 [parityTuningNotify] => 0#012 [parityTuningRecon] => 1#012 [parityTuningClear] => 1#012 [parityTuningRestart] => 0#012 [parityTuningMover] => 1#012 [parityTuningCABackup] => 1#012 [parityTuningHeat] => 1#012 [parityTuningHeatHigh] => 3#012 [parityTuningHeatLow] => 8#012 [parityTuningHeatNotify] => 1#012 [parityTuningHeatShutdown] => 0#012 [parityTuningHeatCritical] => 2#012 [parityTuningHeatTooLong] => 30#012 [parityTuningLogging] => 0#012 [parityTuningLogTarget] => 0#012 [parityTuningMonitorDefault] => 17#012 [parityTuningMonitorHeat] => 7#012 [parityTuningMonitorBusy] => 6#012 [parityTu
-
I was more thinking to use the Github API to determine which release and when to grab. So we would not be pulling the release with the latest tag but the newest release which is newer than the current but older than the defined delay period. I have no idea how the current mechanism is implemented but this would most likely be much more complex. GitHub API provides the needed "published_at" attribute for releases: https://api.github.com/repos/binhex/arch-qbittorrentvpn/releases Edit: But all this might be in vain. The broken qBittorent 4.4.2 release is still up and marked as the latest in Binhex's repo. I guess this might work if you made an assumption that completely broken releases get a fix say within two weeks time. You could then make a safe delay of 4 weeks which should give you a buffer of additional two weeks for broken releases to receive a fix.
-
Just got hit by this during weekly docker autoupdate. Filled my cache drive by moving all the incomplete downloads to default config/downloads folder. This crashed all the dockers. Simply reverting to 4.4.1 was not enough. The 4.4.2 version partly reset and partly modified the qBittorrent config file so it was not anymore compatible with 4.4.1. I had to save the config within 4.4.1 and then go through all the settings to see which ones had been modified. Luckily I had screenshots of the original config. Now I also have a copy of the config file too... In my case the qBittorrent was in the middle of moving the incomplete torrents to config folder. I had enough space so I allowed it to finish before changing the incomplete (and save) folders back to my download drive. 4.4.2 is in my mind completely broken for anyone not using the default save paths. Also the configuration resets/modifications were weird and should be checked if using 4.4.2. Link to qBittorrent issue: https://github.com/qbittorrent/qBittorrent/issues/16749
-
The logic should/could be to look for the latest version which is older than the delay period and install it. This is heavily depending on bad versions being removed from the repositories once major problems have been discovered (I do not know if this is the case). If they only release a newer fix version without removing the bad release then there is no solution. I just got bit by latest qBittorent version defaulting to save the downloads into config folder, filling my cache drive and bringing all dockers down. Thankfully it seems like nothing was corrupted and I didn't have to restore anything from backups. I like the autoupdating plugins/dockers but really would like to have a delay on dockers too. I do not constantly tinker with my server so manual updates resulted in very long update intervals with multitude of problems when making the jump.
-
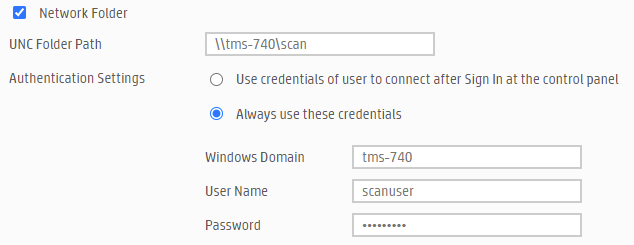
I'm trying to setup the scan to folder feature on my new HP MFP M479fdn. I had no issues with my previous Canon MFP to scan to an Unraid share. I'm using the same public share called scan. I have tried with the root user and I have also created a new user "scanuser" and tried with that. I have tried "TMS-740", "tms-740", "WORKGROUP", "workgroup" and "localdomain" as the "Windows Domain". Both the web based configuration tool and the printer itself fail to make the connection. I suspect it is the "Windows Domain" part which is incorrect. What should it be in the case of Unraid? As a workaround I'm using my Windows computer's share without issues (domain in this case is the my computer's name) but we have multiple users in the family and Unraid would be the most convenient scan target since it is already available to all members. Any help is well appreciated!
-
Just tried this again and the problem still persists. Did some more digging and found this kernel bug report from 2019: "Bug 204807 - Hardware monitoring sensor nct6798d doesn't work unless acpi_enforce_resources=lax is enabled" https://bugzilla.kernel.org/show_bug.cgi?id=204807 This fully explains why it stopped working and what is the workaround. Though I will not be using the workaround because it is not considered safe and I can live with the fixed fan speed. There is a bug fix in kernel version 5.2.11 so I will wait for it to come through Unraid.
-
Not yet. Unfortunately I don't have too much time to tinker with the server so I'm just running it with intro detection disabled. Did you follow the link to the original Windows based scripts? I would assume you should be able to use them almost as is and they might be easier than the Linux alternatives. There have been several cases in past 10+ years with Plex suddenly acting up related to resource utilisation. HDR transcoding tone mapping and chapter thumbnail generation come to mind. But this (Unraid + Plex + NVidia Shields) is just like a dream compared to the days of HTPCs.
-
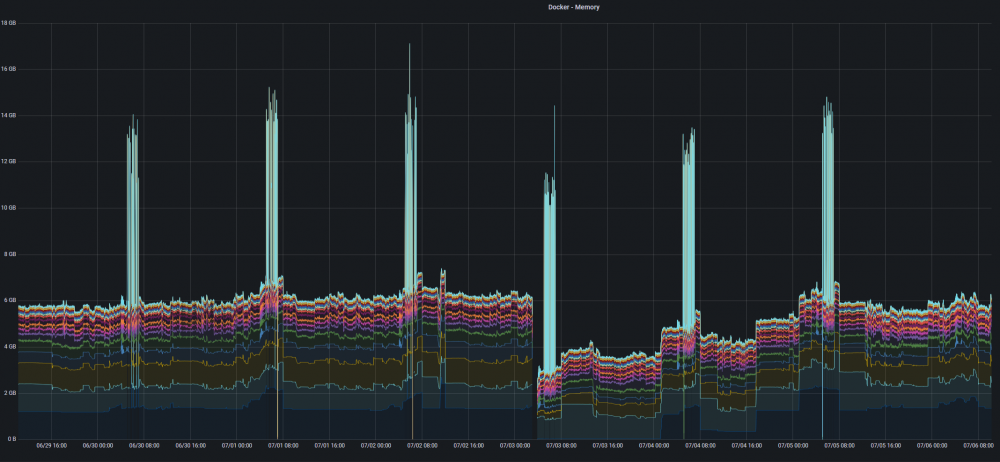
Plex Intro Detection processing causing very high memory usage and OOM This post is more a headsup for others who might be running into similar issues. The actual problem is inside Plex (Intro Detection processing) and should be fixed there. About a week ago my server started having memory related issues. Plex was being killed by the OOM reaper due to excessive memory usage. I haven't set any memory limits for Plex so the OOM was protecting the whole server from running out of memory. I have 32GB of mem and normal utilisation is ~60%. When analysing the issue through Grafana statistics (TIG stack) I realised the issue had started already on 10.8.2020 and had been slowly creeping up until a week ago it passed the final limit causing the OOM. It also became evident that the problem occurred daily at the time when Plex scheduled maintenance tasks were running. I quite quickly found this thread on Plex forums: https://forums.plex.tv/t/server-maintenance-leads-to-excessive-resource-utilization/611012/18 The root cause in that case was the intro detection processing stumbling on some badly encoded media. So I yesterday temporarily disabled intro detection (and only that) and the problem went completely away as can be seen from the docker memory utilisation graph below (last day missing the mem spikes). And yes, I have a weekly backup/update routine running which also restarts all dockers hence the drop on 3.7. So most likely I have added some bad media on 10.8.2020 since the intro detection feature was released way before that. The referenced thread also included ffmpeg scripts for detecting bad media. I think I will have to go that route too. Unfortunately the Plex logs do not tell anything about problematic files. I will in case up the server memory 32 -> 64GB just to see if it makes a difference. But that is just a band aid. Plex should definitely not be using >15GB of memory.
-
I'm looking forward for the update too. In the mean time I did some testing with the "raw" Speedtest-CLI and I'm also seeing some weird results. I'm on a 4G connection so the speed varies a lot but still I'm getting pretty consistent results (50Mbps DL / 25 Mbps UL) from a native web speedtest and Speedtest-CLI ran from a Windows VM inside Unraid. But Speedtest-CLI ran straight from Unraid shell gives 4Mbps DL / 3Mbps UL. I have manually set both to use the same closest server so there really should be no difference. The latter results are also very close to Speedtest Tracker results. It is almost a year ago when I last was trying to use Speedtest and had a very similar situation; none of the available solutions ran from Unraid / Docker gave correct results. It seems like the Linux Speedtest-CLI is broken at least when ran on Unraid.
-
HDDTemp causing "attempting task abort!" message blocks in syslog? I yesterday noticed error messages in syslog which seemed very similar to this issue. I posted my detailed findings there. May 24 17:01:12 TMS-740 kernel: sd 1:0:12:0: attempting task abort! scmd(00000000c75493da) May 24 17:01:12 TMS-740 kernel: sd 1:0:12:0: [sdn] tag#518 CDB: opcode=0x85 85 06 20 00 d8 00 00 00 00 00 4f 00 c2 00 b0 00 May 24 17:01:12 TMS-740 kernel: scsi target1:0:12: handle(0x001d), sas_address(0x443322110e000000), phy(14) May 24 17:01:12 TMS-740 kernel: scsi target1:0:12: enclosure logical id(0x500062b200794840), slot(13) May 24 17:01:12 TMS-740 kernel: sd 1:0:12:0: task abort: SUCCESS scmd(00000000c75493da) The only change I had made in several months time was the addition of HDDTemp docker. I tried stopping the docker and the error messages went away. Just a heads up cross-post if someone else runs into this. I simply disabled the HDDTemp for now.
-
I yesterday noticed that I had similar error messages in my syslog adjacent to drive spindowns. Looking at the syslog as whole, the related drive varied. The issue was not consistent; not all spindowns resulted in error messages. Also the same drive sometimes caused error messages and sometimes not. Since I was quite certain I did not have these earlier I looked on the server changelog and the only change I had made recently was the addition of HDDTemp docker to store drive temps to Telegraf/InfluxDB/Grafana. I stopped the docker and tested spinning down drives manually, no errors anymore. I also waited through the night and no errors either. It appears that at least one potential source for this is HDDTemp. One could speculate that similar apps/dockers performing smart requests could cause issues. I haven't performed any additional tests like manually running smart on recently spundown disk but I have "never" seen this with stock unRAID. Since HDDTemp for me is already not ideal due to non-persistent device naming, I will simply stop using it. Syslog snippet: device sdn -> Disk 12 May 24 16:05:31 TMS-740 kernel: mdcmd (127): spindown 11 May 24 16:08:54 TMS-740 kernel: mdcmd (128): spindown 10 May 24 16:43:04 TMS-740 kernel: mdcmd (129): spindown 13 May 24 17:00:50 TMS-740 kernel: mdcmd (130): spindown 12 May 24 17:01:12 TMS-740 kernel: sd 1:0:12:0: attempting task abort! scmd(00000000c75493da) May 24 17:01:12 TMS-740 kernel: sd 1:0:12:0: [sdn] tag#518 CDB: opcode=0x85 85 06 20 00 d8 00 00 00 00 00 4f 00 c2 00 b0 00 May 24 17:01:12 TMS-740 kernel: scsi target1:0:12: handle(0x001d), sas_address(0x443322110e000000), phy(14) May 24 17:01:12 TMS-740 kernel: scsi target1:0:12: enclosure logical id(0x500062b200794840), slot(13) May 24 17:01:12 TMS-740 kernel: sd 1:0:12:0: task abort: SUCCESS scmd(00000000c75493da) May 24 17:02:42 TMS-740 kernel: sd 1:0:12:0: attempting task abort! scmd(00000000acc00b30) May 24 17:02:42 TMS-740 kernel: sd 1:0:12:0: [sdn] tag#519 CDB: opcode=0x85 85 06 20 00 d8 00 00 00 00 00 4f 00 c2 00 b0 00 May 24 17:02:42 TMS-740 kernel: scsi target1:0:12: handle(0x001d), sas_address(0x443322110e000000), phy(14) May 24 17:02:42 TMS-740 kernel: scsi target1:0:12: enclosure logical id(0x500062b200794840), slot(13) May 24 17:02:42 TMS-740 kernel: sd 1:0:12:0: task abort: SUCCESS scmd(00000000acc00b30) May 24 17:04:12 TMS-740 kernel: sd 1:0:12:0: attempting task abort! scmd(00000000b88d3273) May 24 17:04:12 TMS-740 kernel: sd 1:0:12:0: [sdn] tag#521 CDB: opcode=0x85 85 06 20 00 d8 00 00 00 00 00 4f 00 c2 00 b0 00 May 24 17:04:12 TMS-740 kernel: scsi target1:0:12: handle(0x001d), sas_address(0x443322110e000000), phy(14) May 24 17:04:12 TMS-740 kernel: scsi target1:0:12: enclosure logical id(0x500062b200794840), slot(13) May 24 17:04:12 TMS-740 kernel: sd 1:0:12:0: task abort: SUCCESS scmd(00000000b88d3273) May 24 17:05:42 TMS-740 kernel: sd 1:0:12:0: attempting task abort! scmd(00000000c75493da) May 24 17:05:42 TMS-740 kernel: sd 1:0:12:0: [sdn] tag#518 CDB: opcode=0x85 85 06 20 00 d8 00 00 00 00 00 4f 00 c2 00 b0 00 May 24 17:05:42 TMS-740 kernel: scsi target1:0:12: handle(0x001d), sas_address(0x443322110e000000), phy(14) May 24 17:05:42 TMS-740 kernel: scsi target1:0:12: enclosure logical id(0x500062b200794840), slot(13) May 24 17:05:42 TMS-740 kernel: sd 1:0:12:0: task abort: SUCCESS scmd(00000000c75493da) May 24 17:07:12 TMS-740 kernel: sd 1:0:12:0: attempting task abort! scmd(00000000c92f385e) May 24 17:07:12 TMS-740 kernel: sd 1:0:12:0: [sdn] tag#523 CDB: opcode=0x85 85 06 20 00 d8 00 00 00 00 00 4f 00 c2 00 b0 00 May 24 17:07:12 TMS-740 kernel: scsi target1:0:12: handle(0x001d), sas_address(0x443322110e000000), phy(14) May 24 17:07:12 TMS-740 kernel: scsi target1:0:12: enclosure logical id(0x500062b200794840), slot(13) May 24 17:07:12 TMS-740 kernel: sd 1:0:12:0: task abort: SUCCESS scmd(00000000c92f385e) May 24 17:08:42 TMS-740 kernel: sd 1:0:12:0: attempting task abort! scmd(00000000c75493da) May 24 17:08:42 TMS-740 kernel: sd 1:0:12:0: [sdn] tag#518 CDB: opcode=0x85 85 06 20 00 d8 00 00 00 00 00 4f 00 c2 00 b0 00 May 24 17:08:42 TMS-740 kernel: scsi target1:0:12: handle(0x001d), sas_address(0x443322110e000000), phy(14) May 24 17:08:42 TMS-740 kernel: scsi target1:0:12: enclosure logical id(0x500062b200794840), slot(13) May 24 17:08:42 TMS-740 kernel: sd 1:0:12:0: task abort: SUCCESS scmd(00000000c75493da) May 24 17:10:12 TMS-740 kernel: sd 1:0:12:0: attempting task abort! scmd(00000000acc00b30) May 24 17:10:12 TMS-740 kernel: sd 1:0:12:0: [sdn] tag#519 CDB: opcode=0x85 85 06 20 00 d8 00 00 00 00 00 4f 00 c2 00 b0 00 May 24 17:10:12 TMS-740 kernel: scsi target1:0:12: handle(0x001d), sas_address(0x443322110e000000), phy(14) May 24 17:10:12 TMS-740 kernel: scsi target1:0:12: enclosure logical id(0x500062b200794840), slot(13) May 24 17:10:12 TMS-740 kernel: sd 1:0:12:0: task abort: SUCCESS scmd(00000000acc00b30) May 24 17:11:42 TMS-740 kernel: sd 1:0:12:0: attempting task abort! scmd(00000000acc00b30) May 24 17:11:42 TMS-740 kernel: sd 1:0:12:0: [sdn] tag#519 CDB: opcode=0x85 85 06 20 00 d8 00 00 00 00 00 4f 00 c2 00 b0 00 May 24 17:11:42 TMS-740 kernel: scsi target1:0:12: handle(0x001d), sas_address(0x443322110e000000), phy(14) May 24 17:11:42 TMS-740 kernel: scsi target1:0:12: enclosure logical id(0x500062b200794840), slot(13) May 24 17:11:42 TMS-740 kernel: sd 1:0:12:0: task abort: SUCCESS scmd(00000000acc00b30) May 24 17:13:12 TMS-740 kernel: sd 1:0:12:0: attempting task abort! scmd(00000000c92f385e) May 24 17:13:12 TMS-740 kernel: sd 1:0:12:0: [sdn] tag#523 CDB: opcode=0x85 85 06 20 00 d8 00 00 00 00 00 4f 00 c2 00 b0 00 May 24 17:13:12 TMS-740 kernel: scsi target1:0:12: handle(0x001d), sas_address(0x443322110e000000), phy(14) May 24 17:13:12 TMS-740 kernel: scsi target1:0:12: enclosure logical id(0x500062b200794840), slot(13) May 24 17:13:12 TMS-740 kernel: sd 1:0:12:0: task abort: SUCCESS scmd(00000000c92f385e) May 24 17:14:42 TMS-740 kernel: sd 1:0:12:0: attempting task abort! scmd(00000000c75493da) May 24 17:14:42 TMS-740 kernel: sd 1:0:12:0: [sdn] tag#518 CDB: opcode=0x85 85 06 20 00 d8 00 00 00 00 00 4f 00 c2 00 b0 00 May 24 17:14:42 TMS-740 kernel: scsi target1:0:12: handle(0x001d), sas_address(0x443322110e000000), phy(14) May 24 17:14:42 TMS-740 kernel: scsi target1:0:12: enclosure logical id(0x500062b200794840), slot(13) May 24 17:14:42 TMS-740 kernel: sd 1:0:12:0: task abort: SUCCESS scmd(00000000c75493da) May 24 17:15:02 TMS-740 kernel: sd 1:0:12:0: Power-on or device reset occurred May 24 17:15:02 TMS-740 rc.diskinfo[10781]: SIGHUP received, forcing refresh of disks info. May 24 17:16:12 TMS-740 kernel: sd 1:0:12:0: attempting task abort! scmd(00000000acc00b30) May 24 17:16:12 TMS-740 kernel: sd 1:0:12:0: [sdn] tag#519 CDB: opcode=0x85 85 06 20 00 d8 00 00 00 00 00 4f 00 c2 00 b0 00 May 24 17:16:12 TMS-740 kernel: scsi target1:0:12: handle(0x001d), sas_address(0x443322110e000000), phy(14) May 24 17:16:12 TMS-740 kernel: scsi target1:0:12: enclosure logical id(0x500062b200794840), slot(13) May 24 17:16:12 TMS-740 kernel: sd 1:0:12:0: task abort: SUCCESS scmd(00000000acc00b30) May 24 17:16:59 TMS-740 kernel: sd 1:0:12:0: Power-on or device reset occurred May 24 17:16:59 TMS-740 rc.diskinfo[10781]: SIGHUP received, forcing refresh of disks info.


