


Mizerka
Members
-
Joined
-
Last visited
Everything posted by Mizerka
-
cool, and actually spoke too soon, server practically hangs and logs are spamming; 2022-09-21 23:24:54,316 DEBG 'plexmediaserver' stdout output: busy DB. Sqlite3: Sleeping for 200ms to retry busy DB. Sqlite3: Sleeping for 200ms to retry busy DB. Sqlite3: Sleeping for 200ms to retry busy DB. Sqlite3: Sleeping for 200ms to retry busy DB. Sqlite3: Sleeping for 200ms to retry busy DB. Sqlite3: Sleeping for 200ms to retry busy DB. Sqlite3: Sleeping for 200ms to retry busy DB. enabling verbose on server itself gives off these errors; Held transaction for too long (/data/jenkins/server/3534229725/Library/MetadataItemClustering.cpp:114): 15.620000 seconds CLEAR FILTERS AND JUMP TO CONTEXT and it's spamming those every 10s or so. gonna disable scheduled jobs and restart for now and see if that does anything, maybe do the cleanup jobs from server itself edit; well I let it run for a bit but seems to have hung again, this time with no logs, it's eating up about 0.5cpu and 120mb ram so it's doing something but... not sure, might just leave it overnight. nevermind finished mid sentence, so far... looks okay, will enable scans again and clean up bundles, just doing library scan of a massive one I have, so far it looks okay.
-
had same issue on :latest as well, killed the container, forced update again and it started up fine, it was throwing this before. Critical: libusb_init failed
-
Hey, thanks for your work; for a about a week now (not bothered to look at it closely), delugevpn docker in unraid would fail to start, stating dns resolution errors, it'd loop through all external ip identifiers and dns resolutions until it times out eventually and starts webgui without external connection, despite it connecting to vpn (tested) and not stating any errors during it, looking at debug logs, nothing useful again other than dns resolutions failing, I tried swapping to CF, google and internal pihole with same results. It can ping external just fine from console This started happening since 6.9 rc2 update any ideas? let me know if you need logs/more info. ignore me, removed .ovpn and .conf files and it just started to work.
-
makes sense, can confirm, --restart unless-stopped wasn't there, I've added now and will see how it behaves. thanks
-
Hey, thanks for your work; lately jacketvpn has been turning itself off quite often with error 2020-08-08 17:04:58.977161 [ERROR] Network is down, exiting this Docker Is this just down to tun closing so jacket is forcing to shutdown?
-
hey, quick one, small typo in xfs_repair help of -o subopts description -f also missing full stop.
-
Okay, ye so that worked, didn't know actual world name during generation mattered. got 3 instances running side by side now without issues. If you get some time it'd be nice to sort that downloading delay though, world is 2mb, but takes it good 10mins before it proceeds to extract it
-
Hmm, so they match otherwise as you said it'd complain about it missing, but still fails to starts, fwiw I'm generating local worlds on windows client. If I just copy it over it goes back to the same error as before, when run straight parameters from container instead of using -config x.txt I get that weird n world, d <number> delete world in log, left it for 30mins and nothing happened.
-
World generation still isn't working in any way, it only downloads it once if path is missing. World I tried with was different name originally (just renamed file to match serverconfig.txt), I'll give that a try.
-
Thanks, however still not having it for me Now it it's stuck on downloading worlds, looks like it pulled a complete .zip but then does nothing with it by the looks, extracting it manually and restarting container, just goes back to the same error as before. new container from template; ---Checking if UID: 99 matches user--- ---Checking if GID: 100 matches user--- ---Setting umask to 000--- ---Checking for optional scripts--- ---No optional script found, continuing--- ---Starting...--- ---Version Check--- ---Terraria not found, downloading!--- ---Successfully downloaded Terraria--- ---Prepare Server--- ---No serverconfig.txt found, downloading...--- ---No World found, downloading--- restarted; Session terminated, killing shell...�'---Checking if UID: 99 matches user--- usermod: no changes ---Checking if GID: 100 matches user--- usermod: no changes ---Setting umask to 000--- ---Checking for optional scripts--- ---No optional script found, continuing--- ---Starting...--- ---Version Check--- ---Terraria Version up-to-date--- ---Prepare Server--- ---Server ready--- ---Checking for old logs--- ---Start Server--- Error Logging Enabled. �[?1h�=�[6n�[H�[JTerraria Server v1.4.0.5 �[H�[J Server crash: 6/14/2020 6:09:07 PM System.NullReferenceException: Object reference not set to an instance of an object at Terraria.Main.WriteFancyWorldLoadErrorToConsole () [0x00005] in <0ebea07e9a804a06a9f1dd17904b9c9c>:0 at Terraria.Main.DedServ () [0x00b21] in <0ebea07e9a804a06a9f1dd17904b9c9c>:0 at Terraria.Program.LaunchGame (System.String[] args, System.Boolean monoArgs) [0x000ac] in <0ebea07e9a804a06a9f1dd17904b9c9c>:0 Please send crashlog.txt to [email protected] Terminated edit; okay, so I just though it might be doing some magic is background and not outputting into logs, so I left it for like 15minutes and it generated 1.4.0.5 world as expected, hmmm I'll try a few more and see if it likes it. Also, master mode? can I just set difficulty 2? edit2; Hmm... so it didn't work again, not sure why it worked before I guess. edit3; Okay, so looks like it downloads ideantical world, named world.wld server config specifies a world1.wld, renaming makes it work. but this doesn't generate new worlds.... it just uses whatever one it downloads. Commenting out world load so it creates one doesn't work either, get's stuck with below; ---Prepare Server--- ---Server ready--- ---Checking for old logs--- ---Start Server--- Error Logging Enabled. [?1h=[6nTerraria Server v1.4.0.5 1 world n New World d <number> Delete World Copying a locally created world doesn't work either and spams the same errors as before object reference not set
-
To confirm, if I take your template as is, it works fine, it generates a 1.3.5.3 world, and I can just upgrade server to 1.4.0.5 but I'd like to generate a new world in 1.4 for a few reasons (and expert + medium/large but that's something else, on side topic, I assume master and journey worlds can also be created by incrementing values further?). For now I'm just running it locally, also tried creating the world locally and moving it over, which didn't work either, with same error. and yeah no rush, I appreciate your work on this.
-
This is vanilla, I tried few more versions since, but could only get it to generate a 1.3.5.3 world. Tried few more modes, small medium large, all giving the same error, I'm not great at reading syntax but seems like it's just expecting a integer early on probably from some variable, or from initial error where some var is just not set at all.
-
Hey, trying to run terraria server but having some issues, docker installs and created fine, but it creates a 1.3.5.3 world, I tried changing version to 1.4.0.5 or blank which updates fine to latest, but fails to create a world and crashes with this error. Tried creating multiple dockers but could only get it to create a world when the default version value is used. ---Starting...--- /opt/scripts/start-server.sh: line 5: [: : integer expression expected ------------------------------------------------------------------------------------ ---------------------------------W A R N I N G-------------------------------------- ---The variable Prefered Version doesn't work anymore for Version 1.4.0.2 and up---- ---The conatainer will always pull the latest version if set to 1.4.0.2 or higher--- ------------------------------------------------------------------------------------ ---Version Check--- ---Terraria Version up-to-date--- ---Prepare Server--- ---Server ready--- ---Checking for old logs--- ---Start Server--- Error Logging Enabled. [?1h=[6n[H[JTerraria Server v1.4.0.5 [H[J Server crash: 6/7/2020 7:43:38 PM System.NullReferenceException: Object reference not set to an instance of an object at Terraria.Main.WriteFancyWorldLoadErrorToConsole () [0x00005] in <0ebea07e9a804a06a9f1dd17904b9c9c>:0 at Terraria.Main.DedServ () [0x00b21] in <0ebea07e9a804a06a9f1dd17904b9c9c>:0 at Terraria.Program.LaunchGame (System.String[] args, System.Boolean monoArgs) [0x000ac] in <0ebea07e9a804a06a9f1dd17904b9c9c>:0 Please send crashlog.txt to [email protected] Terminated [?1l>[39;49m'---Checking if UID: 99 matches user--- usermod: no changes ---Checking if GID: 100 matches user--- usermod: no changes ---Setting umask to 000--- ---Checking for optional scripts--- ---No optional script found, continuing--- ---Starting...--- /opt/scripts/start-server.sh: line 5: [: : integer expression expected Session terminated, killin
-
tested and works as expected for me, thanks.

-
finally figured it out, god it's so stupid. at boot, after fix (40%), 30% test, 55% test, 100%. at 85% because I don't like fan1 going out of spec, might move them to fana and b for direct control. anyway, the fix. create a dedicated user for unraid tool to use, same for grafana. I've been using just the default admin account for everything, until I opened new tab by accident and saw that message "your session timed out, log in again". also nothing in bios for fan/thermal/power control so probably stuck with fans1-6 and fan a-b
-
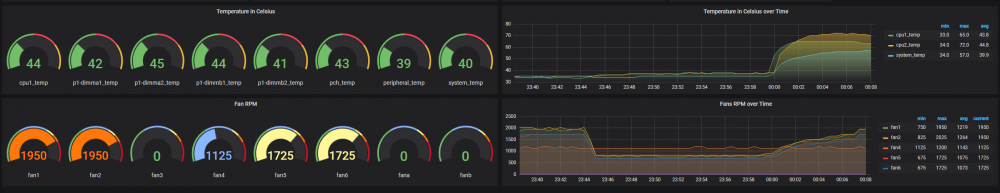
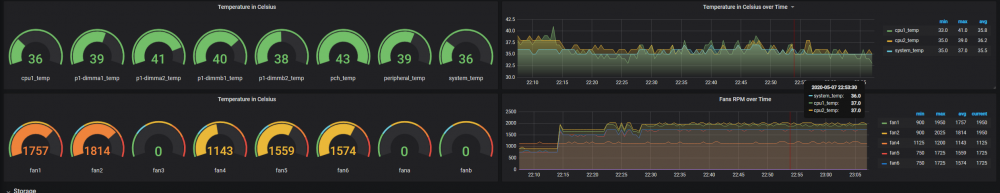
Okay, enough edits, so I'm still playing with this, I went back into ipmi webfront and just switched fan mode from full speed to standard, and it dropped fans to their comfortable idles of around 700rpm, okay... played with min and max more but no matter what I changed it wouldn't do anything (maybe the issue?) so I grabbed prime95 docker and threw 60% load on it, to see fans ramping up, slowly, very slowly, it's been like 5mins and they're still climbing, despite logs stating they've been set at 95-97% instantly. 2020-05-07 23:52:07 Fan:Temp, FAN1234(27%):CPU1 Temp(37°C), FANA(25%):System Temp(35°C) 2020-05-07 23:52:28 Fan:Temp, FAN1234(35%):CPU1 Temp(42°C), FANA(25%):System Temp(35°C) 2020-05-07 23:52:38 Fan:Temp, FAN1234(27%):CPU1 Temp(37°C), FANA(25%):System Temp(35°C) 2020-05-07 23:52:48 Fan:Temp, FAN1234(29%):CPU1 Temp(38°C), FANA(25%):System Temp(35°C) 2020-05-07 23:53:50 Fan:Temp, FAN1234(27%):CPU1 Temp(37°C), FANA(25%):System Temp(35°C) 2020-05-07 23:54:21 Fan:Temp, FAN1234(29%):CPU1 Temp(38°C), FANA(25%):System Temp(35°C) 2020-05-07 23:54:41 Fan:Temp, FAN1234(27%):CPU1 Temp(37°C), FANA(25%):System Temp(35°C) 2020-05-07 23:55:01 Fan:Temp, FAN1234(29%):CPU1 Temp(38°C), FANA(25%):System Temp(35°C) 2020-05-07 23:55:11 Fan:Temp, FAN1234(27%):CPU1 Temp(37°C), FANA(25%):System Temp(35°C) 2020-05-07 23:55:31 fan control config file updated, reloading settings 2020-05-07 23:55:32 Fan:Temp, FAN1234( 6%):CPU1 Temp(37°C), FANA(25%):System Temp(35°C) 2020-05-07 23:55:42 Fan:Temp, FAN1234( 5%):CPU1 Temp(36°C), FANA(25%):System Temp(35°C) 2020-05-07 23:55:52 Fan:Temp, FAN1234( 6%):CPU1 Temp(37°C), FANA(25%):System Temp(35°C) 2020-05-07 23:57:24 fan control config file updated, reloading settings 2020-05-07 23:57:25 Fan:Temp, FAN1234(28%):CPU1 Temp(38°C), FANA(25%):System Temp(35°C) 2020-05-07 23:57:55 Fan:Temp, FAN1234(27%):CPU1 Temp(37°C), FANA(25%):System Temp(35°C) 2020-05-07 23:58:46 Fan:Temp, FAN1234(28%):CPU1 Temp(38°C), FANA(25%):System Temp(35°C) 2020-05-07 23:59:27 Fan:Temp, FAN1234(27%):CPU1 Temp(37°C), FANA(25%):System Temp(35°C) 2020-05-07 23:59:37 Fan:Temp, FAN1234(35%):CPU1 Temp(48°C), FANA(25%):System Temp(35°C) 2020-05-07 23:59:47 fan control config file updated, reloading settings 2020-05-07 23:59:48 Fan:Temp, FAN1234(91%):CPU1 Temp(51°C), FANA(27%):System Temp(36°C) 2020-05-07 23:59:58 Fan:Temp, FAN1234(92%):CPU1 Temp(53°C), FANA(30%):System Temp(38°C) 2020-05-08 00:00:08 Fan:Temp, FAN1234(93%):CPU1 Temp(55°C), FANA(34%):System Temp(40°C) 2020-05-08 00:00:18 Fan:Temp, FAN1234(93%):CPU1 Temp(56°C), FANA(39%):System Temp(43°C) 2020-05-08 00:00:28 Fan:Temp, FAN1234(94%):CPU1 Temp(58°C), FANA(42%):System Temp(45°C) 2020-05-08 00:00:39 Fan:Temp, FAN1234(95%):CPU1 Temp(60°C), FANA(44%):System Temp(46°C) 2020-05-08 00:00:49 Fan:Temp, FAN1234(96%):CPU1 Temp(61°C), FANA(45%):System Temp(47°C) 2020-05-08 00:00:59 Fan:Temp, FAN1234(96%):CPU1 Temp(62°C), FANA(47%):System Temp(48°C) 2020-05-08 00:01:09 Fan:Temp, FAN1234(97%):CPU1 Temp(63°C), FANA(47%):System Temp(48°C) So I'm really confused now because it's clearly working, but it doesn't seem to be done by unraid. also still not sure why the noctua NF-B9 redux 1600 PWM are reaching 2k rpm at 100%, they should only be allowed 1600 looking at spec sheets, only af-a9 would reach 2k with 1.6k pwm rating. strange... Anyway, time to check bios I guess, maybe it's forcing pwm from there somewhere. for reference using X9DRi-F
-
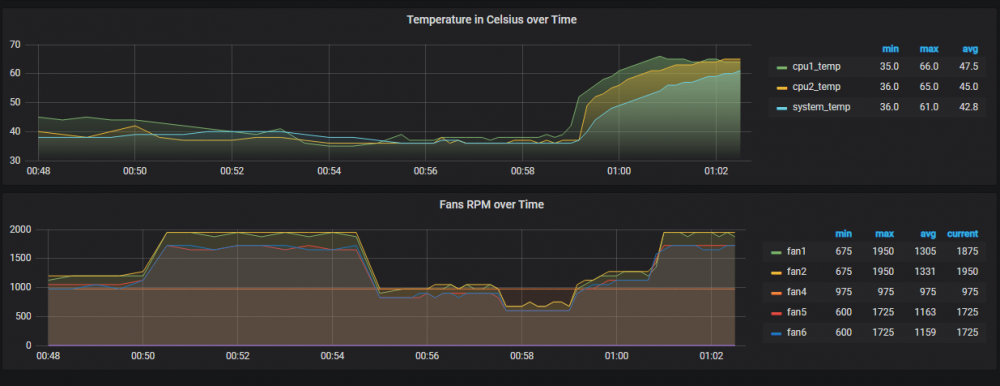
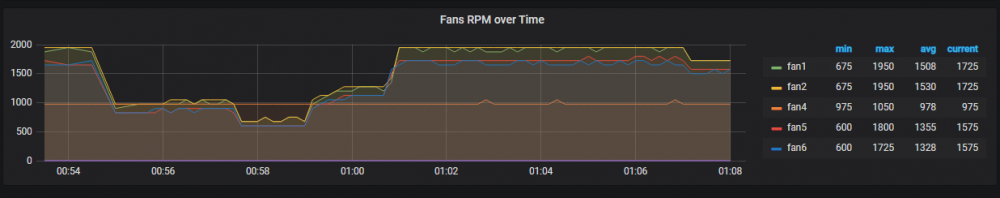
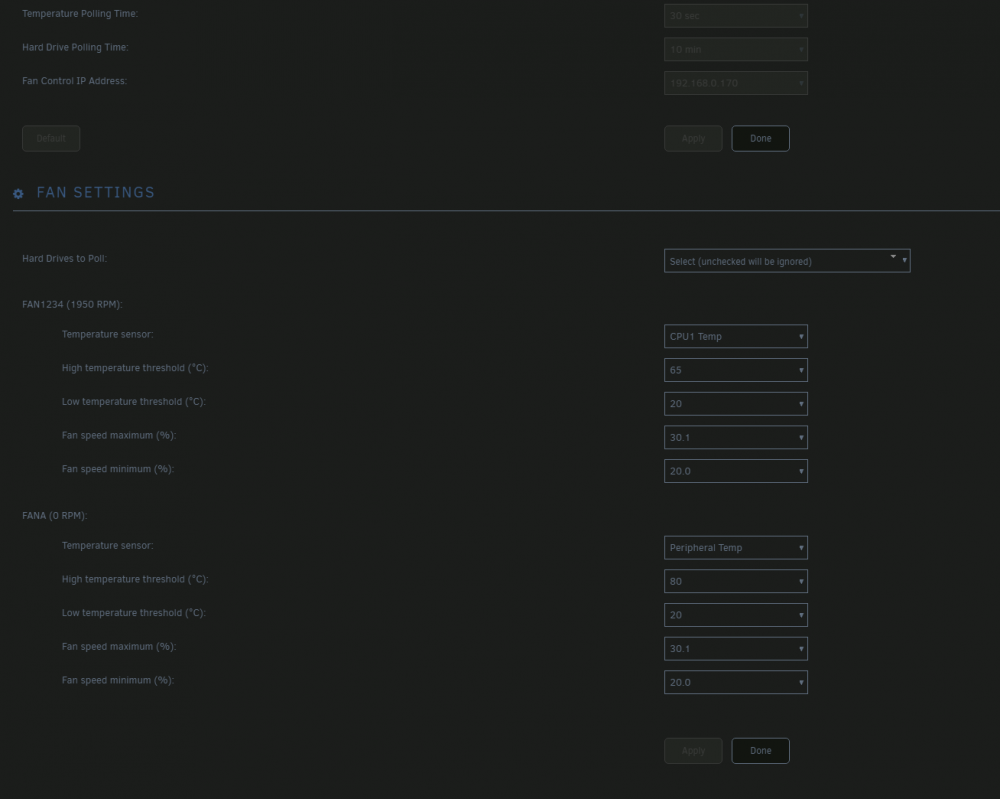
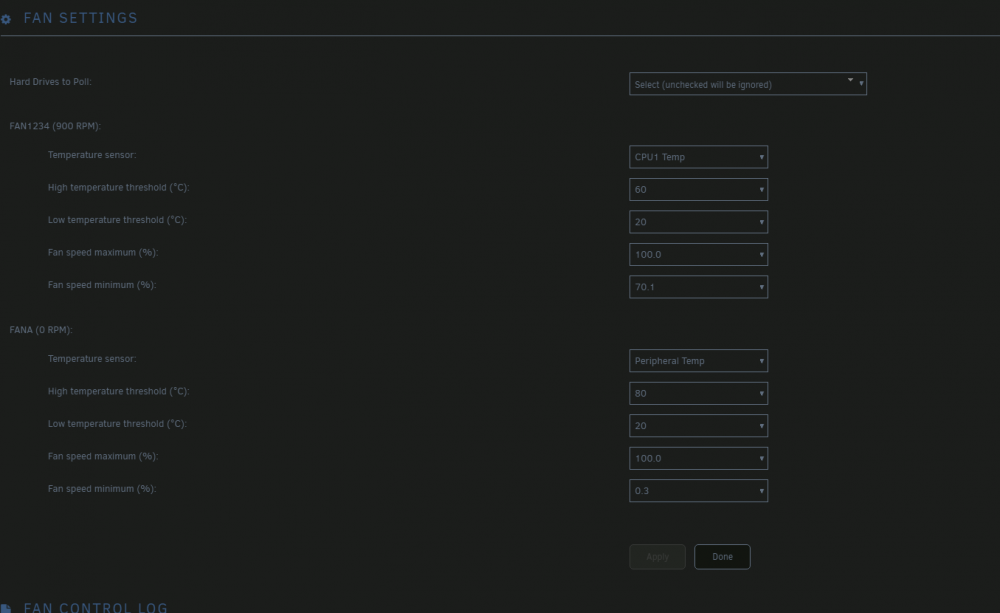
It allows you to edit the values already set in the bmc. Instead of commands, it's a print out of the config. You edit them and then the whole config is uploaded back to the bmc. cool, just noticed load on boot slider as well. still no luck at controlling the fans though, I must be doing something wrong, here's what I've set currently; Which I'm assuming will set fans 1 2 3 and 4 based on cpu1 sensor (30c ish atm) report/alert below 20c and above 65c, pwm (or I guess ipmi hex control for supermicro?) will force it at 20% and let it rise until 30.1% i.e. keep it between 20 and 30% of it's own rated pwm (I forget my pwm wave but pretty sure it should know it's 0.3 and 100% and not need raw rpm values). but they still just ramp up to 2k rpm and don't drop. edit; grafana in place for this now, you can see rise when fan control was enabled and never went down after few fluxuations; or am I looking at this wrong and I should be using upper criticals etc to restrict fan speeds? edit2; logs btw; 2020-05-07 22:46:15 Fan:Temp, FAN1234(66%):CPU1 Temp(37°C), FANA(66%):Peripheral Temp(39°C) 2020-05-07 22:47:16 Fan:Temp, FAN1234(68%):CPU1 Temp(40°C), FANA(66%):Peripheral Temp(39°C) 2020-05-07 22:47:46 Fan:Temp, FAN1234(66%):CPU1 Temp(38°C), FANA(66%):Peripheral Temp(39°C) 2020-05-07 22:49:16 Fan:Temp, FAN1234(65%):CPU1 Temp(35°C), FANA(66%):Peripheral Temp(39°C) 2020-05-07 22:53:18 Fan:Temp, FAN1234(66%):CPU1 Temp(37°C), FANA(66%):Peripheral Temp(39°C) 2020-05-07 22:53:48 Fan:Temp, FAN1234(65%):CPU1 Temp(35°C), FANA(66%):Peripheral Temp(39°C) 2020-05-07 22:55:18 Fan:Temp, FAN1234(65%):CPU1 Temp(36°C), FANA(66%):Peripheral Temp(39°C) 2020-05-07 22:55:49 Fan:Temp, FAN1234(65%):CPU1 Temp(35°C), FANA(66%):Peripheral Temp(39°C) 2020-05-07 22:56:19 fan control config file updated, reloading settings 2020-05-07 22:56:19 Fan:Temp, FAN1234(41%):CPU1 Temp(34°C), FANA(45%):Peripheral Temp(39°C) 2020-05-07 22:57:49 Fan:Temp, FAN1234(44%):CPU1 Temp(36°C), FANA(45%):Peripheral Temp(39°C) 2020-05-07 22:58:20 Fan:Temp, FAN1234(43%):CPU1 Temp(35°C), FANA(45%):Peripheral Temp(39°C) 2020-05-07 22:58:50 Fan:Temp, FAN1234(44%):CPU1 Temp(36°C), FANA(45%):Peripheral Temp(39°C) 2020-05-07 22:59:10 fan control config file updated, reloading settings 2020-05-07 22:59:10 Fan:Temp, FAN1234(20%):CPU1 Temp(35°C), FANA(20%):Peripheral Temp(39°C) 2020-05-07 23:02:11 fan control config file updated, reloading settings 2020-05-07 23:02:11 Fan:Temp, FAN1234(23%):CPU1 Temp(34°C), FANA(23%):Peripheral Temp(39°C) 2020-05-07 23:23:08 fan control config file updated, reloading settings 2020-05-07 23:23:08 Fan:Temp, FAN1234(30%):CPU1 Temp(34°C), FANA(23%):Peripheral Temp(38°C) 2020-05-07 23:24:39 fan control config file updated, reloading settings 2020-05-07 23:25:32 Stopping Fan Control 2020-05-07 23:25:32 Setting fans to auto 2020-05-07 23:27:27 Starting Fan Control 2020-05-07 23:27:27 Setting fans to full speed 2020-05-07 23:27:49 Fan:Temp, FAN1234(30%):(0°C), FANA(20%):(0°C) so looks like it's setting it correctly... at least tool believes so, but despite that, fans are still sitting at 1900-2000 (the fan5/6 are 1800rpm rated and are on 1700-1800) fun fact, you can set minimum above maximum, also logs with correct values 2020-05-07 23:33:05 Setting fans to auto 2020-05-07 23:34:26 Starting Fan Control 2020-05-07 23:34:26 Setting fans to full speed 2020-05-07 23:34:36 Fan:Temp, FAN1234(20%):CPU1 Temp(35°C), FANA(25%):System Temp(35°C) no changes to actual rpm edit3; 'Configure' button tests your fans and determines their location for fan control. All fans will initially be set to full speed. Each location will be tested at one third speed to determine which fan is present. This will take about 1 min. On completion fans will return to auto. You can start fan control sounds useful, but doesn't exist? anymore?
-
Okay, that makes sense, I'll play with values a bit, right now they're bouncing between 1400 and 2000k for 1600rpm rated isn't ideal, there could be some polling issue here. I'll have a look at the config editor as well, how would that interact with values already set manually would it overwrite it or only apply during fan control functions?
-
Thanks I'll have a look but can't remember seeing an option like that there. also playing around with fan control more, it just sets bmc to full speed instead of controlling it, hmmm, to be fixed another day
-
maybe I missed it then, it only allows for fan control, but not modifying treshhold that ipmi actually uses, in supermicro case if a fan falls below critical error it ramps it to 100% (like mentioned in op), so I had to get ipmitool and manually change it through console rather than addin I'm talking about fan thresholds that ipmi will use to report fan speed errors etc, pretty sure fan control panel only for speed modulation based on sensor reading. Also in my case I only see this; unlike the nice fan by fan, I get fan1234 which are 4 pwm headers, which is weird but whatever I can deal with that. And yes, this works fine, i.e. if I pop above on, I can see my fan1 and 2 cpu fans ramp up to 1700rpm from 900 it idles at normally, but if I were to do something like 0.3 to 100, they'd drop below 400 rpm triggering alerts every 10seconds. here's my tresh values, so unless I force pwm within values fan either won't like or bmc reports according to it's logic (good or not), it's not ideal, for what is just a simple tresh command to bmc

-
hmmm so ended up resetting bmc and changing ip addressing and looks like it picked it up afterwards, ipmisensors reported connection timeout, so probably was networking/arp issue. anyway, up and running again. btw, being able to modify fan thresh from tool would be nice my x9 board really didn't like my noctua's getting down to 300rpm and assumed my case fans are fine up to 18k rpm. just supermicro things. Also am I right in thinking fan control only control fans 1-4 and fan A? or does it just specify naming and actually does all numbered and then all lettered?
-
Thanks I'll give that a try, I've now removed any other addons or packages that might interfere with ipmi including the nerdpack pkg that I've used ipmitool with. Did try to recreate the connection few times, previously on bad pass it'd just throw a conn refused in logs but this time I got nothing and the fact that ipmitool worked on it's work (without configuring it) would've made me believe it created the connection fine. failing that, I'll give it a good ol turn it on and back off again.
-
Hey, thanks for your work on this, it looks like I managed to break something after a reboot and it no longer sees network ipmi, it doesn't report any issues and using ipmitool from nerdpack in console reports the sensors correctly. I can only see the hdd's and hdd temp reported from unraid. Gave it another reboot but still didn't do anything.
-
Hmm, scrap that, so I played around with it more. I Ruled out local and networking, all of which looked as expected. The issue is isolated to the vpn tunnel, I say that because I've also tried another brand new container, same results, brand new qbit container, same results. is what traffic looks like, with spikes being when I briefly turned vpn off for testing, where you can clearly see a spike to expected 13-15mib/s So, playing around with ovpn files, looks like it's not liking tcp, after changing nordvpn connection profile to udp, it instantly kicked back into proper speeds saturating entire wan link at 13mib down. Both can be replicated on delugevpn and qbittorrentvpn containers, with default config. Change itself must've been over a week ago or was introduced in unraid 6.8 as I haven't noticed it prior.
-
Hey, thanks for the work on container; lately I seem to be really struggling with down speeds, can't seem to get anything more than 3MB/s down and 1MB/s up, must've been happening for around a week or two (I auto update containers so can't tell exactly). Previously I'd easily saturate the wan link (130mbps and 40mpbs up). There weren't any changes or anything that'd affect this? I did upgrade to 3.8 around the same time as well if that changes anything. Using nordvpn UK p2p tcp vpn (same server and ovpn file, but tried others as well). Thanks


