






falconexe
Community Developer
-
Joined
Everything posted by falconexe
-
Thanks man! I'm definitely feeling it! It's like a puzzle that MUST be balanced ha ha.
-
I just posted a sneak peak here... https://forums.unraid.net/topic/96895-ultimate-unraid-dashboard-uud/?do=findComment&comment=897421
-
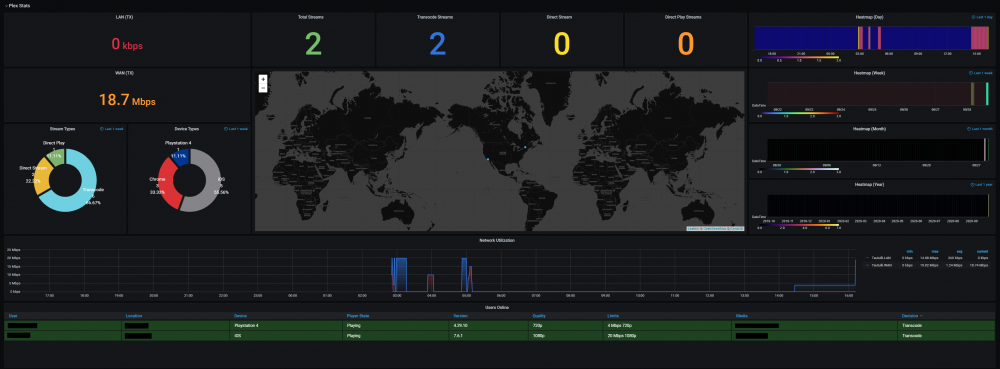
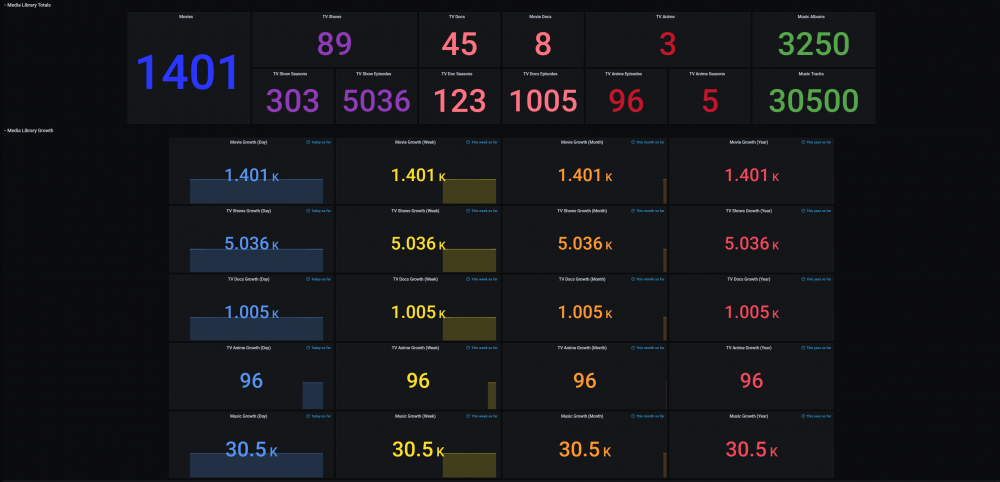
I've been working on both 1.4 and 1.5 simultaneously. They will still be released separately, but the code overlaps in some areas, so I had to figure some of it out now. Goal is for a super clean and refined Varken/Tautulli/Plex Dash which will be integrated directly into UUD, sporting some of the same falconexe style/customizations (like working growth trending) found in the UUD. @Stupifier Thought You Would Appreciate This Sneak Peek...
-
I ran that thread. This one will help more! I am the developer of the Ultimate UNRAID Dashboard (UUD). Check it out!
-
No worries. Happy to help!
-
@testdasi You may want to consider this. I’m tentatively planning on adding Varken/Plex panels/stat tracking to the Ultimate UNRAID Dashboard (UUD) in version 1.5. Not a guarantee until I get into it, but if I can integrate some/all of it, that would be cool.
-
Thanks for the positive feedback. Don't forget to save one last time with the correct variables populated and working! 😉
-
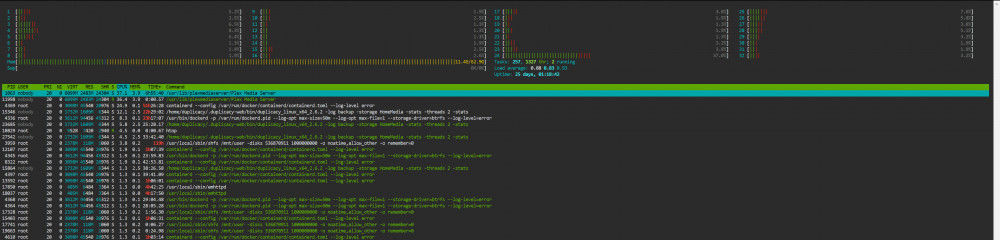
That not I am aware of in Grafana. But what you are looking for is call HTOP. Click on the terminal and type it in. And Here's a Bonus: 20 Command Line Tools to Monitor Linux Performance https://www.tecmint.com/command-line-tools-to-monitor-linux-performance/


-
Cool. De rien!
-
FANTASTIC!!! Glad to hear it!
-
@shwa87 So I looked at the code, and everything looks perfect. Everything acts correctly. Can you try putting in a different value in to the UPS variables (MaxWatts and kWh)? Save the dashboard, and then refresh? If it works, put the values back and save again. The only time I have ever seen this is if those 2 variables are not set. If I empty those 2 variables, this is what I see. If I put them back I get. If the issue persists, can you post a screenshot of your UPS section?




-
I'll look into it. I run the same code with those variables and my graphs display fine. It is possible that when I made the variable name change, there are lines of code remnants looking for the old variable. I am going to tear it down at the code level and look for anything weird in the JSON. I'll also branch this version and rename the variables and queries back to the original name to see if that solves it. Stay tuned.
-
Yeah definitely something specific to your system, and I agree, something sounds corrupted. Let us know if you get it fixed and how you did. It may help someone else someday.
-
Nope, share paths do not exist inside of "disk" which is the plugin grabbing that data. /mnt/user is the path for the array disks. Since the share sits on 1 or more disks in the array, it get's counted. The only thing I can think of is put that share on a single disk and remove it from the query where path DOES NOT EQUAL that disk.
-
Unfortunately, this is not something I can fix. I have never heard of this before and have no idea what could have caused it. You are the only person reporting this so far. I would try installing a secondary copy of 1.3 and see if the default version has the same issue. You could also try reverting your current dashboard to a previous version before the appdata backup and see if that helps. Perhaps the appdata plugin corrupted something? I myself use the same exact setup and don't have the issue and I've backed up 4 times now since I started. Try those 2 options and let me know if it get's fixed. I'd also be curious if this happens from another computer and also a different browser.
-
Quick UUD development update. Work on Version 1.4 continues. It is going to be a few more weeks before it is released. Thousands of lines of code, new panels, bug fixes, optimizations, and even more capability (including multi server). Thanks again for all of your feedback and continued support. My Wife hates me right now (JK), but you guys love me, so....😂 As a way to assist the UUD community, IF you have your UUD working, and would like to assist, troubleshoot, and guide new users along, that would be fantastic. The more support I do, the longer it takes for 1.4 to drop. I have multiple day jobs and also run a company, so time is limited. I appreciate it! Have a great coming week everyone!
-
Please confirm that you restarted the Dockers in this order. Stop: Grafana > Telefraf > InfluxDB Start: InfluxDB > Telegraf > Grafana Please also clear your browser history/cookies. Enough time should have pass by now for a few new datapoints to be inputted into the database, so I would expect all of these drives to have data in many of these fields. I built the query to retag NULL values as "N/A" as well, so even if some are missing, due to different drives technologies where some attributes do not apply, it won't break anything. Finally, I cannot guarantee that something didn't change within the query and/or related settings (either intentionally or by accident). If all else fails, you can try loading the following JSON into just that panel to "reset" it back to the default that was released in version 1.3. I already provided those instructions on how to accomplish this above in past posts. They have also been posted numerous times within this topic (see page 10). Drive S.M.A.R.T. Health Overview.txt Once you do all of this, please post a screenshot of both the query raw data table and the actual panel again. And Report Back...
-
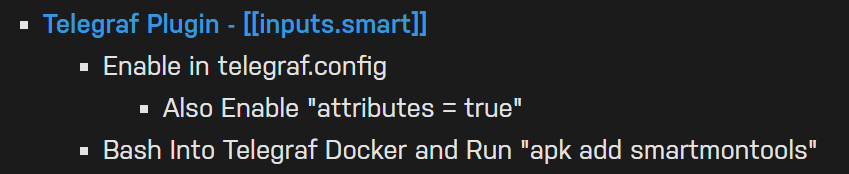
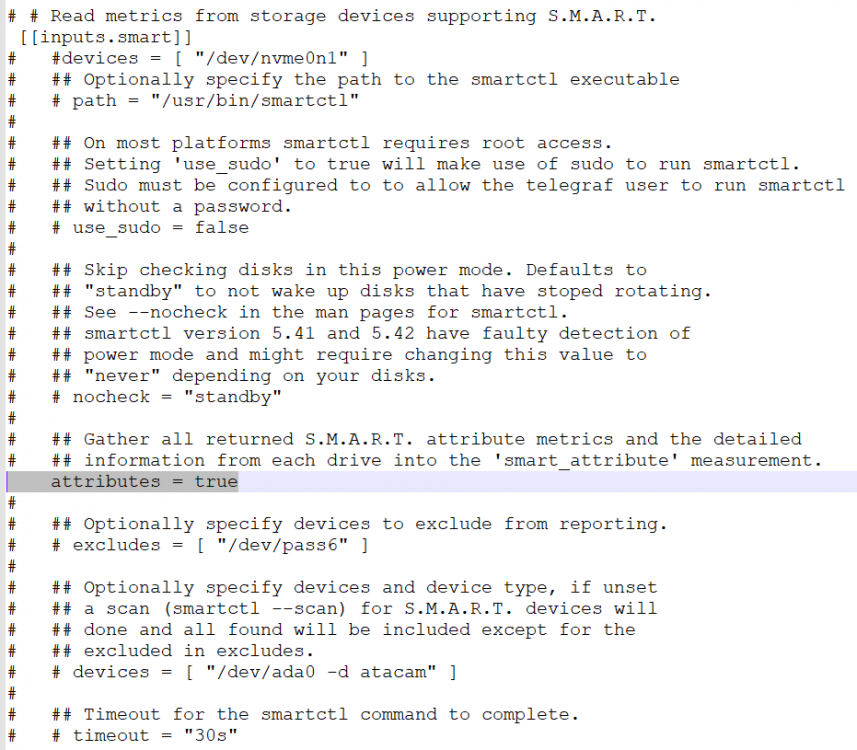
@MrLondon Yeah, so you missed the following when you installed it. Within the telegraf.conf, you need to add/uncomment/set to true the following line. Get that fixed and restart all 3 dockers (Grafana/Telegraf/InfluxDB). I'm betting your issue will be resolved!
-
It is possible something was missed in the install/config with S.M.A.R.T. I'm noticing that you seem to be missing data any time "smart_attribute" is being called, but you do have data for "smart_device".
-
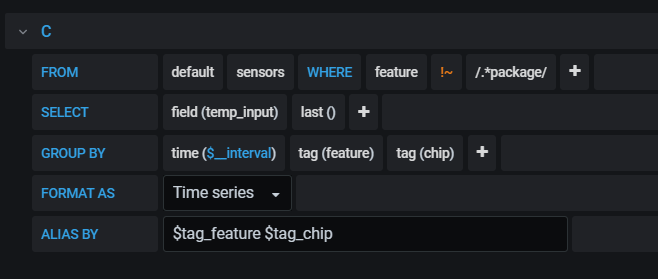
@MrLondon Here is a sample CPU query using sensors from GilbN's original dashboard. Not sure if it will work for you, as I can't test it on server hardware, but if you plug this in, it might just work. Here is the JSON for that single query too. First save the dashboard. Duplicate the current panel. You can then click the new panel, select "Inspect > Panel JSON", remove the old JSON code, and past this in and click Apply. { "datasource": "$telegrafdatasource", "fieldConfig": { "defaults": { "custom": {}, "unit": "celsius", "min": 0, "max": 100, "thresholds": { "mode": "absolute", "steps": [ { "color": "rgb(0, 255, 255)", "value": null }, { "color": "#EAB839", "value": 50 }, { "color": "red", "value": 75 } ] }, "mappings": [] }, "overrides": [] }, "gridPos": { "h": 12, "w": 11, "x": 2, "y": 18 }, "hideTimeOverride": true, "id": 128, "interval": "$interval", "links": [], "options": { "reduceOptions": { "values": false, "calcs": [ "lastNotNull" ], "fields": "" }, "orientation": "horizontal", "displayMode": "lcd", "showUnfilled": true }, "pluginVersion": "7.1.5", "targets": [ { "alias": "$tag_feature $tag_chip", "groupBy": [ { "params": [ "$__interval" ], "type": "time" }, { "params": [ "feature" ], "type": "tag" }, { "params": [ "chip" ], "type": "tag" } ], "measurement": "sensors", "orderByTime": "ASC", "policy": "default", "query": "SELECT distinct(\"temp_input\") FROM \"sensors\" WHERE (\"chip\" = 'coretemp-isa-0000' AND \"feature\" = 'core_0') AND $timeFilter GROUP BY time($__interval) fill(null)", "rawQuery": false, "refId": "C", "resultFormat": "time_series", "select": [ [ { "params": [ "temp_input" ], "type": "field" }, { "params": [], "type": "last" } ] ], "tags": [ { "key": "feature", "operator": "!~", "value": "/.*package/" } ] } ], "title": "$host - CPU Temp", "transformations": [], "type": "bargauge", "cacheTimeout": null, "description": "", "timeFrom": null, "timeShift": null }
-
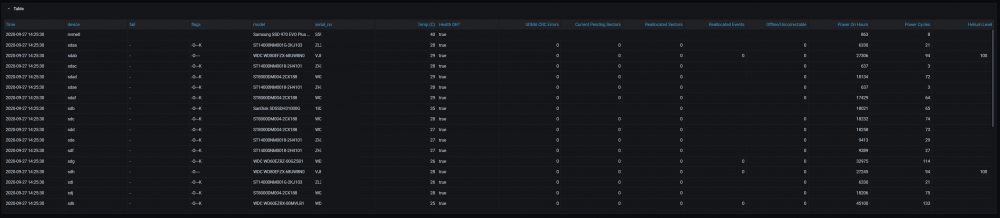
Yeah you'll need to use sensors for that MB/CPU hardware config. IPMI will not work. The S.M.A.R.T. query looks normal on your screenshot, but I also need to see the data. Can you scroll down and post a screenshot of the table below? It looks like this. Feel free to sanitize the serial numbers out. We need to see where the data is falling out. AKA, what drives and/or fields are not showing up (if any).
-
Clear cache and cookies and report back.
-
What kind of hardware are you running on? If you can't use IPMI (AKA you are on non-server hardware), which the dashboard is currently configured for, you will need to modify the queries to instead use "Sensors" now that you have that plugin installed and activated. @GilbN do you have any example query language you can send him for sensors? Grafana should display output immediately and will refresh based on your currently set interval. Please let us know what your S.M.A.R.T. query looks like. Right click the plane and click "Explore". Screenshot both the query and data so we can see what you are dealing with.
-
Thanks for the feedback. I’ve been debating wether or not to just include a default Telegraf config. I’ll probably do this now so all anyone has to do is add their host/IP address in there. That way everything on the UUD will just work without much fussing around with code. Furthermore, I’ll probably end up making COMPLETE install instructions instead of pointing people to other websites. Just need some time to write it all up. I’m currently super deep into developing Version 1.4...and it’s a massive update. We’ll continue to dial the UUD in with each release. It’s a ton of work and planning as you can imagine. So far, everyone is loving it. There is a slight learning curve, but the ROI is tremendous and this entire thing is just plain friggen cool!
-
Finally, let us know when you would like to tackle the APC/CPU temps issue. One thought on CPU temps is that you may not be running on server hardware, and therefore IPMI doesn't apply. In that case you can try using the sensors plugin. I'll be adding this support to version 1.4.






