doma_2345
Members
-
Joined
-
Last visited
Everything posted by doma_2345
-
Yes, i have tried restarting the docker service. I have tried doing a force update. I am not sure what the 'template function' is (i assume you mean reinstalling from template) i havent tried this and dont really want to delete all of these containers to do this, In terms of editing them i am not sure what has been removed in the last update to edit them to put it back.
-
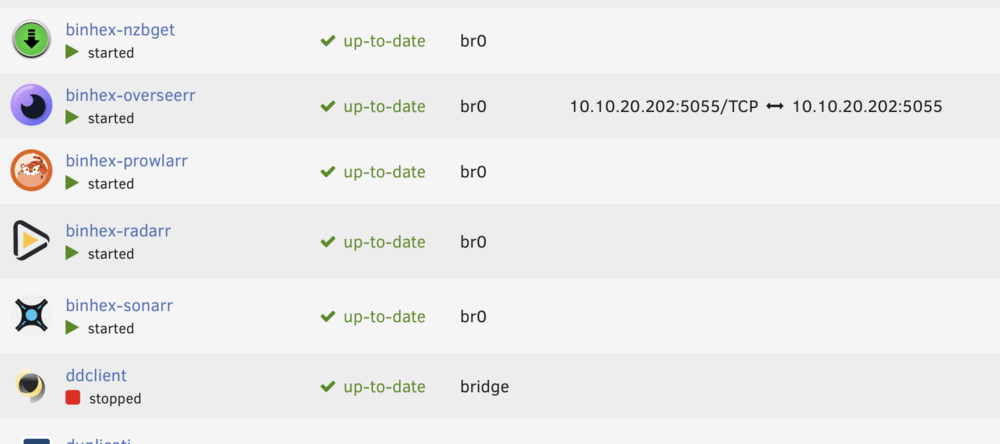
I have noticed that on all of my binhex containers the port mappings are now empty after the latest update of the containers. The only one that didn't update was overseerr which still has the port mappings. Any idea how to fix this as it causes issues when I click the webui menu button as it doesn't work.
-
Ok, i didnt reailse that, but assuming I am only writing file of max 20gb it will leave around 500gb free? I have my cache drive set to leave 250mb free but presently it is leaving 500gb (approx) free. I have found where to file a big report so have done so.
-
This was originally reported here and seemed to be fixed at some point meaning the cache drive could be fully utilized. However, when I upgraded to 6.10.x the issue/bug seems to be occurring again. I have my shares set to leave 500gb free on all my array drives, however this means that when my 1tb cache drive gets to 500gb utilization, any new copies start to write to the array, The old functionality used fill up the cache drive to 1tb and then start to write to the array. I cant see how this could have been implemented as a design feature by the fact that the functionality keeps changing and it also makes having large cache drives completely redundant if it only uses some of the available space. 35highfield-diagnostics-20220818-1538.zip
-
This was originally reported here and seemed to be fixed at some point meaning the cache drive could be fully utilized. However, when I upgraded to 6.10.x the issue/bug seems to be occurring again. I have my shares set to leave 500gb free on all my array drives, however this means that when my 1tb cache drive gets to 500gb utilization, any new copies start to write to the array, The old functionality used fill up the cache drive to 1tb and then start to write to the array. Not sure how to report this as a bug and cant see how this could have been implemented as a design feature by the fact that the functionality keeps changing.
-
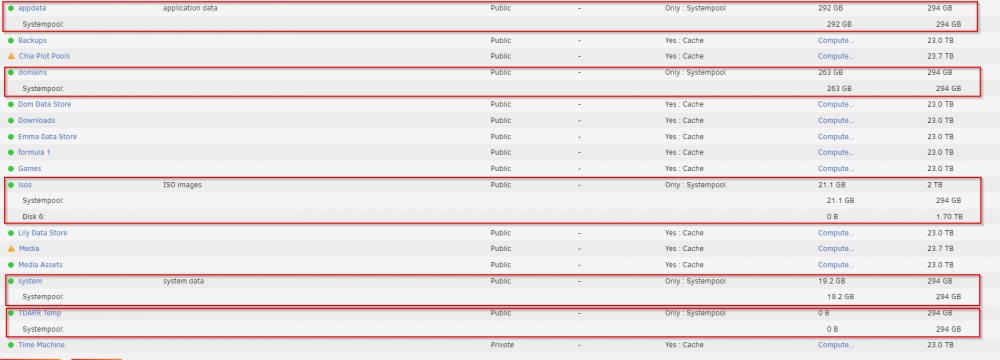
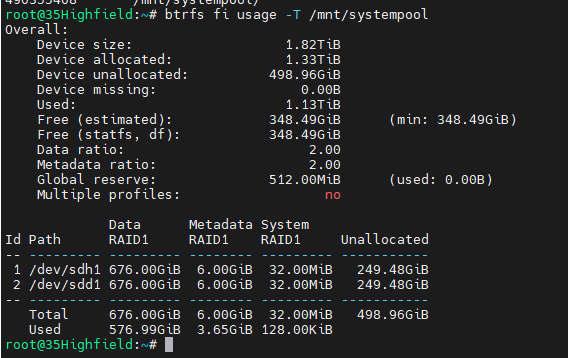
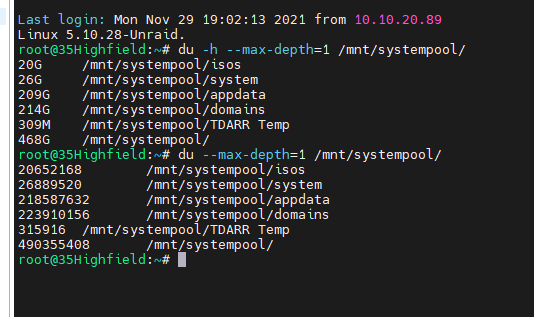
I am looking into the usage / capacity of a pair of raid 1 btrfs pool ssd's I am trying to work out what is taking up the space but i seem to be unable to get correct usage stats The main gui reports the following DF -h report the following which largely matches the GUI DU -h -d 1 reports this, which seems off and the shares page reports this, which is also different there is nothing other than these shares on the drive How do i get the true file size, i believe the total usage is correct but the individual share sizes is wrong, how do i get a proper overview of the sizes of the shares?


-
from looking into this du should be reporting a larger amount than btrfs reports not a smaller amount.
-
actually i think i might have been reading it wrong, trying to work out the switch for file depth
-
Well thats a different number again
-
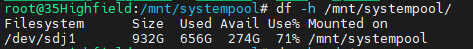
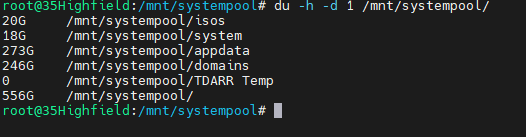
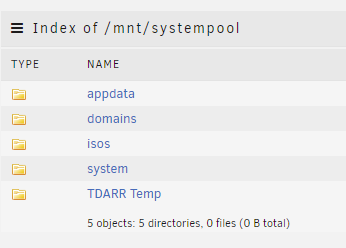
Hi All I wonder if someone could answer this I have a seperate pool set up /mnt/systempool The disk usage says the following These are two 1tb ssd's in a raid 1 configuration These are the system folders on this pool I thought it was strange the amount of spare capacity i had on this pool and when investigating found the following Why is the gui showing one thing and cli showing another?

-
Although a pain and a long process, I can live with parity being rebuilt, at least I know now how to do it, (Tools > New Config) and my OCD can rest easy.
-
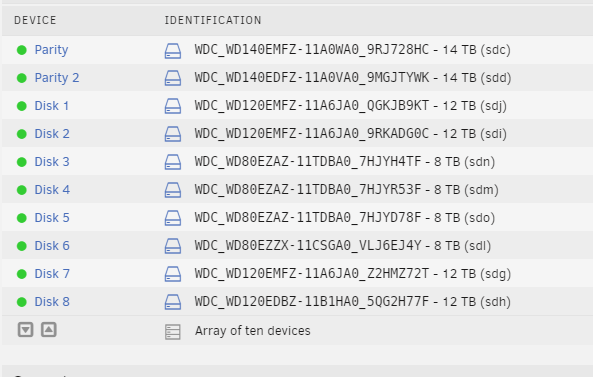
I know this has probably been asked before, but I couldnt find a suitable answer. This is how my disks look currently and its killing my OCD as the disk sizes arent grouped together. I would like to group all the 12tb drives together as disks 5 - 8 Is the fix as simple as stopping the array and re-assigning the disks, or is this totally not the way to do it, is there even a way to do it? These disks are not empty so I dont want to reformat and lose the data, so need to avoid that scenario.
-
everyone please be aware of this bug i lost my first two chia farmed becuase of it, make sure you config file is correct https://github.com/Chia-Network/chia-blockchain/issues/3141
-
great to see this on the test version, much easier than checking the logs. Also much better than the response times I was getting on VM accessing the shares
-
do you have nightly back ups of your appdata folder using CA Backup, the docker containers are stopped for this, i believe the default time is 3am
-
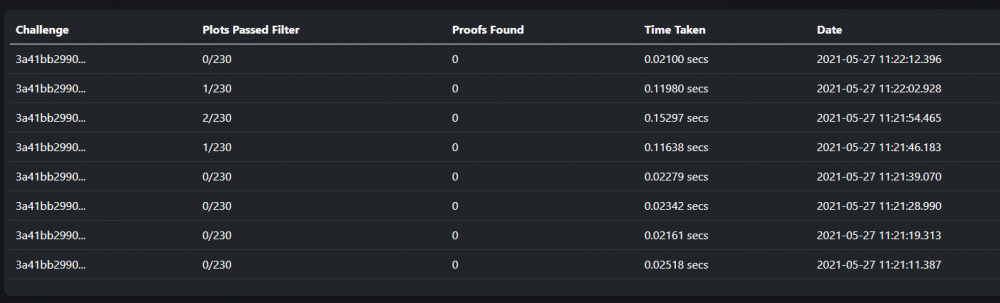
on my summary page it shows total plots as 214. On the farming page it only shows 170 plots. I saw in an early post there was a fix coming for multiple plot directories in 0.2 I have version 0.2.1 installed was this fix included. I also see on your wiki the farming page shows time to win. This seems to be missing on my farming page?
-
Can anyone tell me why i see this and how to resolve it?
-
so i rebooted again and disabled a docker container that had an error in the first set of diagnostics and has been installed for about the same amount of time as i have been having docker issues which may have been caused by this all along and it is now working. but it does seem to be docker containers causing this issue.
-
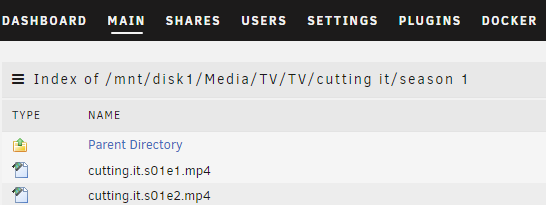
this error still shows Apr 15 16:45:12 35Highfield shfs: shfs: ../lib/fuse.c:1451: unlink_node: Assertion `node->nlookup > 1' failed. what do i do now?
-
So i have rebooted and my shares are still missing 35highfield-diagnostics-20210415-1648.zip
-
good to know, but also FFS. if I reboot how does that affect the parity rebuild will it start from where it left off or will it start again?
-
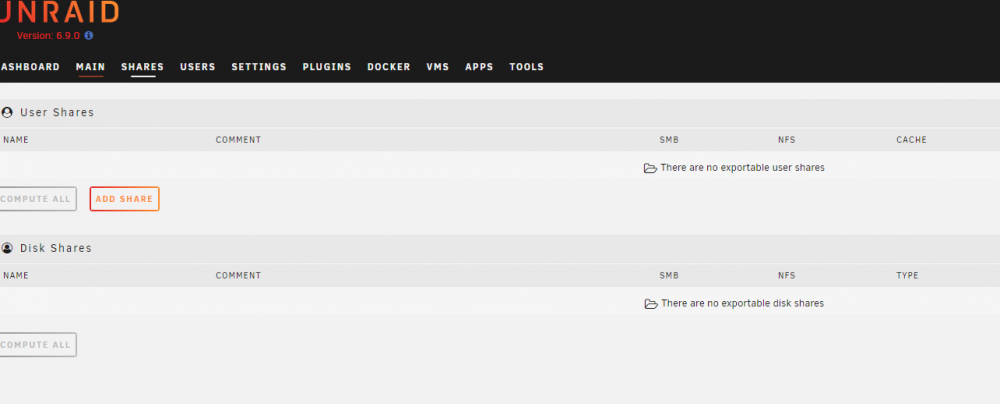
I had an issue with one disk going off line with no SMART errors it just became disabled, in trying to fix that and swapping cables around I ended up with two disabled disks. I started a parity rebuild of those two disk, apparently there is no way to just add them back into the array once they are disabled. Then this afternoon my docker service crashed, when all my shares disappeared. My docker service has been crashing fairly regularly since installing 6.9.0 Browsing the disks the folders are there with data in but the shares are missing But because the shares are missing all access to these files has stopped. I don't want to reboot the server as this will interrupt the parity rebuild. Any help would be appreciated, diagnostics attached. 35highfield-diagnostics-20210415-1618.zip
-
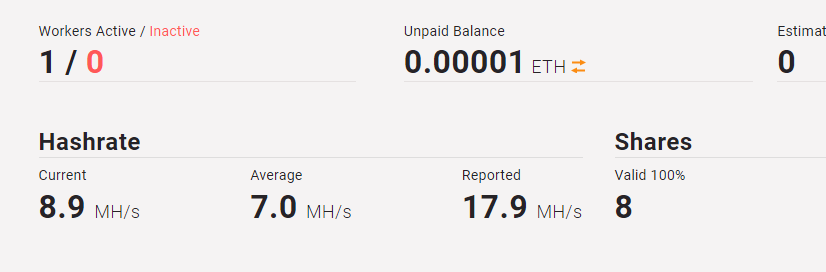
I have just set this up on a p4000 can anyone explain to me why the current and reported hashrates are so different, is this because of dev and pool fees?
-
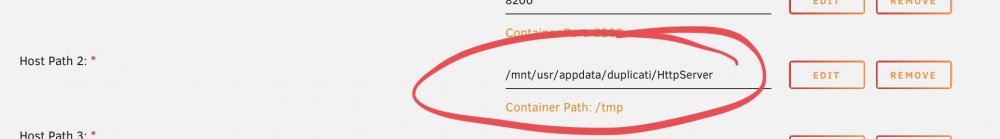
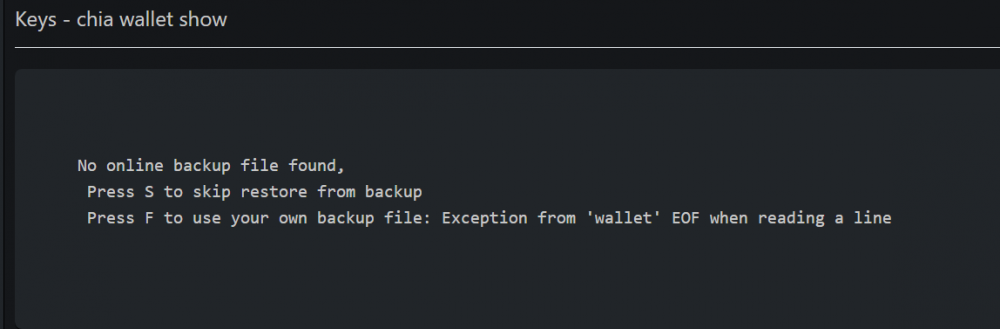
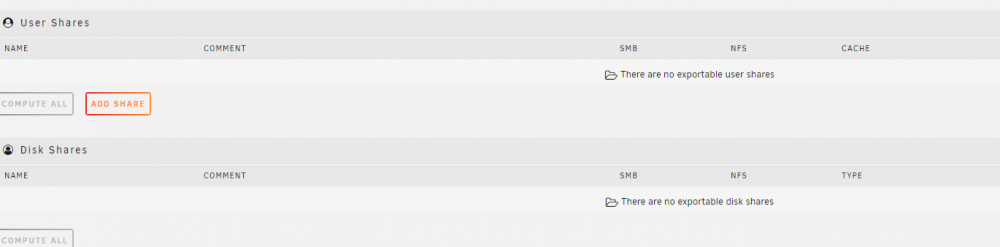
after resolving the missing httpserver folder error, the latest update broke it again and i had to update my template to remove that fix, that gained me access to the GUI however I am now getting the following error. I backed up one of my backup tasks and deleted it, i then tried restoring that back up and the file import failed, i then added the back up task manually but that also did not resolve the issue. Any ideas?
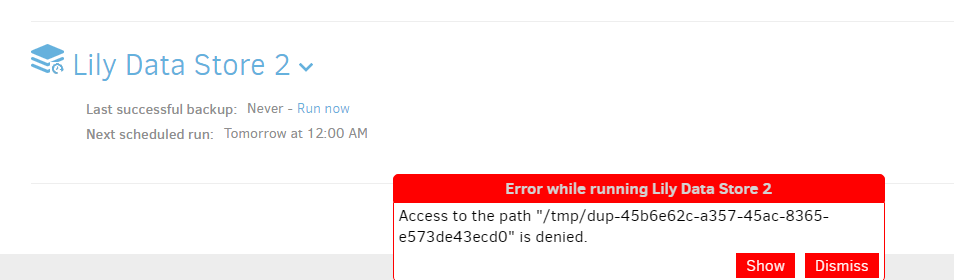
-
I have managed to fix this with the following that i found on the duplicati forum from 2018